How to Monitor Your SNMP Devices with Telegraf
By
Samantha Wang
updated December 14, 2025
Use Cases
Product
Developer
Navigate to:
At its core, the major goal of network monitoring is simple: you’re trying to collect all relevant information about the devices on a network that you can, in order to detect and address failures in devices and connections for the purposes of maintaining both compliance and network security.
Many don’t realize, until it’s too late, that faulty network devices are more than just a burden – they pose a very serious threat to networks everywhere. Those devices, if left unchecked, could easily be compromised by hackers, and if they’re able to gain access to that device, every last kilobyte of data stored on the network could be in jeopardy.
Beyond security, network monitoring is essential because it allows you to understand exactly what is going on with your network in terms of usage and performance at any given time. Not only will this save a tremendous amount of time because it helps you mitigate downtime wherever you can, but it also helps stop small problems today before they become big ones tomorrow thus saving you a lot of money as well.
To that end, there are a number of tools available to you to monitor network performance via metrics that make the most sense given what you’re trying to accomplish. One of those is SNMP – a solution that has been around for many years and that will prove useful in any environment in more ways than one.
Recently, we released a new SNMP Trap input plugin in Telegraf 1.13. I’d like to tell you more about that plugin and how you can use it.
What is SNMP?
Short for Simple Network Management Protocol, SNMP is an application-layer protocol that is commonly used to manage and monitor devices that are co-existing on a network. At its core, it provides a common way for many devices like routers, access points, printers and more to share monitoring metrics with one another, all so that the people using those devices can have access to the most actionable and accurate information to work from at all time.
Is SNMP still used?
Yes! Even though SNMP was defined in 1988 – an eternity by tech standards – it’s still widely used for monitoring and management. There are three main versions of SNMP – versions 1, 2 and 3. If you have a choice, use SNMP v3, since it has increased security capabilities: user accounts, authentication, and data encryption.
What is SNMP used for?
Simple Network Management Protocol (SNMP) is an application-layer protocol used to manage and monitor network devices. SNMP provides a common way for devices on your network – such as routers, WiFi access points, and printers – to share monitoring metrics. The beauty of SNMP is that it’s been around forever so many different vendors support it, and that it works over both local area networks (LANs) and wide area networks (WANs). SNMP is also used for some internet of things (IoT) devices.
In other words, SNMP is a very effective tool for network management. If you need to be able to get both a historical and real-time view into the status of all devices on a network, regardless of how complicated it may be, SNMP is one of the most straightforward ways through which to do it. By design, SNMP is an easy, flexible way to organize all of the devices across a network in a way that makes the most sense given what you’re trying to accomplish.
SNMP is also invaluable in terms of collecting huge amounts of information as fast as you can, all without clogging the network in question with traffic at the same time. Because all information about a device’s status is A) always available in a simple format, and B) updated in real time, you can get access to important information without waiting for all data to be collected or without needing to deal with large data transfers as you would with other techniques.
What is SNMP monitoring?
Generally speaking, SNMP monitoring involves taking a closer look at network interface status information like bytes in and out, input and output errors, CPU and memory usage and more. It does this via a series of object identifiers (OIDs) that use a hierarchical tree structure organized into a Management Information Base, or MIB.
To put it in the most straightforward terms possible, the object identifiers bring out the set of information exposed by the devices and systems, all of which are monitored via the active SNMP interface.
As stated, the fact that this MIB and OID data hierarchy is used brings several important benefits to the table that you would be hard pressed to replicate through other means. Chief among them is the fact that information can be pulled by managers very quickly, all without specifically having to force the agent to go out and collect it. Not only does this go a long way towards reducing network overhead, but it also guarantees that all relevant information about a network’s status is always available at a moment’s notice.
What are SNMP Traps?
SNMP Traps are alert messages sent from a remote SNMP-enabled device to a central collector, the “SNMP manager”. SNMP exposes data via object identifiers (OID), whose hierarchical tree structure is organized in a Management Information Base (MIB). MIBs are text files provided by equipment vendors that lists all data objects (OIDs) managed by a specific equipment.
Your SNMP manager will use the MIB to interpret the incoming messages from your new device. Trap messages are the main form of communication between an SNMP Agent and an SNMP Manager. A major benefit of using SNMP Traps for reporting alarms is that they trigger instantaneously, rather than waiting for a status request from the manager.
How can I use Telegraf to monitor my SNMP Traps?
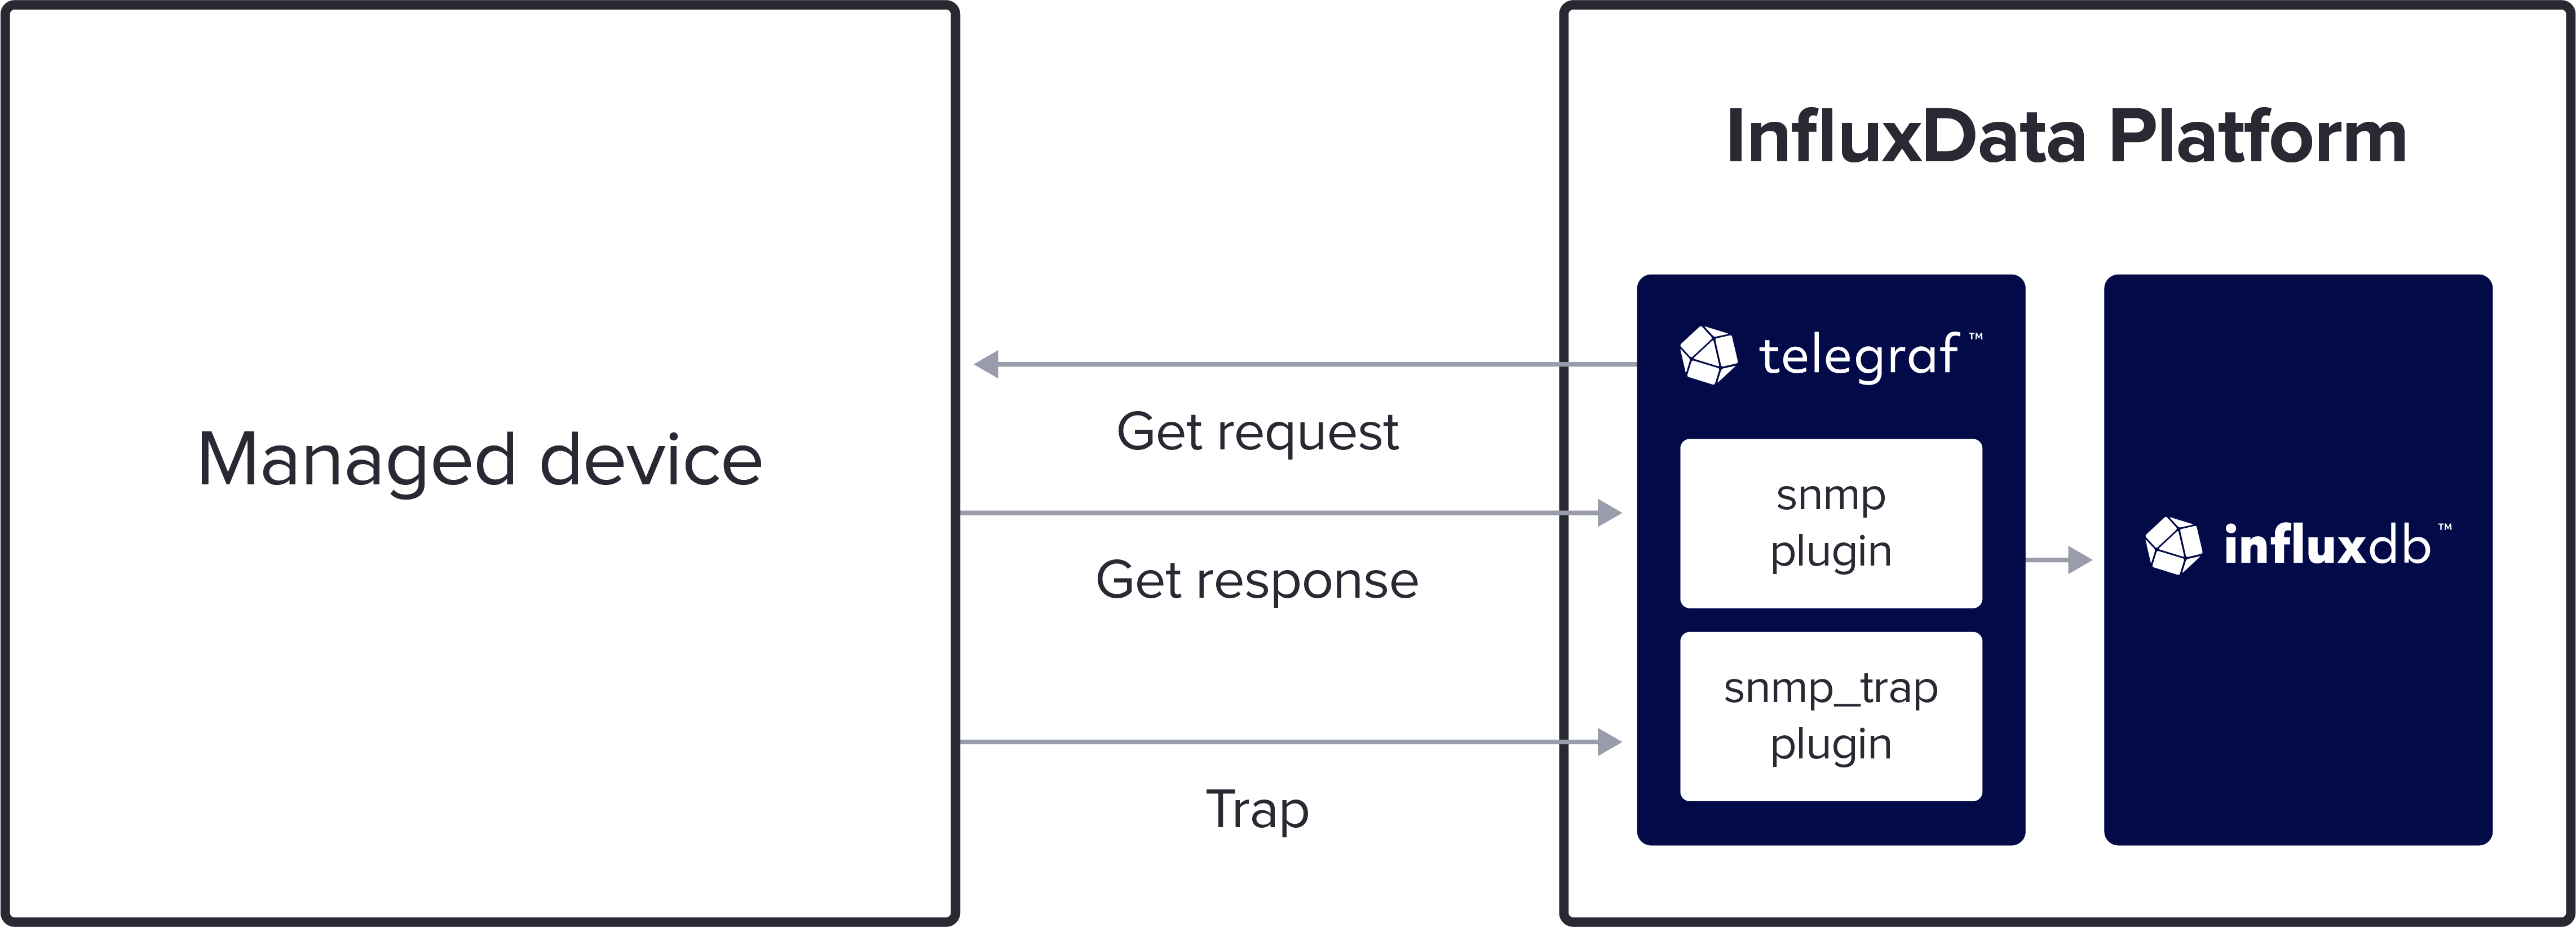
The Telegraf SNMP Trap Input Plugin receives SNMP notifications – traps and inform requests – to give a real-time view of system and network performance issues. In addition, by monitoring SNMP traps, customers can balance resource consumption impact (both system and network) caused by pulling SNMP data in short intervals. For example, when a power supply unit or disk failure occurs, Telegraf would receive the SNMP trap and send it to the output plugins. You could then configure an alert to notify you or your team of the failure.
How do I properly configure my SNMP Trap Plugin?
Like most Telegraf plugins, the SNMP Trap Input Plugin does not require much configuration. Some prerequisites to install tools from the net-snmp project are required. In addition, on many operating systems, listening on a privileged port (a port number less than 1024) requires extra permission. Since the default SNMP trap port 162 is in this category, using Telegraf to receive SNMP traps may require elevated permissions.
[[inputs.snmp_trap]]
  ## Transport, local address, and port to listen on.  Transport must
  ## be "udp://".  Omit local address to listen on all interfaces.
  ##   example: "udp://127.0.0.1:1234"
  ##
  ## Special permissions may be required to listen on a port less than
  ## 1024.  See README.md for details
  ##
  # service_address = "udp://:162"
  ## Timeout running snmptranslate command
  # timeout = "5s"
What metrics are collected from Telegraf SNMP Trap plugin?
Tags:
| Tag | Description |
|
IP address of trap source |
|
value from SNMPv2-MIB::snmpTrapOID.0 PDU |
|
Management Information Base (MIB) from SNMPv2-MIB::snmpTrapOID.0 PDU |
|
Object Identifiers (OID) string from SNMPv2-MIB::snmpTrapOID.0 PDU |
|
Version "1" or "2c" or "3" |
Fields:
Fields are mapped from variables in the trap. The field names are the trap variable names after MIB lookup. The field values are trap variable values. (example fields: sysUpTimeInstance (integer), snmpTrapEnterprise (string))
Example of Telegraf collecting SNMP Traps during a SNMP Server (snmpd) Restart
Above is a quick demo using the SNMP Trap plugin where Telegraf is set up to receive traps on port 162 of an SNMP virtual machine. All agent settings are default configurations.
Input Plugin configuration from demo:
[[inputs.snmp_trap]]
service_address = "udp://:162"
The virtual machine used in the demo has net-snmp’s snmpd to send version 1 and version 2c traps to Telegraf. In the demo, the virtual machine is restarted and therefore will send shutdown (nsNotififyShutdown) and startup (coldStart) traps to Telegraf.
Output Results from demo (select “view raw” to view entire raw text in full screen):
Frequently asked questions about SNMP
What is an SNMP Manager?
The most important thing to understand about SNMP is that it operates based on a very simple client-server architecture. The servers in this case are called managers, and they collect and process all information about the devices on a particular network.
What is an SNMP Agent?
Along the same lines, the clients in this architecture are called agents they are any device connected to the network that may be sharing information with the others. In addition to computers, these can also involve network switches, phones, printers and similar types of devices.
Where can I learn more about SNMP?
Thankfully, there are a wide array of different resources that you can use to further your education about SNMP. At InfluxData, we’ve written a helpful resource that you can take a look at right here. You can also go to Net-SNMP.org to get answers to your important questions and to learn more about what you can do with your deployment.
What are the basic commands of SNMP?
Just a few of the basic SNMP commands you’ll want to familiarize yourself with include:
GET, which is a request sent by the manager to the managed device to retrieve one or more values from that assetGETNEXT, which is used to retrieve the value of the next OID in the MIB tree that you're working withGETBULK, which is used by SNMP managers to either modify or assign a value to a particular managed deviceTRAPS, which is actually started by the agents and not the SNMP manager, and is used to send a signal to the agent whenever a particular event occursINFORM, which is also started by the agent, and includes a confirmation that the manager has received the aforementioned signalRESPONSE, which is used to carry back all information or signals as directed by the manager
Get started!
If you or your company are using any version of SNMP devices and want to monitor traps, try out everything you read in this Telegraf plugin! We’d love to hear how you’re monitoring SNMP using this plugin or any other InfluxData products. Join our Community Slack Channel where you can ask questions and engage with other people using InfluxDB!
