Monitoring a Pulse Oximeter with InfluxDB – A Parent's Perspective
By
Community
updated December 14, 2025
Product
Use Cases
Developer
Navigate to:

This article was contributed by Michael Hinkle, Probe Engineering and Manufacturing Supervisor at Texas Instruments.
My name is Mike Hinkle, and I use InfluxDB to monitor my daughter’s pulse oximeter and to better understand her overall health. Through my career as an engineer, currently at Texas Instruments, I was aware of time series databases and I love to play with various technologies. I desire to understand my daughter’s wellbeing in real-time and to be able to aid doctors in her ongoing treatment.
Using time series data to monitor health status
My daughter’s oxygen levels are continuously tracked with a pulse oximeter. Pulse oximetry is a test used to monitor the oxygen levels or “oxygen saturation” of someone’s blood. It’s an easy way to determine how much oxygen is being sent to parts furthest away from one’s heart, like legs and arms.
Prior to InfluxDB, I created a website to track my daughter’s health. It only displayed her current oxygen levels and heart rate. I had all of the data in a SQLite database, but I couldn’t view historical data. I had to rely on page refreshes to see new values. After a few months, I quickly had millions of rows of data which resulted in lags when trying to reload the data.
I knew it wasn’t the most effective way to track her health as the website’s data was old. I quickly realized that a 30-second data latency rate wasn’t sufficient. I was able to visually see she wasn’t getting enough oxygen before the data showed it. As my daughter sleeps in her own room at night, I also wanted to be able to understand her health stats while she’s asleep in real-time. The website couldn’t provide current data about heart rate or oxygen levels.
Using InfluxDB to monitor health
Within the last year, I discovered Grafana, started playing with it, and found the InfluxDB plugin. I realized that by using time-stamped data, I could start analyzing the data to find trends. Rather than having an inadequate website, I began to use InfluxDB to collect the data, created a dashboard in Grafana, and started tinkering with the data.
I quickly realized that a time series database might address my frustration with the data currently available to me, as health monitoring data is time series data. I wanted to be able to capture all data collected by the pulse oximeter and to analyze the data.
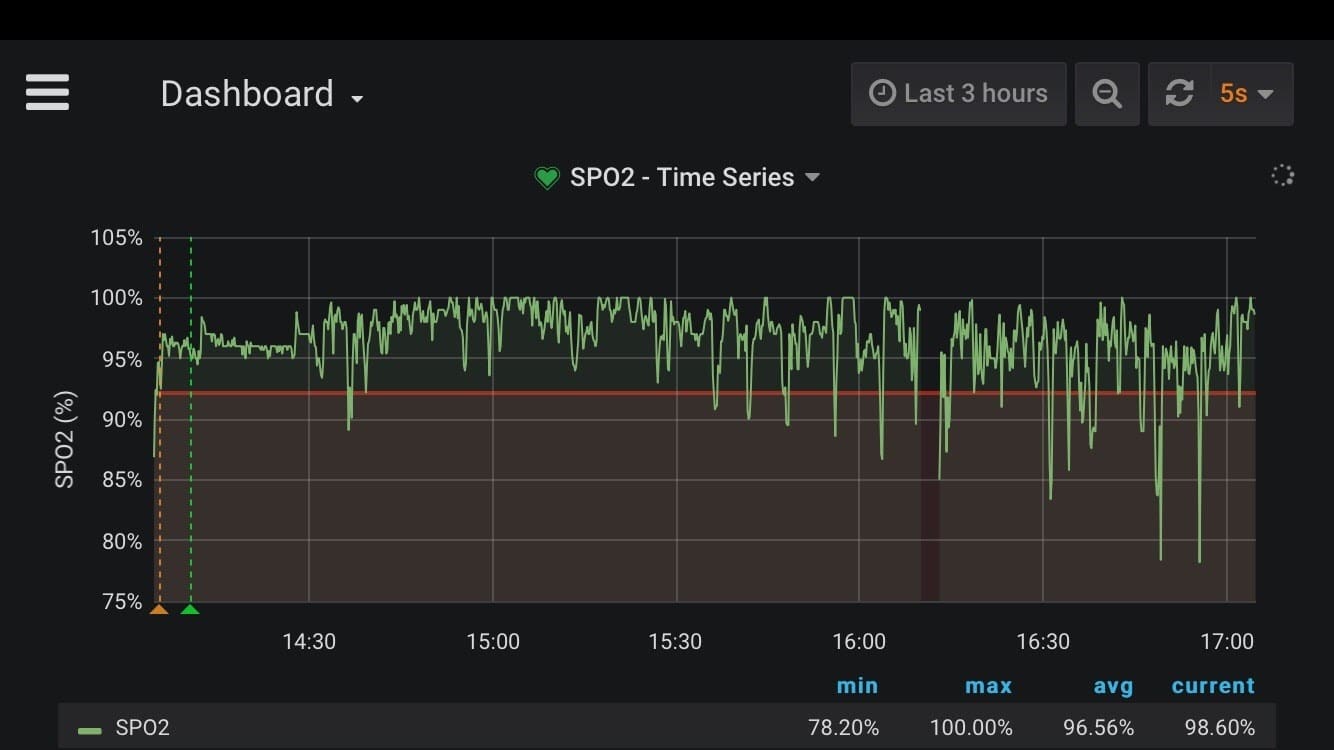
- The SPO2 graph represents changes in her oxygen levels – oxygen saturation levels of her blood.
- "S" stands for saturation, "P" is for pulse and "O2" is for oxygen.
- 92% is the threshold where Mike is alerted, and this limit was set by his daughter's pulmonologist.
I started off by using the DB9 port on the back of the pulse oximeter. I’ve done a lot of asynchronous communication with tools at work, so I was familiar with the principles behind the oximeter. I looked up the oximeter’s manual to discover the baud rate, how the encoding worked and determined how to extract the data. Once again, due to my work experience, I knew I could stream the data into any solution.
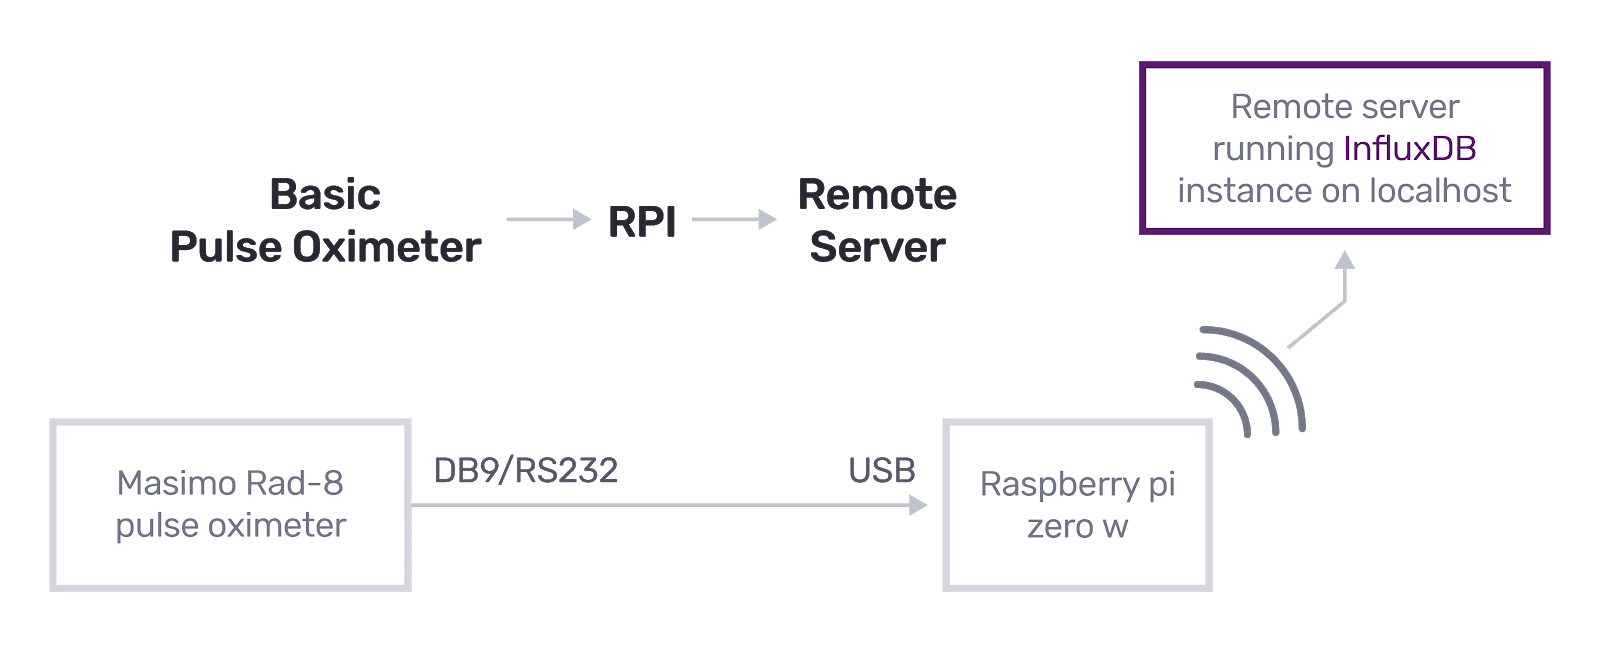
- RS232 is an asynchronous communication protocol used to transfer data between electronic devices. I use it to stream the data at a baud rate of 9600. This means it's capable of transferring a maximum of 9600 bits per second.
- Using a DB9 to USB cable, I transfer the data to a small Raspberry Pi Zero W.
- I run a Python script to open the oximeter's serial port to stream and parse the data.
- Finally, I use the Python client for InfluxDB to send the data to my home server.
By having enough data in InfluxDB, I have been able to determine trends within the data. I’m able to tell when she’s awake, asleep or drifting off. I can tell if she’s in pain or having problems. I have been able to better understand the signals and the data behind them. Rather than wondering if the beeps are coming from the pulse oximeter or the AC, my family and I have better peace of mind, as we can check on her while we’re on the other side of the house or outside.
Advocating for the right treatment
By storing time-stamped data in InfluxDB, I have been able to use graphs, generated in Grafana, to demonstrate to doctors when there have been issues in my daughter’s health status. Like any concerned parent, we take our daughter to the doctors when we see there’s something amiss. However, sometimes when we take her in, she’ll be doing okay and the doctors won’t understand our concerns. Armed with graphs, my wife and I are now able to demonstrate to the doctors when there’s been a drop in her oxygen levels.
It’s like a light switch: sometimes my daughter will be doing great, and then the switch flips and everything is different. Doctors look at you like you’re a crazy parent. I’m not in the medical field, but I am telling them I know something is wrong. This is where InfluxDB and Grafana came in because I’m able to capture the data, screenshot it, and take it into the doctor’s office. By having data to back up our concerns, we were able to start working with our daughter’s doctors to improve her treatment.
I realized that doctors took us more seriously when we had data to back up our concerns. We were able to prove that our daughter’s heart rate was going up with her old gastrostomy feeding tube (g-tube). Her heart rate was alarmingly high on her older feed. The doctors kept trying to push us to keep feeding our daughter the same food. That was until I was able to show our pediatrician her actual heart rate - thanks to time-stamped data stored in InfluxDB and visualized in Grafana.
Environmental impacts on health
Once I got my daughter’s oxygen levels into InfluxDB, I began to think of environmental factors that can influence someone’s health. By having environmental data stored alongside my daughter’s healthcare data, I have been able to make correlations between the data sets.
As she has hydrocephalus, my daughter has a ventriculoperitoneal (VP) shunt that drains spinal fluid from her ventricles down to her stomach. VP shunts are used to reduce the pressure on the brain which is caused by an accumulation of fluids. Hydrocephalus occurs when there’s atypical fluid buildup in the brain. My daughter’s VP shunt isn’t mechanical; it operates on differential pressure, meaning the difference in pressure between two specific points.
Through work, I have experience using tools which run at sub-atmospheric pressures, where I had alerts for when there were shifts in weather, I began to wonder if there was a correlation between the weather and my daughter’s health. From working with industrial sensors at work, I’m used to understanding pressure data through alerts. And more importantly, I knew that small differences matter.
"If these small signals make a difference for semiconductors, why wouldn't they make a difference for something [similar] that operates in my daughter's body?"
I began by dumping real-time barometric pressure, temperature and humidity data in InfluxDB. I’ve also tried to collect data from my daughter’s ventilator settings. I’d like to be able to understand her rate of breathing and volume. However, as I’m not in the medical industry, accessibility has been difficult. I’m only able to order 200 cables at a time.
I want to answer questions like: “Why does my daughter desat all of the sudden?” Desat is the term used when someone’s blood oxygen levels drop too low. By cross-referencing my datasets, I hope to understand whether or not barometric pressure changes impact her breathing. I hope that by providing doctors with the data, they will look into root cause analysis rather than just treating her symptoms. My family and I have had to bring her back a couple of months later because her condition hasn’t improved, and we’ve gotten shuffled between doctors rather than getting a resolution.
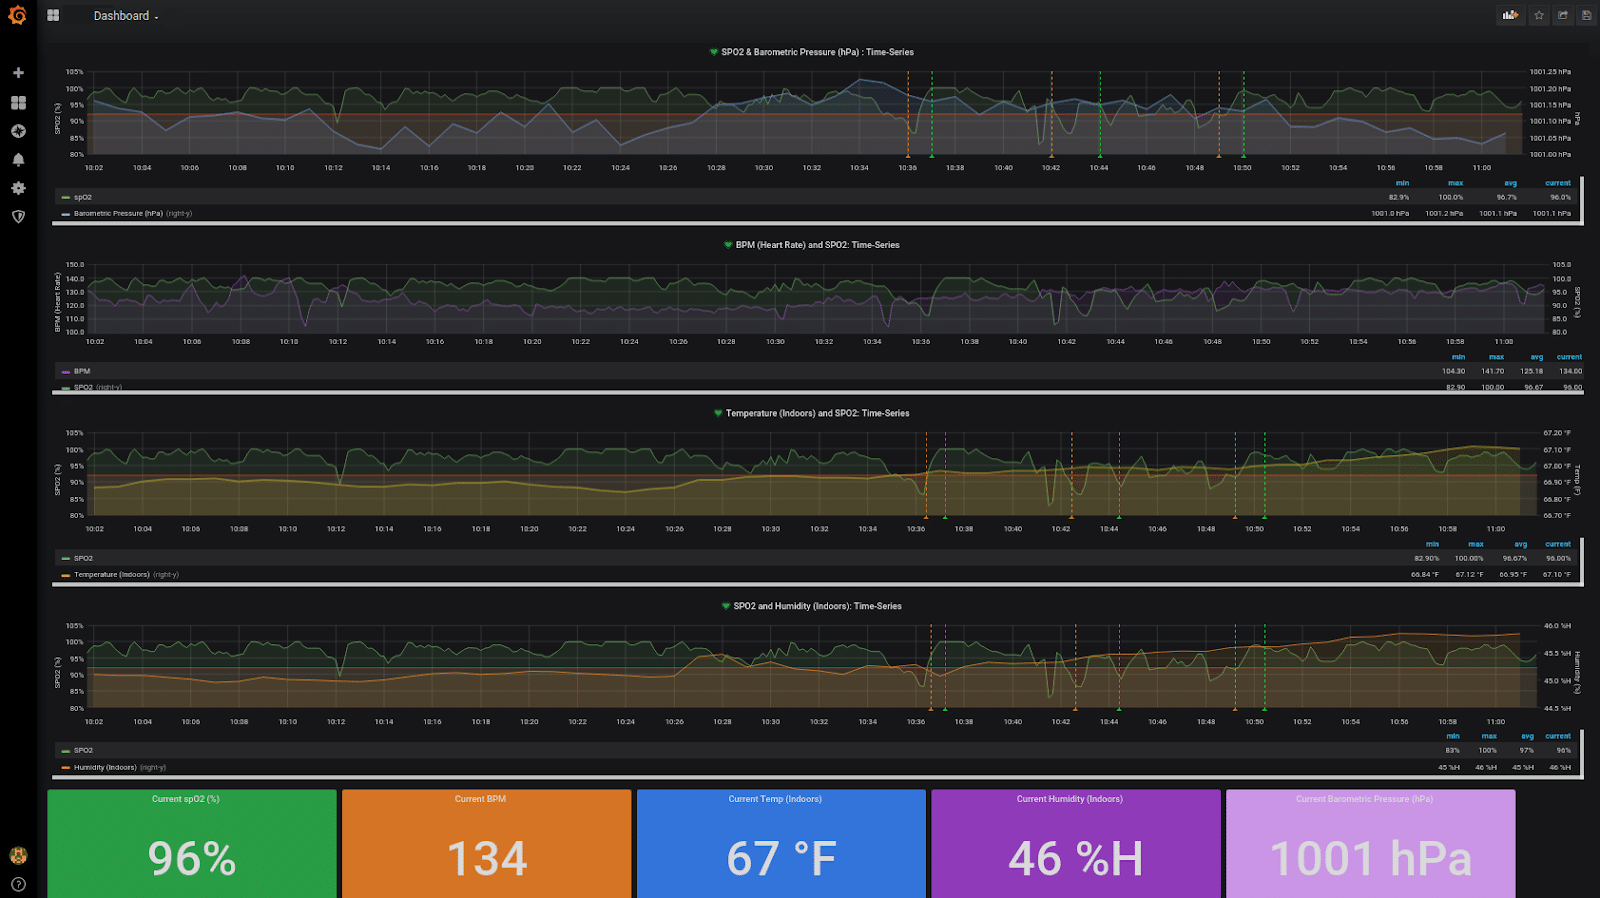
In addition to the five real-time data snapshots at the bottom of Figure 3, I’m correlating the time-stamped data between:
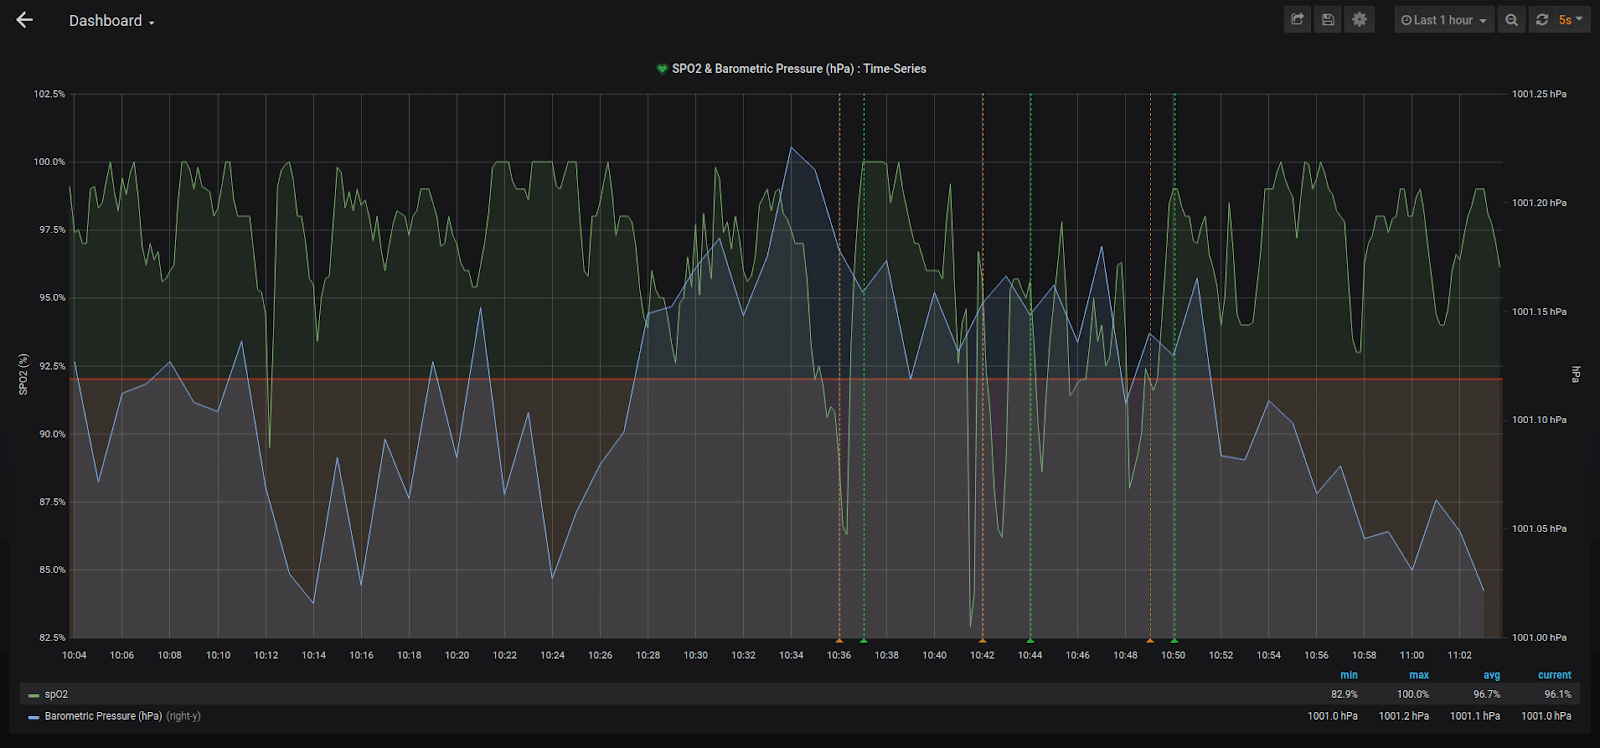
- Blood oxygen saturation levels (SPO2) in her blood and local barometric pressure
- Heart rate and her blood oxygen levels
- Indoor temperature and her SPO2 levels
- SPO2 levels and the indoor humidity levels
Next steps with InfluxDB
I’ve started capturing internal weather data and storing it in InfluxDB. I’m going to use R to run correlations and regressions. I just started capturing this weather data in the last few weeks, so I hope to have more time to play with the weather data in R. I’d like to wait until I have a couple months’ worth of data.
This dashboard is a recent addition as I begin to experiment with adding weather data. Having recently starting collecting atmospheric pressure, I hope to start correlating:
- SPO2 levels and local barometric pressure
I haven’t given up hope of finding a way to get the cable to extract data and settings directly from the ventilator. I’d like better insights into my daughter’s respiratory rate and other key data. I’m looking forward to understanding my daughter’s health even more so my family and I can get the best treatment for her. I also use InfluxDB at Texas Instruments – if you’re interested in learning more, click here.
