Monitoring AWS with Telegraf & InfluxDB Cloud
By
Al Sargent
updated December 14, 2025
Use Cases
Product
Developer
Navigate to:
Recently I’ve been playing with InfluxDB Cloud and Telegraf for synthetic monitoring of Amazon Web Services API endpoints, and thought I’d share my configuration notes.
What are InfluxDB and Telegraf?
InfluxDB is an open-source time series database, and Telegraf is a software agent for sending time-series data to InfluxDB. Telegraf has hundreds of plugins to collect different types of time series data.
One of these plugins, inputs.http_response, sends http/https requests to a list of URLs, and sends metrics about their responses return code, response time, etc. to InfluxDB.
Why monitor AWS?
Let’s suppose that you run your applications on Amazon Web Services, and you want to have a record of whether the specific AWS services you use are running or not. Sure, you can check the AWS Service Health Dashboard. And while plenty of good people work at AWS, that’s a bit like the fox guarding the henhouse:

For this reason, it’s good to do your own independent monitoring of AWS services and for that matter, any cloud services or SaaS apps you depend on. So, here are some quick tips on how to get that going with InfluxDB Cloud and Telegraf http_response.
Telegraf configuration for synthetic monitoring
First, get Telegraf running on your machine and an InfluxDB Cloud instance. Here’s a step-by-step tutorial of how to do that. Next, review this overview of synthetic monitoring with Telegraf and InfluxDB.
After doing so, copy this Telegraf configuration file to your local machine, and run it using this command:
telegraf config ./telegraf-synthetic-aws.conf debug
Assuming all starts well, you’ll see terminal output similar to this:
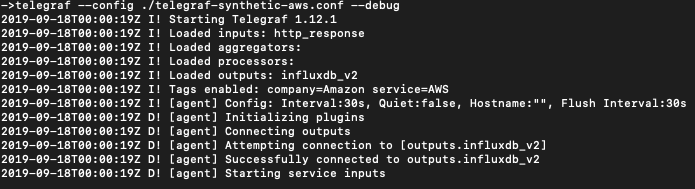
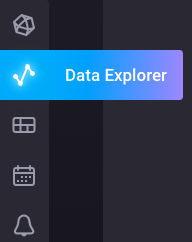
From here, you log into your InfluxDB Cloud Data Explorer (second icon from the top) and start graphing your data.
Let’s explore some key parts of telegraf-synthetic-aws.conf. First, we tag our time series to make it easier to query in the Data Explorer. We state that these metrics from a company called Amazon, and a service called AWS. This might be helpful if we’re tracking metrics from, say, Google Cloud or Azure.
# Global tags can be specified here in key="value" format.
[global_tags]
company = "Amazon"
service = "AWS" # will tag all metrics with service=AWS
Since there are potentially lots of endpoints we could monitor, I like to conserve my data usage. For this reason, I keep the hostname out of my data streams, since I don’t query on that information.
## If set to true, do no set the "host" tag in the telegraf agent.omit_hostname = trueWe need to specify that we’re using InfluxDB Cloud version 2, as opposed to the version 1 cloud or a local instance:
# Configuration for sending metrics to InfluxDB
[[outputs.influxdb_v2]]
We state where we can find our InfluxDB Cloud instance (here’s a current list of InfluxDB Cloud Regions):
## The URLs of the InfluxDB cluster nodes.
urls = ["https://us-west-2-1.aws.cloud2.influxdata.com"]
We list our secret token to authenticate Telegraf to post data to our instance of InfluxDB.
## Token for authentication.
token = "$INFLUX_TOKEN"
$INFLUX_TOKEN means that this is coming from an environment variable of the same name. If you haven't already set this, you can do so via this terminal command:
export INFLUX_TOKEN=[your unique API token]Here’s how to find your InfluxDB Cloud token if you don’t already have it.
Anyways, back to telegraf-synthetic-aws.conf. The next few lines describe the organization and the bucket you’re writing to.
## Organization is the name of the organization you wish to write to; must exist.
organization = "[email protected]"
## Destination bucket to write into.
bucket = "my-bucket"
Your organization name is at the top of every screen in InfluxDB Cloud:
![]()
And you can find your list of buckets (bucket list?) under the Load Data command:
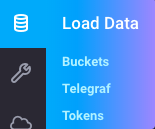
Alright, now we get to the meat of the matter: the Telegraf plugin we are using, and the URLs we want to monitor:
# HTTP/HTTPS request given an address a method and a timeout
[[inputs.http_response]]
## Server address (default http://localhost)
## List of urls to query.
urls = [
"http://aws.amazon.com"
]
The line [[inputs.http_response]] tells Telegraf to run our http_reponse plugin. Each URL needs to be surrounded by quotes and separated by commas.
In the example above, we’re monitoring just the main AWS URL http://aws.amazon.com. But if we wanted to monitor more, we could easily do so. For example, here’s how to monitor some EC2 endpoints:
# HTTP/HTTPS request given an address a method and a timeout
[[inputs.http_response]]
## Server address (default http://localhost)
## List of urls to query. urls = [ "https://ec2.ca-central-1.amazonaws.com",
"https://ec2.eu-central-1.amazonaws.com",
"https://ec2.eu-west-1.amazonaws.com",
"https://ec2.sa-east-1.amazonaws.com",
"https://ec2.us-east-1.amazonaws.com",
"https://ec2.us-gov-east-1.amazonaws.com",
"https://ec2.us-west-1.amazonaws.com",
]
And here’s how to monitor some S3 endpoints:
# HTTP/HTTPS request given an address a method and a timeout [[inputs.http_response]]
## Server address (default http://localhost)
## List of urls to query.
urls = [
"https://s3.amazonaws.com",
"https://s3.ca-central-1.amazonaws.com",
"https://s3.eu-central-1.amazonaws.com",
"https://s3.sa-east-1.amazonaws.com",
"https://s3.us-east-1.amazonaws.com",
"https://s3.us-west-1.amazonaws.com",
]
You probably get the picture by now. Here’s a list of all AWS endpoints. Pick out the ones that you care about and plug them into the section above.
The default http_response configuration file doesn’t follow redirects. I prefer to follow redirects to ensure that they don’t lead to a 5xx error, meaning that a service is down. Here’s how to do that:
## Whether to follow redirects from the server (defaults to false)
follow_redirects = true
Putting all the above together, here’s the entire configuration file:
# Telegraf Configuration
#
# Telegraf is entirely plugin driven. All metrics are gathered from the
# declared inputs, and sent to the declared outputs.
#
# Plugins must be declared in here to be active.
# To deactivate a plugin, comment out the name and any variables.
#
# Use 'telegraf -config telegraf.conf -test' to see what metrics a config
# file would generate.
#
# Environment variables can be used anywhere in this config file, simply prepend
# them with $. For strings the variable must be within quotes (ie, "$STR_VAR"),
# for numbers and booleans they should be plain (ie, $INT_VAR, $BOOL_VAR)


# Global tags can be specified here in key="value" format.
[global_tags]
  company = "Amazon"
  service = "AWS" # will tag all metrics with service=AWS
  ## Environment variables can be used as tags, and throughout the config file
  # user = "$USER"

# Configuration for telegraf agent
[agent]
  ## Default data collection interval for all inputs
  interval = "30s"
  ## Rounds collection interval to 'interval'
  ## ie, if interval="10s" then always collect on :00, :10, :20, etc.
  round_interval = true

  ## Telegraf will send metrics to outputs in batches of at most
  ## metric_batch_size metrics.
  ## This controls the size of writes that Telegraf sends to output plugins.
  metric_batch_size = 1000

  ## For failed writes, telegraf will cache metric_buffer_limit metrics for each
  ## output, and will flush this buffer on a successful write. Oldest metrics
  ## are dropped first when this buffer fills.
  ## This buffer only fills when writes fail to output plugin(s).
  metric_buffer_limit = 10000

  ## Collection jitter is used to jitter the collection by a random amount.
  ## Each plugin will sleep for a random time within jitter before collecting.
  ## This can be used to avoid many plugins querying things like sysfs at the
  ## same time, which can have a measurable effect on the system.
  collection_jitter = "0s"

  ## Default flushing interval for all outputs. Maximum flush_interval will be
  ## flush_interval + flush_jitter
  flush_interval = "30s"
  ## Jitter the flush interval by a random amount. This is primarily to avoid
  ## large write spikes for users running a large number of telegraf instances.
  ## ie, a jitter of 5s and interval 10s means flushes will happen every 10-15s
  flush_jitter = "0s"

  ## By default or when set to "0s", precision will be set to the same
  ## timestamp order as the collection interval, with the maximum being 1s.
  ##   ie, when interval = "10s", precision will be "1s"
  ##       when interval = "250ms", precision will be "1ms"
  ## Precision will NOT be used for service inputs. It is up to each individual
  ## service input to set the timestamp at the appropriate precision.
  ## Valid time units are "ns", "us" (or "µs"), "ms", "s".
  precision = ""

  ## Logging configuration:
  ## Run telegraf with debug log messages.
  debug = false
  ## Run telegraf in quiet mode (error log messages only).
  quiet = false
  ## Specify the log file name. The empty string means to log to stderr.
  logfile = ""

  ## Override default hostname, if empty use os.Hostname()
  hostname = ""
  ## If set to true, do no set the "host" tag in the telegraf agent.
  omit_hostname = true
  # Changed to true since we don't care about the hostname (localhost) and we want to make our payloads smaller.


###############################################################################
#                            OUTPUT PLUGINS                                   #
###############################################################################

# Configuration for sending metrics to InfluxDB
[[outputs.influxdb_v2]]
  ## The URLs of the InfluxDB cluster nodes.
  ##
  ## Multiple URLs can be specified for a single cluster, only ONE of the
  ## urls will be written to each interval.
  ## urls exp: http://127.0.0.1:9999
  urls = ["https://us-west-2-1.aws.cloud2.influxdata.com"]

  ## Token for authentication.
  token = "$INFLUX_TOKEN"

  ## Organization is the name of the organization you wish to write to; must exist.
  organization = "[email protected]"

  ## Destination bucket to write into.
  bucket = "my-bucket"


###############################################################################
#                            PROCESSOR PLUGINS                                #
###############################################################################


###############################################################################
#                            AGGREGATOR PLUGINS                               #
###############################################################################


###############################################################################
#                            INPUT PLUGINS                                    #
###############################################################################

# HTTP/HTTPS request given an address a method and a timeout
[[inputs.http_response]]
  ## Server address (default http://localhost)
  ## List of urls to query.
  urls = [
      "http://aws.amazon.com"
    ]

  ## Set http_proxy (telegraf uses the system wide proxy settings if it's is not set)
  # http_proxy = "http://localhost:8888"

  ## Set response_timeout (default 5 seconds)
  # response_timeout = "5s"

  ## HTTP Request Method
  # method = "GET"

  ## Whether to follow redirects from the server (defaults to false)
  follow_redirects = true
  # Changed this to see if a URL leads to a successful HTTP request.

  ## Optional HTTP Request Body
  # body = '''
  # {'fake':'data'}
  # '''

  ## Optional substring or regex match in body of the response
  # response_string_match = ""

  ## Optional TLS Config
  # tls_ca = "/etc/telegraf/ca.pem"
  # tls_cert = "/etc/telegraf/cert.pem"
  # tls_key = "/etc/telegraf/key.pem"
  ## Use TLS but skip chain & host verification
  # insecure_skip_verify = false

  ## HTTP Request Headers (all values must be strings)
  # [inputs.http_response.headers]
  #   Host = "github.com"
By this point, you should have everything you need to monitor AWS and other cloud services and SaaS apps that are available via the web.
Addendum: List of AWS endpoints
In writing this post, it was pretty amazing how many Amazon Web Services there now are. Even more staggering: AWS is delivered through over 2000 http endpoints for its various APIs.
Now, if you’re only using a few AWS endpoints, you can skip this section. But, if you want to monitor AWS endpoints en-masse, read on.
(Caveat: monitoring dozens or more URLs may put you out of the InfluxDB Cloud free tier and require you to be on their paid plan.)
Here’s a list of AWS service endpoints in plain text format I compiled from this AWS documentation page.
Since this list will change over time, here’s how to compile a list of AWS endpoints using Terminal:
curl https://docs.aws.amazon.com/general/latest/gr/rande.html | grep amazonaws | sort -u > aws-endpoints.txtLet’s break down what’s happening here:
curlcaptures a web pagehttps://docs.aws.amazon.com/general/latest/gr/rande.htmlis the webpage of all of AWS endpoints.- Using a Unix pipe, we send that webpage to the
grepcommand, which in turn pulls out all lines withamazonaws. Thankfully, AWS has a convention, as far as I can tell, of always usingamazonawsin the URLs of its service endpoints. This makes things easier. sortsorts all lines of text alphabetically, and the-uflag shows only the unique lines so we don't have repeats.- We then send the output of
sortto a new file, calledaws-endpoints.txt.
From here, you can use the text editor of your choice to any extra cruft on each line.
