Monitoring InfluxDB 2.0 in Production and at Scale
By
Russ Savage
updated December 14, 2025
Product
Use Cases
Developer
Navigate to:
One of the great things about InfluxDB is that it is really easy to get up and running, and it doesn’t require much monitoring when you are dealing with datasets that fit well on your local dev machine.
Once you start using InfluxDB in production and pushing orders of magnitude more data into the system, it’s critical to monitor how your instance is performing so that you can proactively respond to things like disk or network failures, memory saturation, and write or query loads. Without this monitoring in place, you will be flying blind. That’s why I created the OSS InfluxDB 2.0 Monitoring Template because I wanted an easy way to monitor my open source instance.
Free and scalable monitoring template
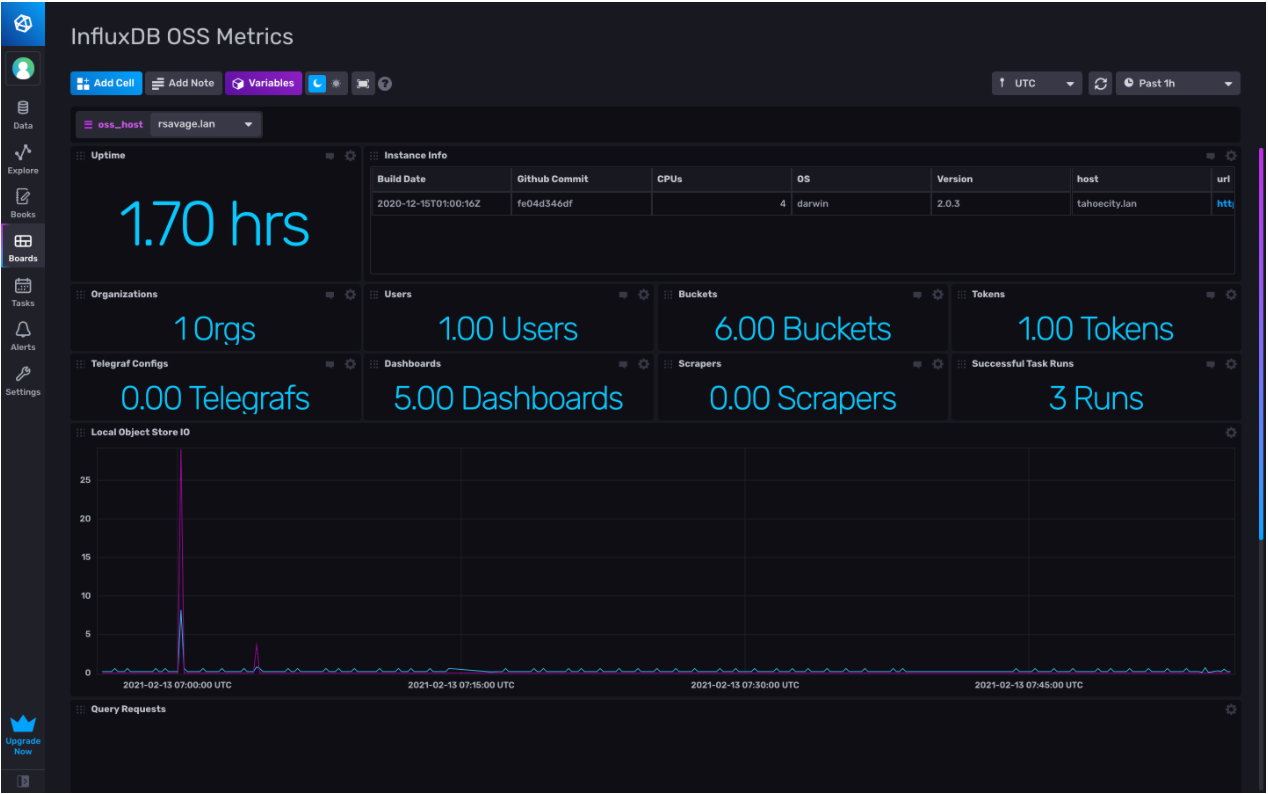
The OSS InfluxDB 2.0 Monitoring Template can be used to monitor a single instance or whole fleet of InfluxDB OSS instances. It comes with 1 metrics dashboard included, as shown below.
It can be installed by signing up for a free InfluxDB Cloud account. Registering for an account is free and doesn’t require a credit card, so you can do it without even finding your wallet besides, these days, I always leave it in my other pair of sweatpants!
This template, like other InfluxDB Templates, lets you quickly define your entire monitoring configuration (data sources, dashboards, and alerts) in one easily-shared, open source text file that can be imported into InfluxDB with a single command.
Instant-on InfluxDB 2.0 monitoring
Developers, as I often hear from the community, love that they’re able to install the template and see metrics about their OSS instance instantly. It gives them a great starting point to further customize the monitoring of their OSS instance for their own needs. Many developers take this template and add additional graphs as well as alerting to complete the monitoring capability for their environment.
Though alerting isn’t part of this template, it’s very easy to set up. The included dashboard offers an idea of what metrics might be interesting, and once you get a feel for the shape of those metrics, it’s really easy to add threshold or deadman alerting in the InfluxDB UI. You can configure the UI to send alerts directly to your team’s Slack channel as well.
InfluxDB metrics you can track
The metrics tracked in this template include information about the resources in your OSS instance, as well as metrics about how much storage is being used and the number of queries issued. These are the first level of investigation when there is a degradation in performance for your open source instance. For more information on metrics tracked, visit the template’s GitHub page.
Using multiple InfluxDB Templates
There are a few other InfluxDB Templates that work well with this template, including the Operational Monitoring Template. I would also recommend the Linux System Monitoring Template to keep track of important system stats.
There are also scenarios where you might want to use the OSS InfluxDB 2.0 Monitoring Template with the OSS InfluxDB 1.X Monitoring Template. Likely, you have a heterogeneous environment full of different versions of many types of software. Since not all teams will update their InfluxDB instances to the latest 2.0 release right away, you can still use your InfluxDB Cloud account to monitor all versions of InfluxDB, which is where this template becomes useful. The metrics being collected for each database edition are slightly different that’s why InfluxDB 2.0 has its own template.
Interested in submitting your own InfluxDB Template? Learn how to use and how to build one.
