Table of Contents
This article was written by Aniket Bhattacharyea and originally published in The New Stack. Scroll down for author bio and photo.
Time series databases like InfluxDB are databases that specialize in handling time series data, which is data that is indexed by time. Unlike traditional databases, time series databases are optimized for reading and writing data with less performance consideration for updating or deleting data.
Due to the time-dependent nature of time series data, time series databases are handy for application monitoring. If you have a Ruby on Rails application, it’s vital to monitor the application’s performance to make sure it’s running smoothly.
With a time series database, you can store metrics from your application like the number of requests processed, the amount of memory consumed and the time taken to generate a response. In this article, you’ll learn how to use InfluxDB to monitor a Ruby on Rails application.
If you want to clone the project and follow along in your own editor, here is the link to the GitHub repo.
Prerequisites
To follow along with this tutorial, you’ll need the following:
- Docker installed and set up on your computer. You will need Docker to run the InfluxDB server. Alternatively, you can use InfluxDB Cloud to get a free running instance of InfluxDB if you don’t want to install anything on your computer.
- The latest version of Ruby on Rails installed on your computer. You can run rails -v to check if Rails is installed correctly.
Setting up InfluxDB
In this article, you’ll run a local InfluxDB instance using Docker. To begin, use the following command to start the InfluxDB container:
docker run --name influxdb -d -p 8086:8086 influxdb:2.1.1
Visit http://localhost:8086 in your browser to access the InfluxDB welcome screen. You’ll need to provide a username and password and create a new organization and bucket.

Click on “Configure later” to access the dashboard.
In the left sidebar, you’ll see a menu item called “Data.” Click on it and select the “API Tokens” tab. There, you’ll find a default token created by InfluxDB. Save this token somewhere safe so you can access it again later in this tutorial.

Setting up the Rails App
Next you need to create a new Rails app with the rails new command:
rails new influxdb-demo
Then move into the influxdb-demo directory:
cd influxdb-demo
Note that this app uses an SQLite database since this is just for demonstration purposes, but you can use PostgreSQL or MySQL as well.
Next, you need to create the database with the rails db:create command:
rails db:create
Since you’ll be instrumenting database interactions in the app, you need to have something that interacts with the database. You can use the scaffold feature of Rails to quickly generate a full-featured CRUD API without writing a single line of code:
rails g scaffold post title:text body:text
This will generate a Post model with title and body attributes as well as the necessary CRUD endpoints.
Migrate the database by running rails db:migrate.
InfluxDB has an influxdb-rails gem that can automatically instrument a Rails application, but it doesn’t support InfluxDB 2.0 at the time of writing this article, so you’ll be using the influxdb-client gem instead. Open the Gemfile and add the following line:
gem "influxdb-client", "~> 2.3.0"
Then install the gem by running bundle install.
Setting up instrumentation
You might be wondering, “How exactly do I collect metrics from a Rails app?” Thankfully, like everything else in Rails, instrumentation comes built in as well. The Active Support Instrumentation API provides you with myriad Action Controller, Active Storage, Action Mailer, Active Record, Action View and other events that you can subscribe to. It also gives you the ability to instrument your custom events.
To subscribe to an event, you need to use ActiveSupport::Notifications.subscribe with a block that is called when the event is triggered. The block receives the event’s name, the start and finish time, a unique ID for the instrumenter that fired the event and a payload that contains different information depending on the event. For example, the following code subscribes to the process_action.action_controller event that will be triggered whenever the Rails app processes a request:
ActiveSupport::Notifications.subscribe "process_action.action_controller" do |name, started, finished, unique_id, data|
  Rails.logger.info "#{name} Received! (started: #{started}, finished: #{finished})"
end
In this article, you’ll subscribe to the following events, but you can add as many as you want:
process_action.action_controller: triggered when a request is processedrender_template.action_view: triggered when a template is renderedsql.active_record: triggered when an SQL query is performedinstantiation.active_record: triggered when one or more Active Record objects are instantiated
Create a new config/initializers/influxdb.rb file where you’ll eventually add the logic.
Now, you need to instantiate an InfluxDB client by implementing the following code:
client = InfluxDB2::Client.new(
    'http://localhost:8086',
    'YOUR_TOKEN',
    bucket: 'YOUR_BUCKET',
    org: 'YOUR_ORGANIZATION',
    precision: InfluxDB2::WritePrecision::NANOSECOND,
    use_ssl: false
)
write_api = client.create_write_api
Replace YOUR_TOKEN with the token you got from InfluxDB, YOUR_BUCKET with the bucket name, and YOUR_ORGANIZATION with the organization name. If you are using a cloud account, you will also want to replace the localhost URL with your cloud region URL.
Now, we need to subscribe to the first event. The following code sets up the subscription:
ActiveSupport::Notifications.subscribe "process_action.action_controller" do |name, started, finished, unique_id, data|
    # Send data to influxdb
end
Inside the block, you’ll need to set up the data point to send to InfluxDB. There are four data formats that you can use. Here, you’ll use a hash:
ActiveSupport::Notifications.subscribe "process_action.action_controller" do |name, started, finished, unique_id, data|
    hash = {
        name: "process_action.action_controller",
        tags: {
            method: "#{data[:controller]}##{data[:action]}",
            format: data[:format],
            http_method: data[:method],
            status: data[:status],
            exception: data[:exception]&.first
         },
         fields: {
            time_in_controller: (finished - started) * 1000,
            time_in_view: (data[:view_runtime] || 0).ceil,
            time_in_db: (data[:db_runtime] || 0).ceil,
        },
        time: started
    }

    write_api.write(data: hash)
end
In the code above, the name key denotes the name of the measurement, which is set to the name of the event. The tags key sets up the tags.
In the code, five tags are used:
- The Ruby method that was called. This will be a method of the controller class that handles the request.
- The format (html/json/xml) of the request.
- The HTTP method (GET, POST, PUT, etc.) of the request.
- The HTTP status code of the response.
- The exception that occurred, if any.
The fields key holds the fields for the measurement, and the following three fields are used:
- The total time spent processing the request (in milliseconds).
- The total time spent rendering the view (in milliseconds).
- The total time spent querying the database (in milliseconds).
Finally, the time key is used to set up the timestamp of the data. The value of this key is the time when the event was triggered.
Once the data point is set up, write_api.write is used to write the data in InfluxDB.
The second subscription is for the render_template.action_view event:
ActiveSupport::Notifications.subscribe "render_template.action_view" do |name, started, finished, unique_id, data|
    hash = {
        name: "render_template.action_view",
        tags: {
            identifier: data[:identifier],
            layout: data[:layout],
            exception: data[:exception]&.first
         },
         fields: {
            duration: (finished - started) * 1000
        },
        time: started
    }

    write_api.write(data: hash)
end
The only difference is in the tags and fields keys this time. The identifier tag tells which template was rendered, and the layout tag tells which layout was applied. The duration field denotes how long it took (in milliseconds) to render the template.
The third subscription is for the sql.active_record event:
ActiveSupport::Notifications.subscribe "sql.active_record" do |name, started, finished, unique_id, data|
    hash = {
        name: "sql.active_record",
        tags: {
            name: data[:name],
            statement_name: data[:statement_name],
            exception: data[:exception]&.first
         },
         fields: {
            duration: (finished - started) * 1000
        },
        time: started
    }

    write_api.write(data: hash)
end
Here, the name tag holds the name of the operation, and the statement_name tag holds the name of the SQL statement. The duration field calculates how long the query took to execute (in milliseconds).
The final subscription is for the instantiation.active_record field:
ActiveSupport::Notifications.subscribe "instantiation.active_record" do |name, started, finished, unique_id, data|
    hash = {
        name: "instantiation.active_record",
        tags: {
            class_name: data[:class_name],
            exception: data[:exception]&.first
         },
         fields: {
            duration: (finished - started) * 1000,
            record_count: data[:record_count]
        },
        time: started
    }

    write_api.write(data: hash)
end
The class_name tag denotes the class name of the Active Record object that was instantiated. The duration field denotes how long it took to instantiate the object (in milliseconds), and the record_count field denotes how many records were instantiated.
That’s it for the setup! Now you can start using the app to generate metrics.
Generate metrics
Once instrumentation is set up, it’s time to generate some metrics using the app. Start the Rails server by running rails s and visit http://localhost:3000/posts. You’ll be greeted with the posts index page:

Click on New post to create a new post.
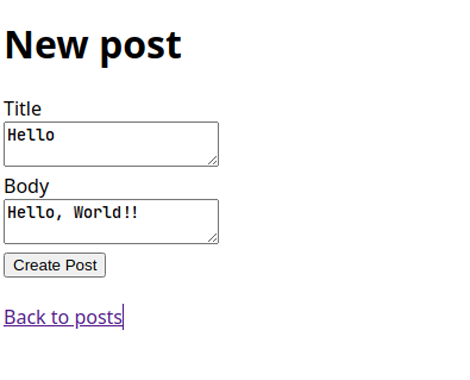
Enter a title and body, and click on “Create Post.”
Click on Back to posts to go back to the posts list.

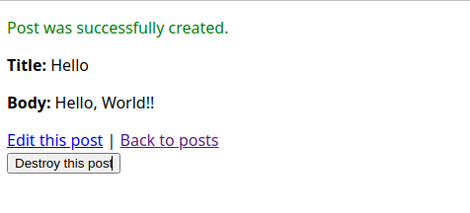
Click on Show this post under any post to see the post on a separate page.
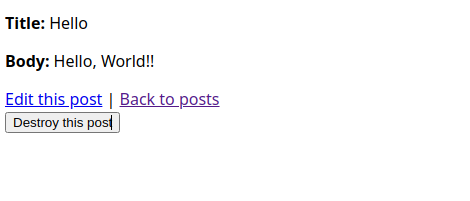
lick on Edit this post to edit it or Destroy this post to delete it.
Now you can create, edit and delete as many posts as you like. Once you’re happy, go back to the InfluxDB dashboard to visualize the data.
Visualizing the data
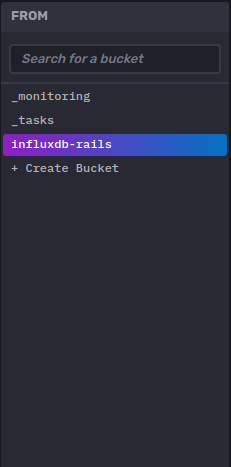
In the InfluxDB dashboard, click on the “Explore” tab. Here, you’ll see an interactive query builder that will let you visualize the data of your choice. Let’s begin by visualizing how much time was spent creating a post.
First, select your bucket in the “From” tab:
The subsequent tabs will let you select how you want to filter the data.
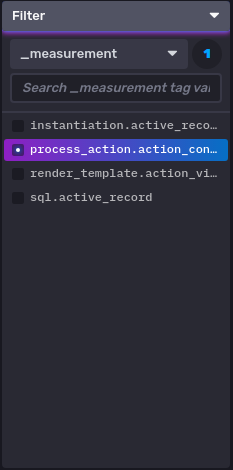
Make sure _measurement is selected in the next tab and select process_action.action_controller from the list:
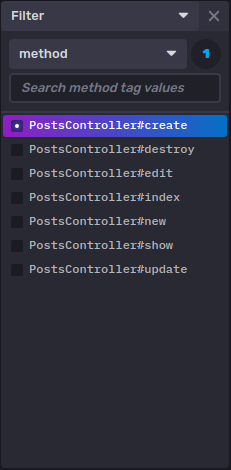
Select method as the key in the following filter panel and select PostController#create as the tag:
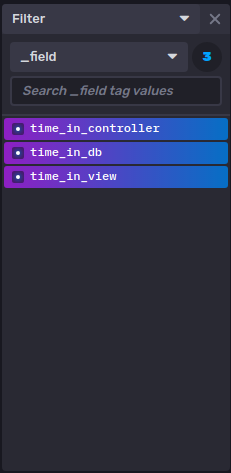
Finally, select the three fields in the _field filter:
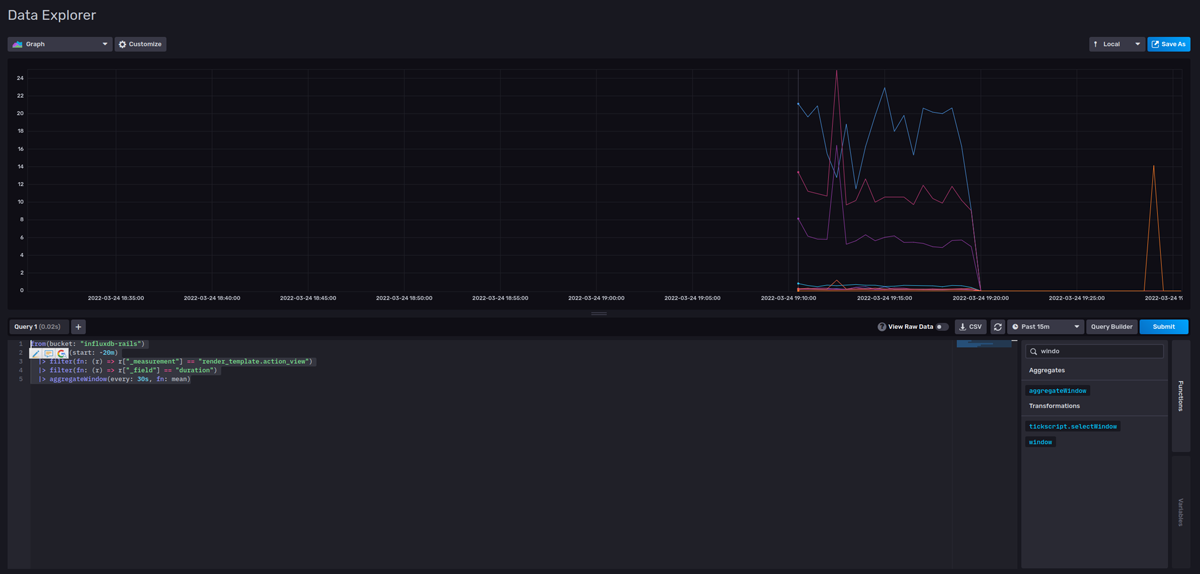
Choose a proper time frame (i.e., “Past 15m”) from the dropdown on the right-hand side and click on “Submit.” You’ll see a shiny new graph with the data:

Now, let’s visualize the time spent in rendering the view. This time, you’ll use Flux to query the data.
Click on “Script Editor,” which will open an editor window where you can write Flux queries. Then paste the following query:
from(bucket: "influxdb-rails")
  |> range(start: -20m)
  |> filter(fn: (r) => r["_measurement"] == "render_template.action_view")
  |> filter(fn: (r) => r["_field"] == "duration")
  |> aggregateWindow(every: 30s, fn: mean)
Click on “Submit,” and you’ll see the data as a graph.
Go ahead and play around with all the different metrics you collected.
Conclusion
InfluxDB makes it easy to collect and visualize instrumentation data from your Ruby on Rails application. Using the ActiveSupport instrumentation API, you can collect different metrics from the application and store them in InfluxDB.
This article showed you only a handful of the metrics you can collect. You can find a complete list of metrics here. If none of the built-in metrics suits your needs, you can also create your own. The sky’s the limit!
About the author
Aniket is a student doing a Master’s in mathematics and has a passion for computers and software. He likes to explore various areas related to coding and works as a web developer using Ruby on Rails and Vue.JS.

