MySQL Metrics that Matter
By
Katy Farmer
updated December 14, 2025
Use Cases
Developer
Navigate to:
Maybe you remember Bloggernot the actual business website that looks functional and designedbut my hobby project, the perfect combination of malfunctions and inefficiency that requires monitoring at all times. Blogger can’t be trusted. See my first post on it here.
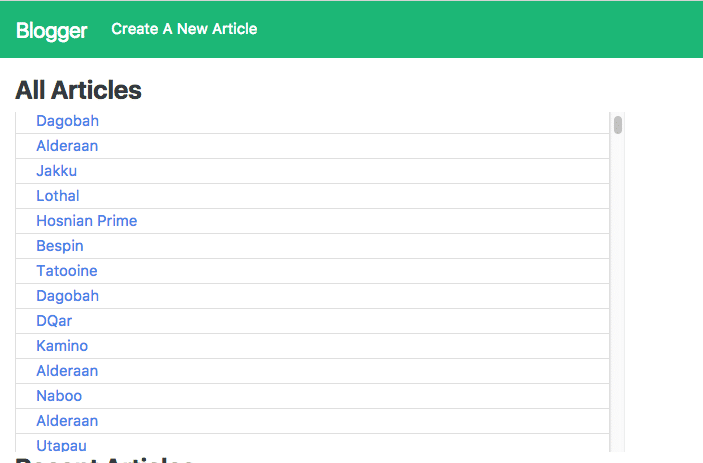 <figcaption> I also made it uglier by attempting to make it beautiful. Vanity, thy name is Blogger.</figcaption>
We started our journey into metrics on the surface, looking at the number of requests to Blogger. But Blogger isn’t likely to die of a traffic overload any time soon, so let’s not worry about how many requests it’s getting. Let’s worry about how well it’s performing.
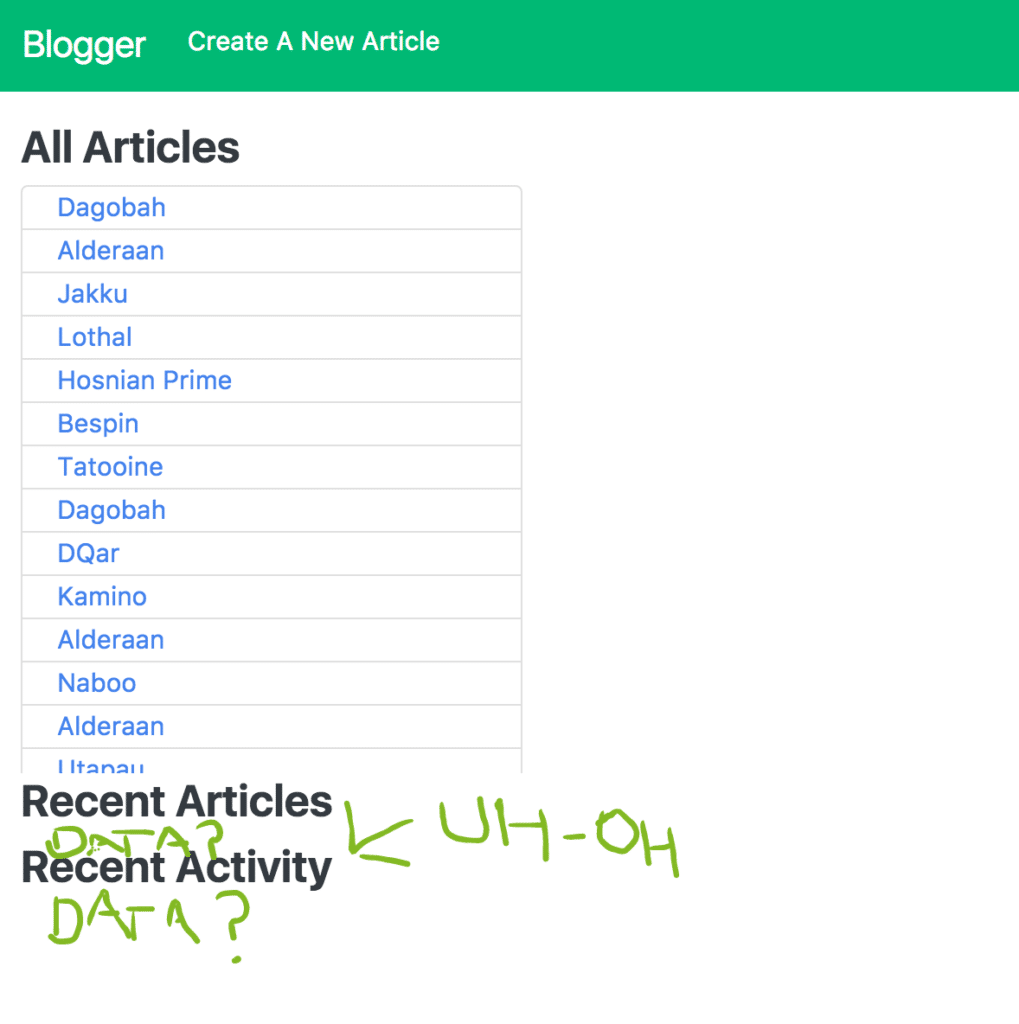
Adding more content to the homepage has slowed Blogger down. Recent Articles and Recent Activity do load…eventually. If I weren’t emotionally invested in Blogger, I wouldn’t wait. Most users won’t. Imagine if it took 30 seconds for your Google search results to show up. You’d be eyeing Bing. Because both Recent Articles and Recent Activity are supposed to retrieve data from the database, it’s time to monitor MySQL, Blogger’s DB.
 <figcaption> Imagine this upside down for data retrieval</figcaption>
To begin, we need to establish which metrics are worth monitoring. A quick search of the internet (quick = only 3 dog video breaks) shows just how many metrics MySQL outputs. It’s a lot. If I wanted to, I could probably find its mother’s maiden name and its first childhood pet.
But evaluating performance doesn’t require all of that. There are four areas that will shed light into MySQL: you won’t believe the fourth one. Just kiddingthey all totally make sense.
Throughput
Above all, the database’s job is to run queries. It wants to run queriesso much so that it will run as many as you ask, regardless of burden, which can be problematic at some point. MySQL has some handy status variables so we can check in on it: Queries (server-side) and Questions (client-side).
 <figcaption> Foreword by Dr. Neil deGrasse Tyson</figcaption>
msql>SHOW GLOBAL STATUS LIKE "Questions";

+---------------+--------+

| Variable_name | Value  |

+---------------+--------+

| Questions     | 282590 |

+---------------+--------+

1 row in set (0.00 sec)
msql> SHOW GLOBAL STATUS LIKE "Queries";

+---------------+--------+

| Variable_name | Value  |

+---------------+--------+

| Queries       | 294564 |

+---------------+--------+

1 row in set (0.00 sec)
Honestly, these numbers mean nothing to me, but I was able to establish that they are cumulative beginning at the creation of the database. A breakdown of reads and writes would be more helpful. Guess who has variables for that?
 <figcaption> It’s MySQL. MySQL has variables for that.</figcaption>
Com-select shows reads and a combination of Com-insert, Com_update, and Com-delete will show writes (these are also cumulative numbers).
mysql> show global status like "Com_select";

+---------------+-------+

| Variable_name | Value |

+---------------+-------+

| Com_select    | 28854 |

+---------------+-------+

1 row in set (0.01 sec)
mysql> show global status like "Com_insert";

+---------------+-------+

| Variable_name | Value |

+---------------+-------+

| Com_insert    | 69317 |

+---------------+-------+

1 row in set (0.00 sec)
Execution Time
If the volume of queries looks normal, but the bottleneck is still there, execution time is the next step. Sure, Blogger can handle all 294564 queries, but not if one of them takes five minutes to complete. MySQL has a quick check you can do with the variable Slow_queries.
mysql> show global status like "Slow_queries";

+---------------+-------+

| Variable_name | Value |

+---------------+-------+

| Slow_queries  | 0     |

+---------------+-------+

1 row in set (0.00 sec)
Huzzah!
Of course, this might not always be zero. Blogger has no slow queries either because I’m a super-programmer or because it’s not really doing anything complicated. Who’s to say?
Concurrency
The number of transactions in MySQL is equally as important as how many of those are happening at the same time. Let’s pretend Blogger (again, not the actual business Blogger, but my Frankenstein) has made it. It’s the Bitcoin of blogging (probably an actual business pitch out there somewhere).
 <figcaption> Crypto-blogs are the future</figcaption>
If Blogger got 20K queries/sec (because it’s crypto-popular in this scenario) coming in from its devoted users with 2 millisecond average latency (latency based on a query I’ll show in the following section), that would be 40 concurrent queries. But if MySQL hung up for even 100ms (let’s blame the OS in this scenario), that’s 4K queries all being affected. Whoa.
If you want to know more about how this works, read “Understanding MySQL internals”. Freakishly interesting.
Again, MySQL wants to help us out. Another variable, another day for MySQL. Threads_running will display the number of threads currently running, and if you want more info, you can also check “Threads_connected” and “threads_created”.
mysql> SHOW GLOBAL STATUS LIKE "Threads_running";

+-----------------+-------+

| Variable_name   | Value |

+-----------------+-------+

| Threads_running | 1     |

+-----------------+-------+

1 row in set (0.00 sec)
Utilization
This is a broad way of saying: monitor your resources. Specifically, though, utilization is the amount (or percent) of time a resource is busy. For the database, this means the percentage of time each connection was busy (oh, and if you want to see connections, there’s a variable for that: “Connections”), or the amount of time the database was reachable. Utilization is most helpful in investigating when you’ve identified that there is a problem, but not what that problem is.
 <figcaption> Something looks different in my data</figcaption>
Enter MySQL to help us figure this out. It has a lot of these metrics summarized and ready for queries in the performance_schema DB and the sys DB (the sys is more human readable, if you happen to be human). Using the sys DB, I can find my slowest queries.
mysql> SELECT * FROM sys.statements_with_runtimes_in_95th_percentile;
The output, while human readable, can be quite extensive. Run it on your machine and see what happens!
Here is the query I ran to find the average run-time of each schema in the concurrency example. blogger_test is checking in at 2123 microseconds, about 2 milliseconds on average for a query to run from arrival to completion.
mysql> SELECT schema_name
 , SUM(count_star) count
 , ROUND( (SUM(sum_timer_wait) / SUM(count_star))
           / 1000000) AS avg_microsec
 FROM  performance_schema.events_statements_summary_by_digest
 WHERE schema_name IS NOT NULL
 GROUP BY schema_name;

+---------------------+--------+--------------+
| schema_name | count | avg_microsec |
+---------------------+--------+--------------+
| blogger_development | 248834 | 149 |
| blogger_test        | 188    |2123 |
| information_schema  | 3      | 156 |
| performance_schema  | 17     | 578 |
| sys                 | 8      |5437 |
+---------------------+--------+--------------+
5 rows in set (0.00 sec)
Conclusion
There are some amazing metrics available in performance_schema, and you should spend time exploring before you have a MySQL emergency so you know where to look when the icy hand of SQL comes for you.
Now that we’ve established which metrics matter, I’m going to continue exploring MySQL. In my next post, I’ll discuss throughput, execution time, concurrency, and utilization specifically in Blogger.
