Grafana Unleashes Official InfluxDB V3 Data Source: A Quick-start Guide to Configuration and Usage
By
Jay Clifford
updated February 21, 2024
Developer
Navigate to:
Yes, the title says it all: Grafana released the official V3 plugin for InfluxDB Data Source!

Before delving into the tutorial, we’d like to thank Ismail Simsek, a Tech Lead at Grafana. Ismail was pivotal in adding the V3 SQL plugin to the InfluxDB data source and making significant backend code improvements.
To clarify, this release isn’t an entirely new data source. Rather, it integrates the community-developed Flight SQL plugin into the official InfluxDB data source, incorporating several highly requested features and performance improvements. This blog teaches you how to configure the new data source plugin with your InfluxDB V3 instance.

Where can I find the V3 data source?
The V3 Flight SQL plugin has been added to the official InfluxDB data source within Grafana. Below is a table of the Grafana edition and the version you need to install to use it:
| Edition | Version |
| Grafana OSS | 10.3.0+ |
| Grafana Enterpise | 10.3.0+ |
| Grafana Cloud | Latest |
Let’s jump into Grafana Cloud and locate the official InfluxDB V3 Datasource:
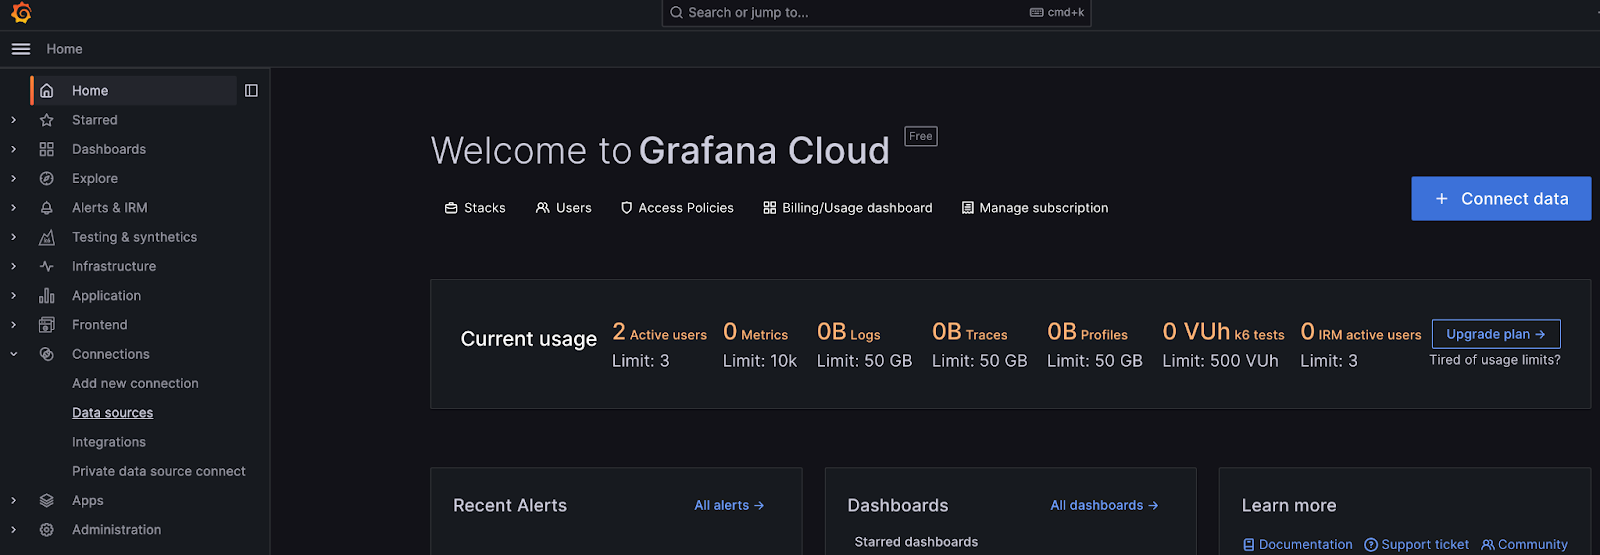
Here is our Grafana Cloud instance. On the left-hand navigation panel, we select Data Source. From there, we select Add data source and choose the official InfluxDB data source from the time series database list.
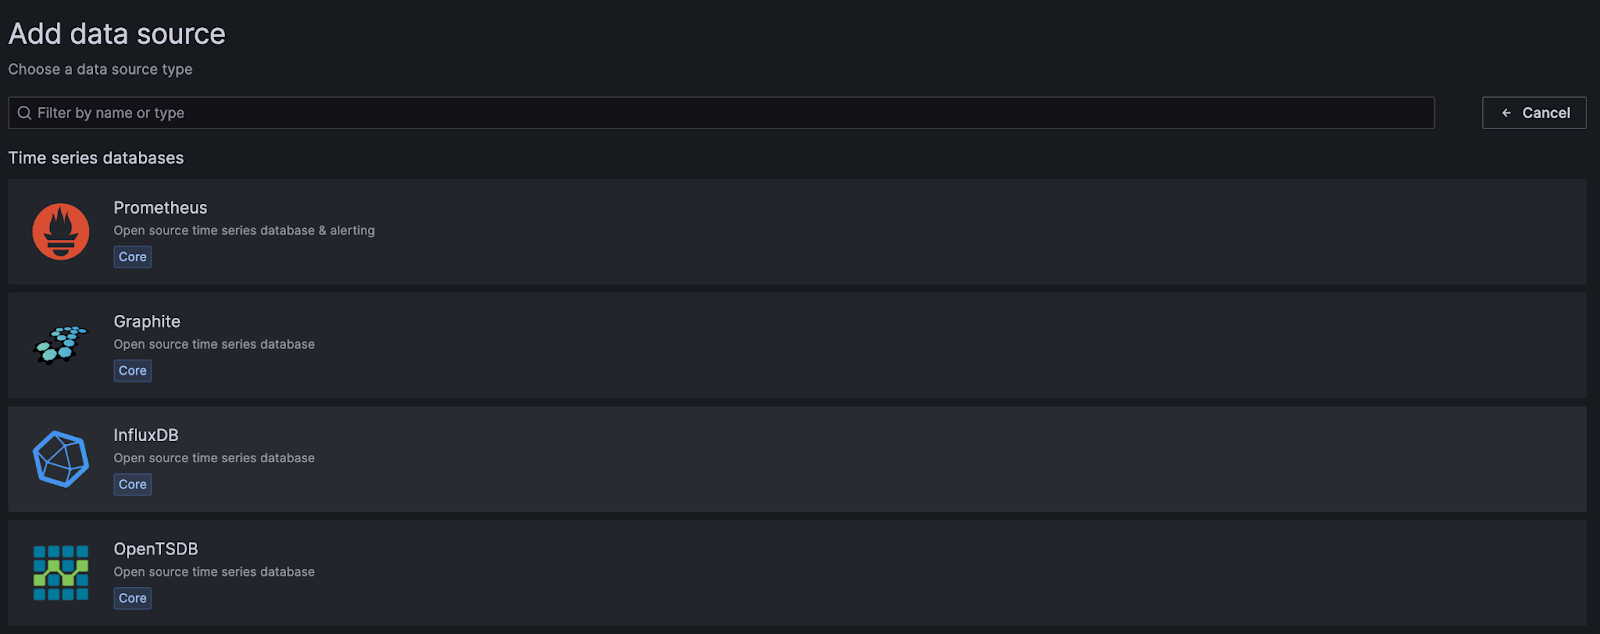
So no big changes there! We find and create our new InfluxDB data source in the same way we always have. Let’s move on to configuration and learn how to tap into the V3 SQL plugin.
How do I configure my V3 data source?
As usual, we need to give the data source a useful name. In this case, I aptly named the data source InfluxDB V3. Next, we need to select our Query language—this is also where we enable our V3 plugin.

Within the drop-down list, you will now see a third option, SQL. Selecting SQL as a new language automatically utilizes the newly integrated Flight SQL API within the Grafana backend. This also transforms the rest of the form parameters we need to fill out.

You will need to define the following:
| Parameter | Description |
| URL | The InfluxDB V3 host you wish to connect to. In this case, if you omit the port it will automatically default to the protocol's default port (http -> 80, https ->443). Here are some accepted examples: Note: Port definition is currently only important for clustered and eventually OSS / Community users. |
| Database | Define the database/bucket name you wish to query from. Note that this is a one-to-one ratio as part of the Grafana data source implementation. In this case, we are connecting to a database called factory. |
| Token | Lastly, you need to create a token with at least read-only privilege for the specific database you defined. |
After completing the form, select Save & test. This should result in a successful connection to the InfluxDB V3 data source.

A quick 101
Now that we connected Grafana to InfluxDB V3, let’s build a simple visualization and discuss some features along the way. For this demo, I used data generated from the Arrow Task Engine demo.
Data Explorer
Within the Explore panel, we select our InfluxDB V3 data source. This provides an SQL explorer for navigating our current database schema as well as building basic SQL queries.
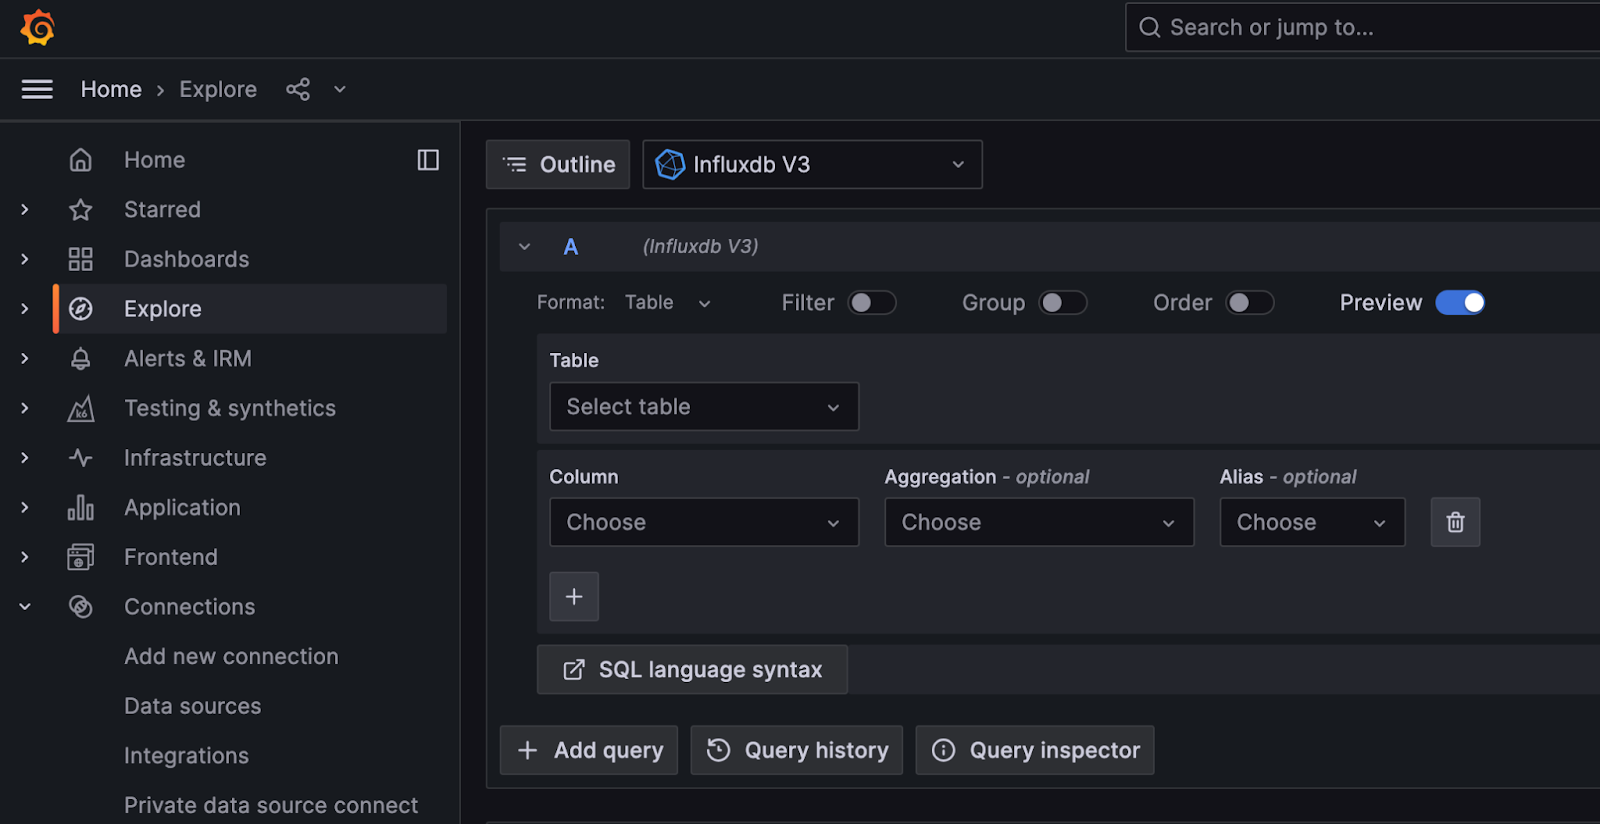
Let’s start by creating a table that shows all columns from the last hour.
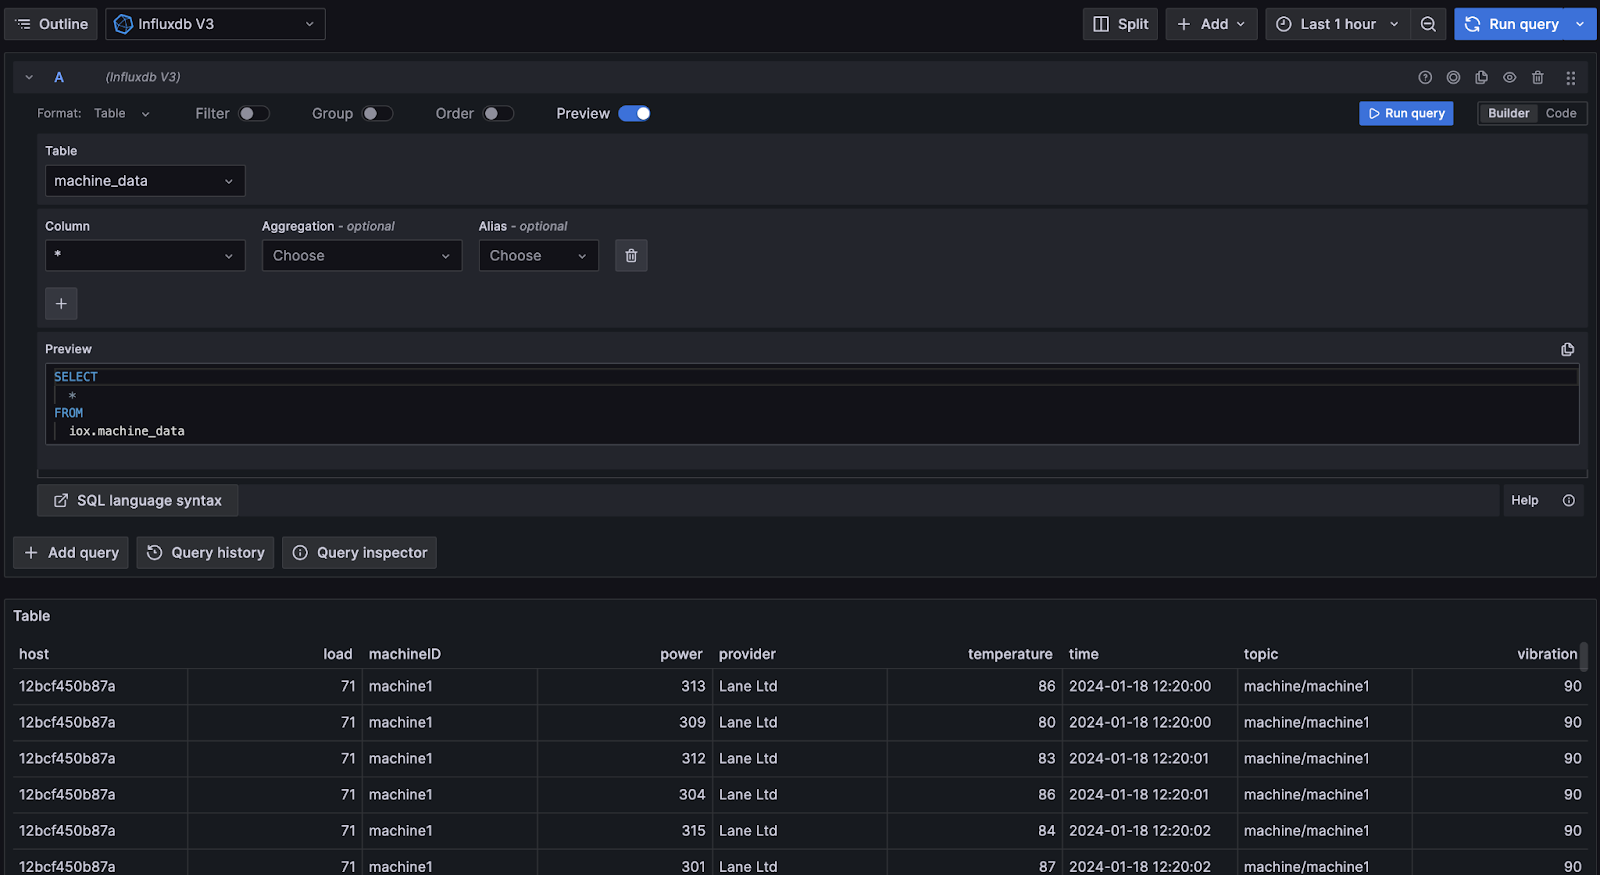
To generate this table, we simply select—via the drop-down panels—the table (measurement) and columns (tags and fields) we would like to view. We can also formulate more specific SQL queries as well:

After generating some SQL using the basic explorer, can I edit the SQL? The quick answer is yes; simply toggle from Builder to Code.
From Table to Time Series
Because InfluxDB 3.0 now returns tables rather than table streams, the V3 plugin defaults to the Grafana table format. Let’s build a query and transform it into the time series format for visualization as a line graph.
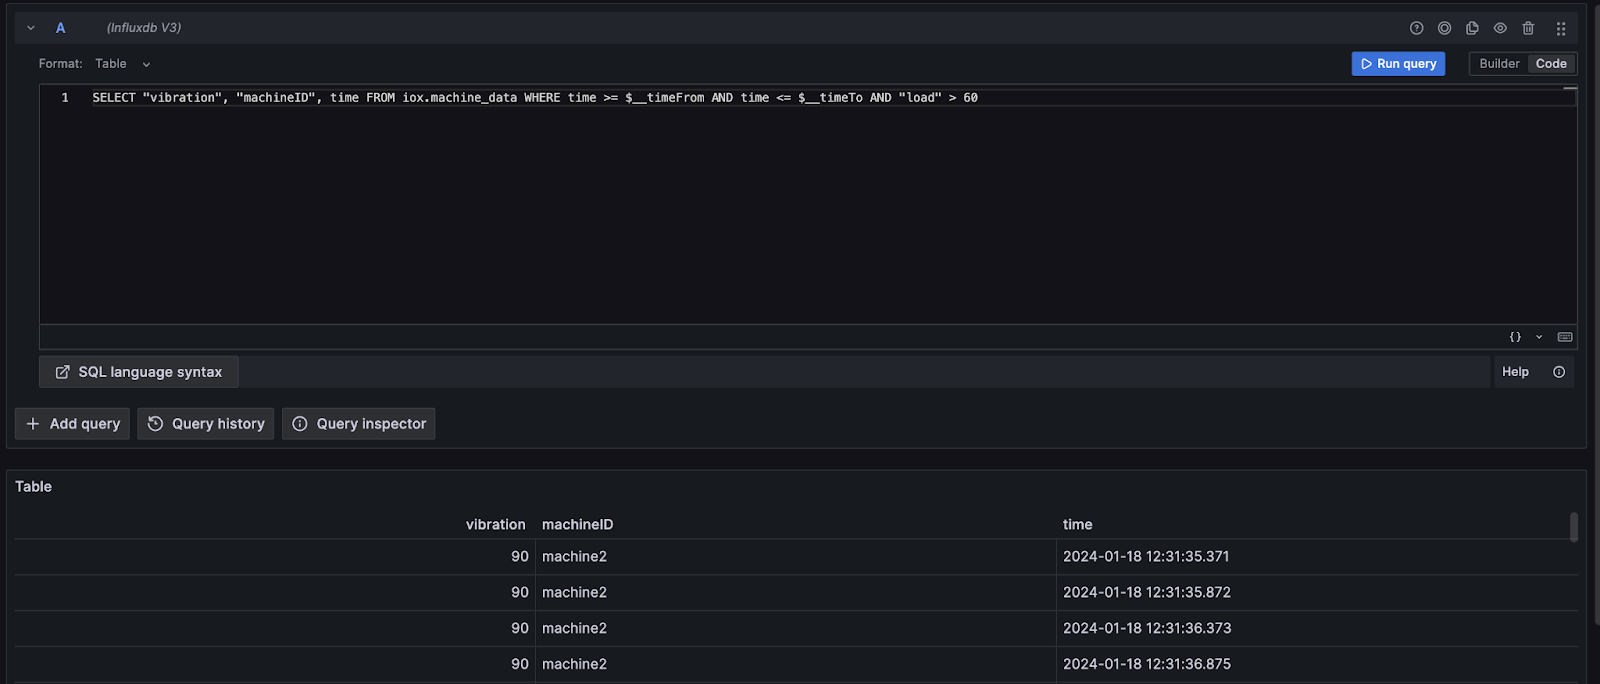
Here is our SQL:
SELECT "vibration", "machineID", time
FROM iox.machine_data
WHERE time >= $__timeFrom AND time <= $__timeTo AND "machineID" = 'machine1'
ORDER BY time
Note that we must add ORDER BY time to our query to ensure the order of our timestamps.

Now we can simply change the Format using the dropdown menu from table to Time series.

We will save this query to a dashboard to explore our final feature in this blog: query-based dashboard variables.
Dashboard Variables
One feature missing from the Flight SQL community plugin was query-based dashboard variables. These allow you to define a query to populate a Grafana dashboard dropdown. You can then use these variables within your other queries to create a more dynamic experience.
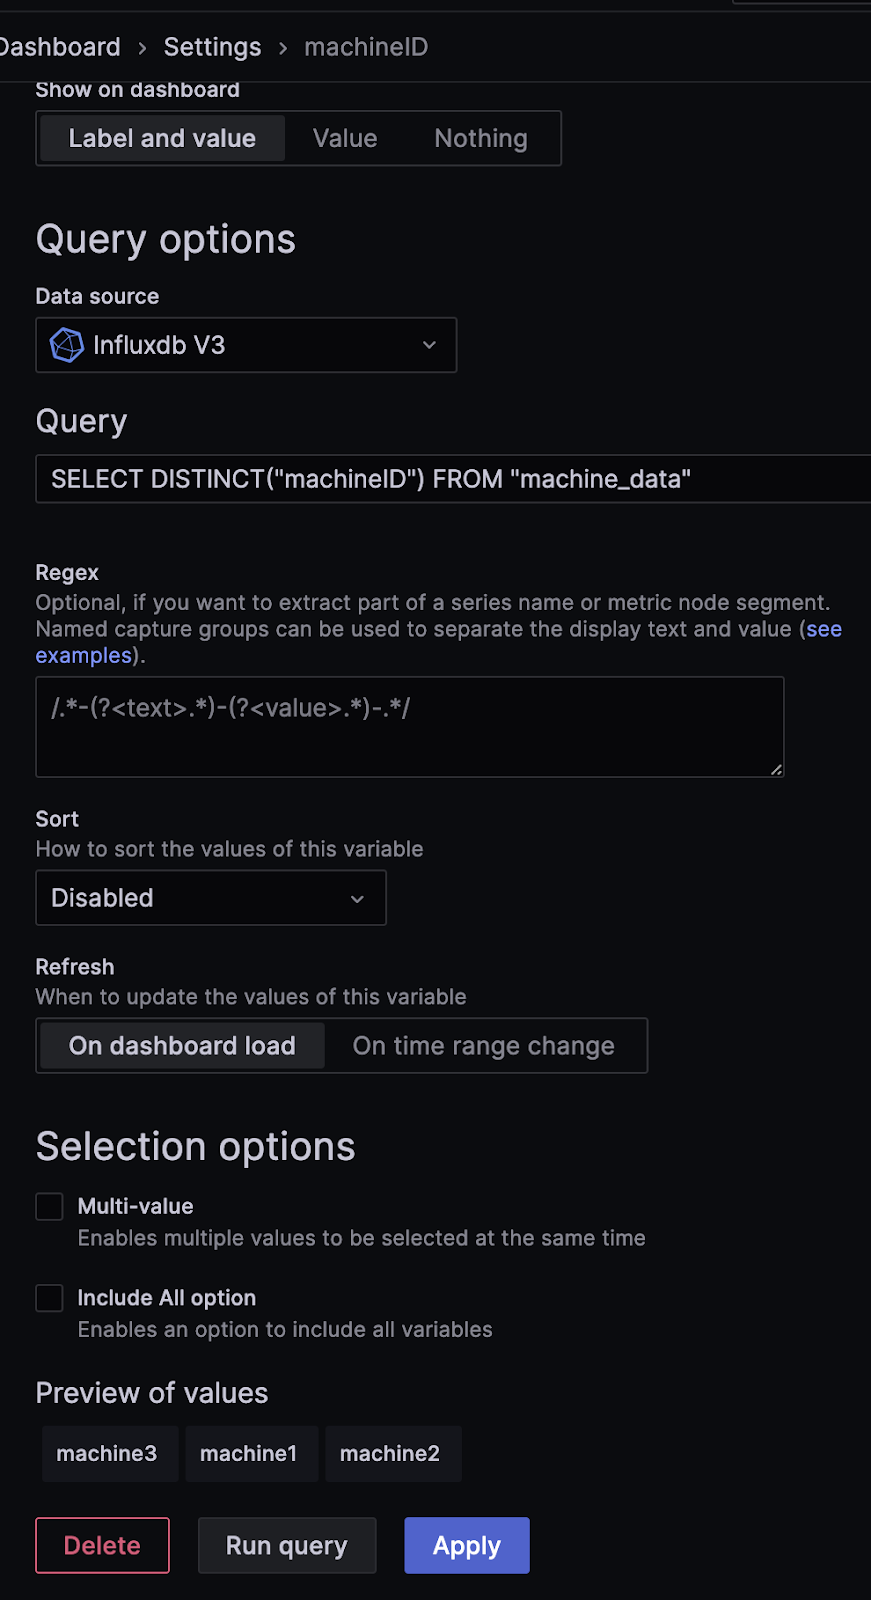
In this example, we created a dashboard variable to list individual machine tags. This can be utilized within our line graph query by referencing $machineID (the name of the dashboard variable).
SELECT "vibration", "machineID", time
FROM iox.machine_data
WHERE time >= $__timeFrom AND time <= $__timeTo AND "machineID" = '$machineID'
ORDER BY time

At the top left of the image, you can see our populated dashboard variable. We selected machine2, which appears to show an anomaly…
Next steps
We are extremely excited to see the new and improved InfluxDB data source in the hands of the community. We hope the new plugin provides a streamlined experience to start interacting with InfluxDB V3 via its Flight SQL interface. As you may have noticed, this new plugin is still alpha, so if you have any issues/feature requests, please let us know via our Slack community or open an issue within the Grafana repo. We have only scratched the surface of the changes made within the InfluxDB data source rewrite. Make sure to check out the next blog, in which we will dive deeper into some of the features and implementation, including moving the data source to the Grafana backend.
You can see all this in action here:
