One Click to Awesome: Deploying with the DigitalOcean Marketplace
By
David Flanagan
updated December 14, 2025
Use Cases
Developer
Navigate to:
We’re thrilled to announce that we’ve worked with DigitalOcean to bring the TICK Stack to their new Marketplace, providing all DigitalOcean users with a one-click TICK Stack.
Getting started
We’re going to assume you already have a DigitalOcean account. If you don’t, stop here and go sign-up.
Creating the droplet
From the DigitalOcean dashboard, we’re going to click “Marketplace” on the left-hand side menu. From there, you can then select “Monitoring” and you’ll see “InfluxDB TICK Stack”. Hover over the TICK Stack and click “Create Droplet”.

The TICK Stack runs great on DigitalOcean’s $5 droplet, so let’s start with that; you can increase capacity as you need later.
 <figcaption> Select $5 droplet</figcaption>
Create the droplet! Once it’s ready, you’ll have a new item in your droplet list. It’ll show a blue loading bar until it’s ready, then you’ll see the IP address. ???? Boom! We’re almost there.
 <figcaption> Wait for the IP address to be shown</figcaption>
Configuring Chronograf
After a minute, or two, Chronograf will be ready and listening on your droplet’s IP address. You can use your browser of choice and navigate to that IP. You’ll be presented with the Chronograf welcome page.
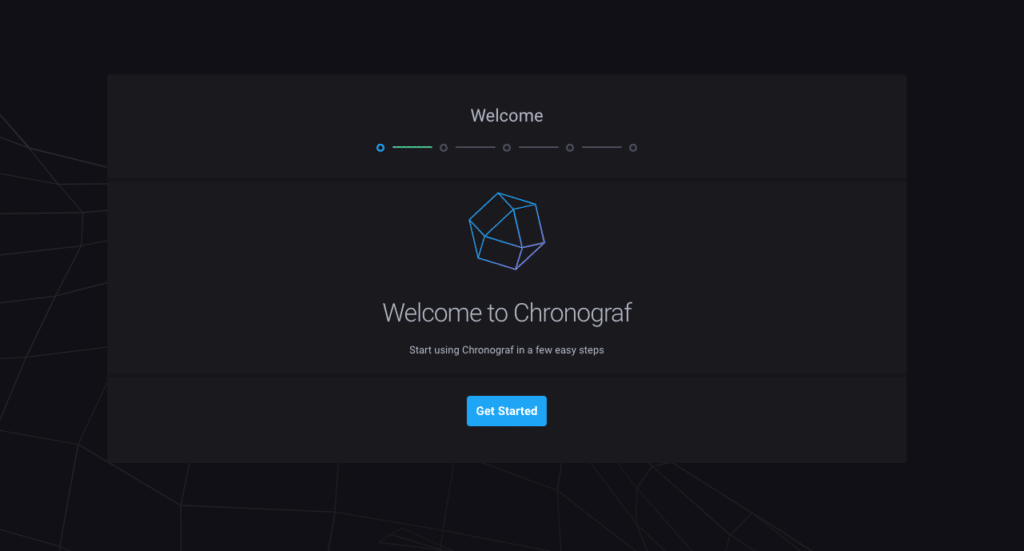 <figcaption> Chronograf Welcome Page</figcaption>
Click “Get Started” and it’ll ask for your InfluxDB configuration. You can get the credentials with the following command:
ssh -l root ip_address_of_droplet -C "cat ~/.digitalocean_password"This should return something akin to:
influxdb_admin_username="admin"
influxdb_admin_password="01c59692c3409696bee7fb2d1b82a4a5c46da6b67e58b832"
Enter the username and password into the text fields and click “Add Connection”.
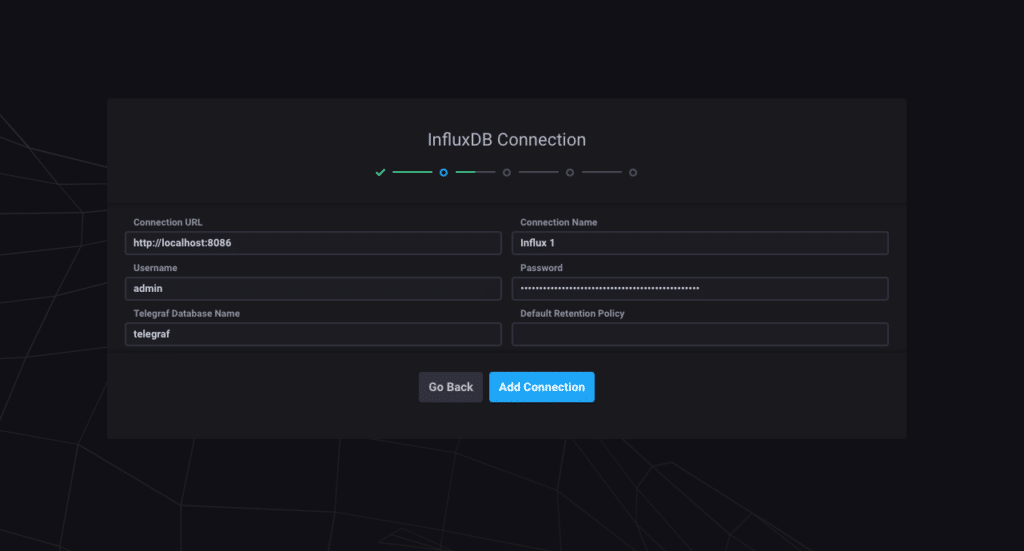 <figcaption> Chronograf Add Connection</figcaption>
We’ve already configured Telegraf on your droplet to ship metrics to InfluxDB, so you will be presented with the option to add a System dashboard.
 <figcaption> Chronograf Add System Dashboard</figcaption>
Click “Create 1 Dashboard”, followed by “Continue” on the Kapacitor page and you’re all set!
Using Chronograf
After Telegraf has been collecting metrics for a few moments, you’ll be able to see data on your system dashboard and via the metric explorer.
 <figcaption> Chronograf System Dashboard</figcaption>
Next steps
We cannot wait for you to get started with your own TICK Stack on top of DigitalOcean, but before you do, we have some final thoughts.
Securing Chronograf
Out of the box, Chronograf is not secured. We recommend that this is the first thing you configure. Chronograf can be configured with OAuth 2.0 authentication with many providers, including Google, GitHub, and GitLab. We also recommend enabling TLS with a LetsEncrypt certificate, as soon as you’ve added a CNAME record to your droplet.
Adding more metrics
You’re now free to configure Telegraf on other droplets or instrument your application to ship metrics to InfluxDB. You can create new users for this, rather than using admin via the Chronograf admin pages, or using the CLI.
Curious what Telegraf can ship to InfluxDB for you? Checkout our input plugin documentation.
We hope you enjoy our new one-click setup with DigitalOcean. Let us know what you think by tweeting us at @InfluxDB.
