Part 7: How-to Create an IoT Project with the TICK Stack on the Google Cloud Platform
By
Todd Persen
updated December 14, 2025
Product
Use Cases
Navigate to:
Part 7 : Collecting System Sensor Data with Telegraf
The last part of this tutorial looks at Telegraf, the “T” in the TICK Stack. Telegraf is an agent that is used to collect metrics from various input channels and write them to output channels. It supports over 60 plugins which can function as the input source or output target of data.
The agent is completely plugin driven and while it supports multiple plugins off the bat, you can write your own plugins too.
Our tutorial so far has looked at collecting temperature data from multiple weather stations and persisting that in InfluxDB. In addition to that, we also looked at setting up Chronograf to view the temperature data via a dashboard and set up alerts via Kapacitor, that pushed notifications to Slack in case the temperature went over a certain limit.
At this point, the data is being collected via Raspberry Pi stations that are having the temperature data and the flow is pretty much in place. The area that we would look at utilizing Telegraf would be to monitor the CPU, Memory and other system parameters of the InfluxDB server.
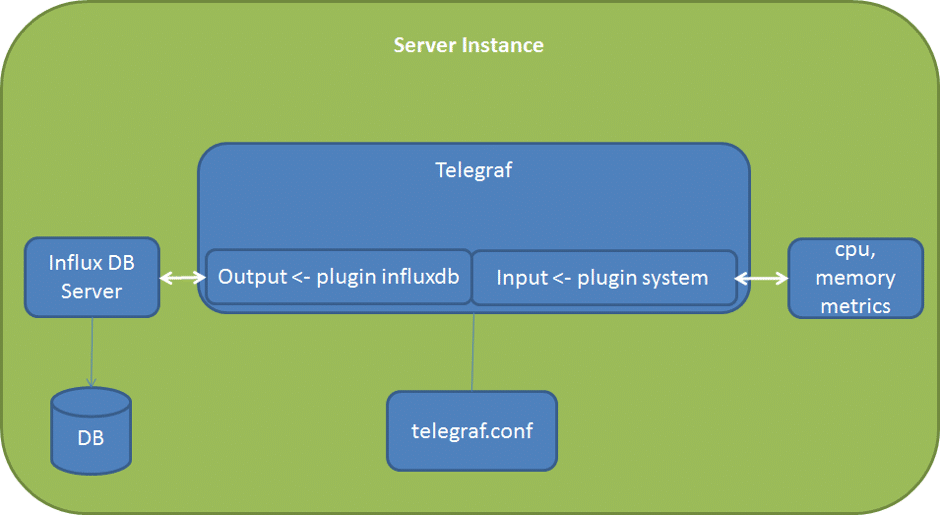
- Telegraf comes along with a input plugin named `system`. This plugin captures various metrics about the system that it is running on like memory usage, CPU, disk usage and more. We shall use this plugin to capture the cpu and memory metrics on the InfluxDB server.
- The input metrics captures will need to be sent to an output system. In our case, we will push this data into InfluxDB itself. This will help us capture these metrics into an InfluxDB database on which we could potentially then build out dashboard and alerts too via Chronograf and Kapacitor. Sounds neat. The output plugin therefore will be InfluxDB.
The diagram below depicts what we are going to do:
 Installing Telegraf
We are going to install Telegraf on the InfluxDB Server instance. Currently we just have one instance running in the Google Cloud and we will be setting it up on that.
As mentioned earlier, the VM runs Debian Linux and we can follow the steps for installing Telegraf as given at the official documentation site. Follow the instructions as given for installing the latest distribution of Telegraf as given below:
wget http://get.influxdb.org/telegraf/telegraf_0.10.2-1_amd64.deb

sudo dpkg -i telegraf_0.10.2-1_amd64.deb
Configuring Telegraf
We need to provide a configuration file to Telegraf. This configuration file will contain not just Agent configuration parameters but also the input and output plugins that you wish to configure.
There are a ton of plugins for both input and output that Telegraf supports and it does give a command to generate a telegraf.conf (Configuration file) that creates all the input and output plugin configuration sections. That is a useful thing to keep with you but not what we want for our need.
We will be using the following generic command to generate a Telegraf configuration file for us:
telegraf -sample-config -input-filter <pluginname>[:<pluginname>] -output-filter <outputname>[:<outputname>] > telegraf.confIn our case, we have the following:
- Input filters are the ones from the system input plugin. We are interested in cpu and mem.
- Output filter is just one and it is the InfluxDB output plugin.
We generate a telegraf.conf as shown below:
telegraf -sample-config -input-filter cpu:mem -output-filter influxdb > telegraf.confLet us look at the key sections in the generated telegraf.conf file:
- [agent] : This is the section for the Telegraf agent itself. Ideally we do not want to tweak too much here. Do note that you could change the frequency (time interval) at which the data collection is done for all inputs via the `interval` property.
- The next section is one or more `outputs`. In our case, it is just `influxdb output` i.e. `[[outputs.influxdb]]`. Two properties are key here, urls and database. The urls property is a list of influxdb instances. In our case there is just one and we are running Telegraf on the same machine as the InfluxDB instance, so the endpoint is pointing to the InfluxDB API Endpoint at `http://localhost:8086`. Similarly, database property is the database in which the input metrics will be collected. By default it is set to `telegraf` but you can change it to another one. I will go with the default one.
- The next sections are for the inputs. You can see that it has created the `[[inputs.cpu]]` and `[[inputs.mem]]` inputs. Check out the documentation for both cpu and mem inputs.
Starting Telegraf and collecting metrics
Let us start the Telegraf Agent now via the following command:
telegraf -config telegraf.confWe could have pushed the generated telegraf.conf into /etc/telegraf folder and started it as a service, but for the purpose of this tutorial explanation here, this is fine.
On successful startup, it displays an output as shown below:
$ telegraf -config telegraf.conf
2016/02/15 04:36:39 Starting Telegraf (version 0.10.2)
2016/02/15 04:36:39 Loaded outputs: influxdb
2016/02/15 04:36:39 Loaded inputs: cpu mem
2016/02/15 04:36:39 Tags enabled: host=instance-1
2016/02/15 04:36:39 Agent Config: Interval:10s, Debug:false, Quiet:false, Hostname:"instance-1", Flush Interval:10s
Recollect that one of the properties for the Telegraf Agent was the interval property which was set to 10 seconds. This was the interval at which it will poll all the inputs for data.
Here is the output from several data collection intervals:
2016/02/15 04:36:40 Gathered metrics, (10s interval), from 2 inputs in 531.909µs
2016/02/15 04:36:50 Gathered metrics, (10s interval), from 2 inputs in 447.937µs
2016/02/15 04:36:50 Wrote 4 metrics to output influxdb in 3.39839ms
2016/02/15 04:37:00 Gathered metrics, (10s interval), from 2 inputs in 482.658µs
2016/02/15 04:37:00 Wrote 3 metrics to output influxdb in 4.324979ms
2016/02/15 04:37:10 Gathered metrics, (10s interval), from 2 inputs in 775.612µs
2016/02/15 04:37:10 Wrote 3 metrics to output influxdb in 7.472159ms
2016/02/15 04:37:20 Gathered metrics, (10s interval), from 2 inputs in 438.388µs
2016/02/15 04:37:20 Wrote 3 metrics to output influxdb in 3.219223ms
2016/02/15 04:37:30 Gathered metrics, (10s interval), from 2 inputs in 419.607µs
2016/02/15 04:37:30 Wrote 3 metrics to output influxdb in 3.159644ms
2016/02/15 04:37:40 Gathered metrics, (10s interval), from 2 inputs in 426.761µs
2016/02/15 04:37:40 Wrote 3 metrics to output influxdb in 3.894155ms
2016/02/15 04:37:50 Gathered metrics, (10s interval), from 2 inputs in 449.508µs
2016/02/15 04:37:50 Wrote 3 metrics to output influxdb in 3.192695ms
2016/02/15 04:38:00 Gathered metrics, (10s interval), from 2 inputs in 498.035µs
2016/02/15 04:38:00 Wrote 3 metrics to output influxdb in 3.831951ms
2016/02/15 04:38:10 Gathered metrics, (10s interval), from 2 inputs in 448.709µs
2016/02/15 04:38:10 Wrote 3 metrics to output influxdb in 3.246991ms
2016/02/15 04:37:30 Gathered metrics, (10s interval), from 2 inputs in 419.607µs
2016/02/15 04:38:20 Gathered metrics, (10s interval), from 2 inputs in 514.15µs
2016/02/15 04:38:20 Wrote 3 metrics to output influxdb in 3.838368ms
2016/02/15 04:38:30 Gathered metrics, (10s interval), from 2 inputs in 520.263µs
2016/02/15 04:38:30 Wrote 3 metrics to output influxdb in 3.76034ms
2016/02/15 04:38:40 Gathered metrics, (10s interval), from 2 inputs in 543.151µs
2016/02/15 04:38:40 Wrote 3 metrics to output influxdb in 3.917381ms
2016/02/15 04:38:50 Gathered metrics, (10s interval), from 2 inputs in 487.683µs
2016/02/15 04:38:50 Wrote 3 metrics to output influxdb in 3.787101ms
2016/02/15 04:39:00 Gathered metrics, (10s interval), from 2 inputs in 617.025µs
2016/02/15 04:39:00 Wrote 3 metrics to output influxdb in 4.364542ms
2016/02/15 04:39:10 Gathered metrics, (10s interval), from 2 inputs in 517.546µs
2016/02/15 04:39:10 Wrote 3 metrics to output influxdb in 4.595062ms
2016/02/15 04:39:20 Gathered metrics, (10s interval), from 2 inputs in 542.686µs
2016/02/15 04:39:20 Wrote 3 metrics to output influxdb in 3.680957ms
2016/02/15 04:39:30 Gathered metrics, (10s interval), from 2 inputs in 526.083µs
2016/02/15 04:39:30 Wrote 3 metrics to output influxdb in 4.32718ms
2016/02/15 04:39:40 Gathered metrics, (10s interval), from 2 inputs in 504.632µs
2016/02/15 04:39:40 Wrote 3 metrics to output influxdb in 3.676524ms
2016/02/15 04:39:50 Gathered metrics, (10s interval), from 2 inputs in 640.896µs
2016/02/15 04:39:50 Wrote 3 metrics to output influxdb in 3.773236ms
2016/02/15 04:40:00 Gathered metrics, (10s interval), from 2 inputs in 491.794µs
2016/02/15 04:40:00 Wrote 3 metrics to output influxdb in 3.608919ms
2016/02/15 04:40:10 Gathered metrics, (10s interval), from 2 inputs in 571.12µs
2016/02/15 04:40:10 Wrote 3 metrics to output influxdb in 3.739155ms
2016/02/15 04:40:20 Gathered metrics, (10s interval), from 2 inputs in 505.122µs
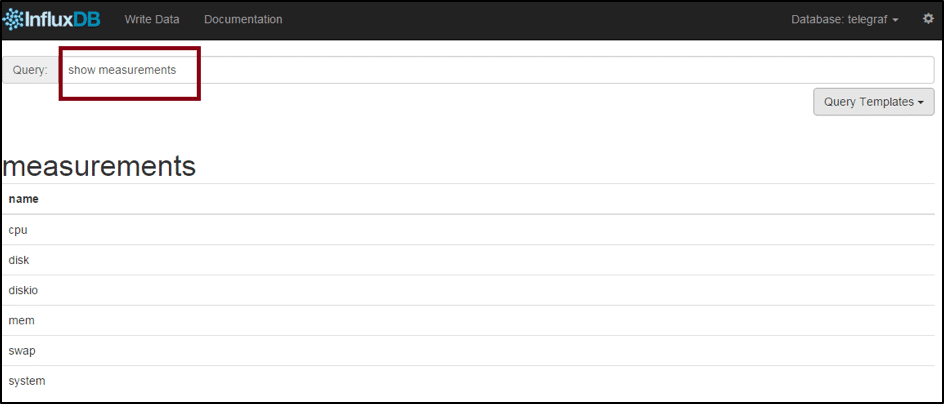
2016/02/15 04:40:20 Wrote 3 metrics to output influxdb in 4.151489msSince we have the InfluxDB Server running along with the endpoints for Admin interface, we can investigate the telegraf database from the Admin interface itself (you could have done that via the InfluxDB shell too!)
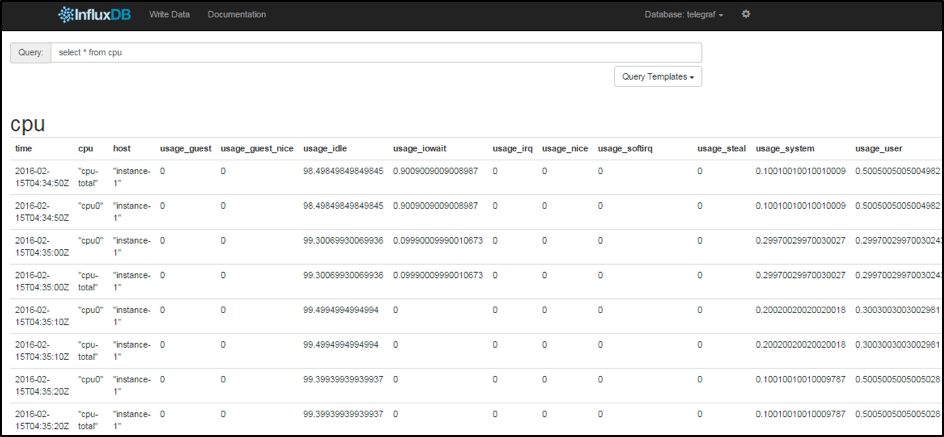
 Here are some of the
 cpu measurement records:
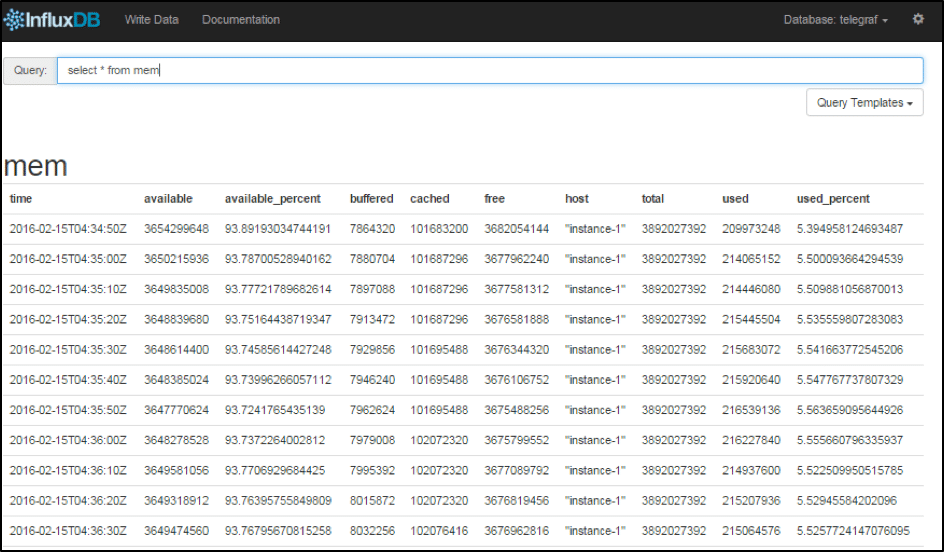
 Here are some of the
 mem measurement records:
 As a next step, you could hook in visualization (Chronograf) or alerts (Kapacitor) into this Telegraf database.
Conclusion
This concludes the 7-part tutorial on using the TICK stack from InfluxDB. The TICK stack provides a best in class set of components to build modern and extensible solutions on a time-series database. We hope this tutorial gave you a glimpse into its potential and gets you started to create winning applications.
What's next?
- Get started with InfluxDB here.
- Looking to level up your InfluxDB knowledge? Check out our economically priced virtual and public trainings.
