How to Use the Power BI Desktop InfluxDB 3 ODBC Connector
By
Anais Dotis-Georgiou
Oct 24, 2025
Developer
Navigate to:
The challenge of storing, processing, and alerting on your time series data is only part of the battle when it comes to deriving value from time-stamped data. While InfluxDB 3 addresses those hurdles with the database and Python processing engine, data analytics teams still need to be able to visualize their data and build dashboards to complete the time series story.
A Power BI connector for InfluxDB is a long-desired feature, and I’m happy to present you with today’s tutorial, in which we’ll learn how to use the Power BI InfluxDB 3 ODBC (Open Database Connectivity) connector to bring your time series data stored in InfluxDB 3 into Power BI. This blog post assumes you have the following requirements; if not, please download and install them:
- A Docker instance of InfluxDB 3 Core or Enterprise running, or a free trial of InfluxDB 3 Cloud
- Windows (For Mac users, consider using a VM like Parallels)
- Power BI Desktop (a free trial is also available)
- Arrow Flight SQL ODBC Driver
- The Power BI Desktop InfluxDB 3 connector
Please note that this tutorial is for Power BI Desktop only.
Setup walk through
In case you’re entirely new to InfluxDB 3, Docker, and Power BI, this section is for you as we’ll walk through the installation process for all the requirements above. Otherwise, feel free to skip this section and move on to the next.
I’m a Mac user, so the first thing I did was to install Parallels and activate their free trial. The docs and driver are easy to follow so I won’t go into detail here. I’m assuming that most people reading this post are Windows users anyways.
Install Power BI Desktop and the Arrow Flight SQL ODBC Driver
First, I downloaded Power BI Desktop. Activating your free trial is easy; just follow the prompts after installation.
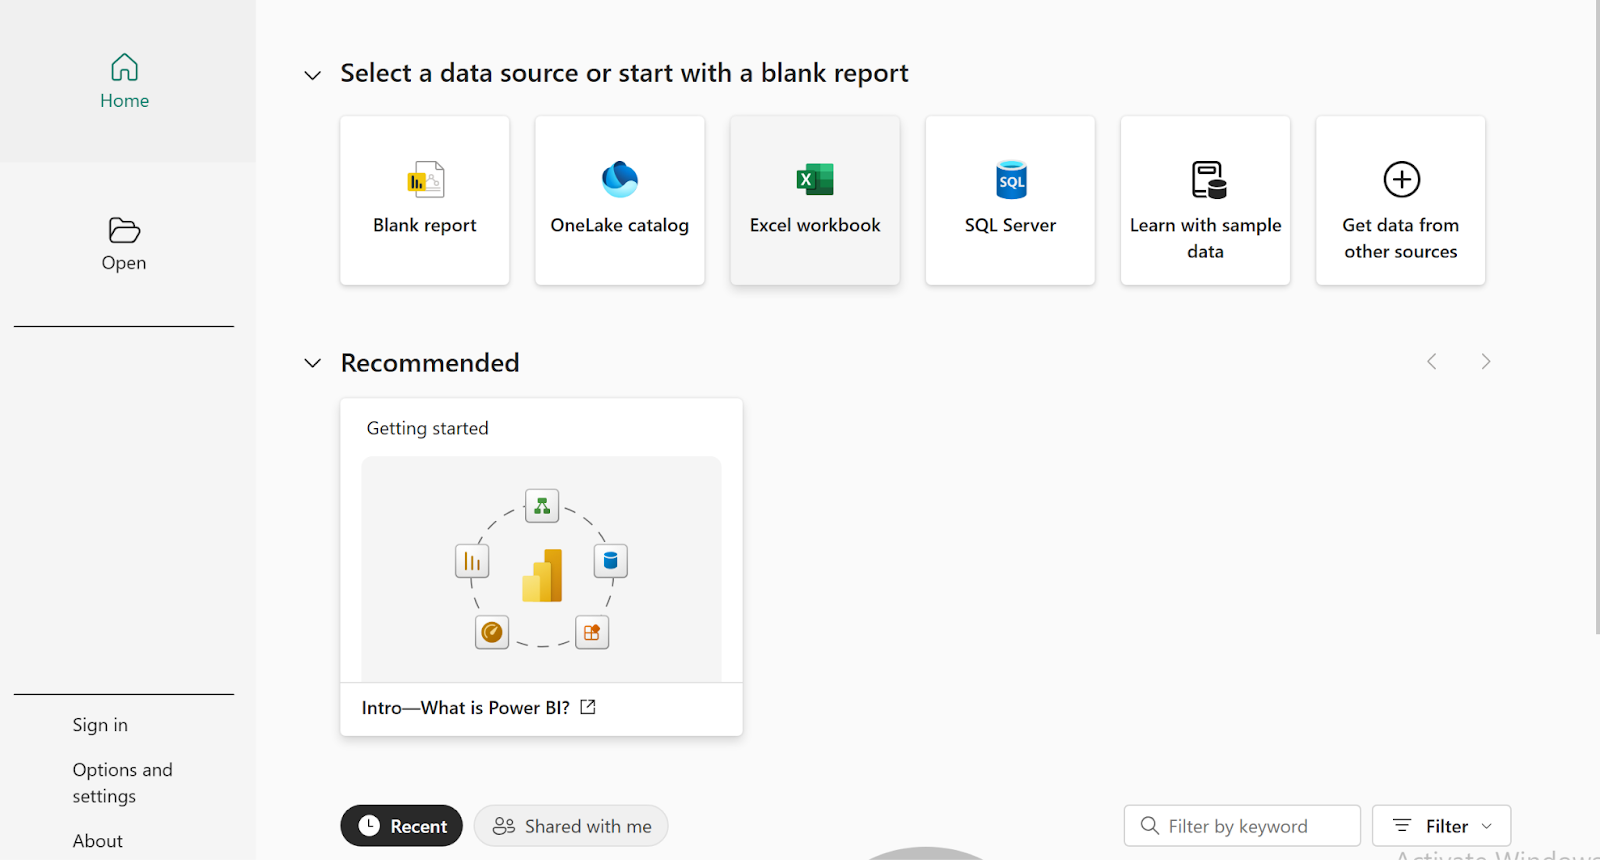 A screenshot of Power BI Desktop’s Free Trial Home page.
To install the Arrow Flight SQL ODBC Driver, you can run the following commands in PowerShell, making sure to correct the pathways by specifying your user:
# 1) Download
Invoke-WebRequest -Uri "https://download.dremio.com/arrow-flight-sql-odbc-driver/arrow-flight-sql-odbc-LATEST-win64.msi"
  -OutFile "C:\Users\"YOUR USER" \Downloads\arrow-flight-sql-odbc-win64.msi"

# 2) Unblock (mark as trusted)
Unblock-File "C:\Users\"YOUR USER" \Downloads\arrow-flight-sql-odbc-win64.msi"

# 3) Install (GUI)
Start-Process msiexec.exe -Wait -ArgumentList '/i "C:\Users\"YOUR USER"\Downloads\arrow-flight-sql-odbc-win64.msi"
From there, follow the installation instructions with default settings as per the driver instructions.
Setting Up InfluxDB
Next, I set up InfluxDB 3 Core. I decided to use InfluxDB 3 Core as it is InfluxData’s OSS version of InfluxDB. However, you can also use InfluxDB 3 Enterprise and register for a free trial during setup. I used Docker to run this instance; follow that link to install Docker if you don’t already have it. I also used VSCode and the Dev Containers extension to connect to the running Docker container to run shell commands directly within the container. However, for simplicity, I’ll include Docker container exec commands here instead.
 A screenshot of running commands directly within the container, after connecting with the Dev Containers extension in VS Code.
You can find the complete install docs for InfluxDB 3 Core here. First, we need to pull the image with:
docker pull influxdb:3-coreNext, we can serve InfluxDB 3 Core with:
docker run --rm --name influxdb3-core -p 8181:8181 \
  -v $PWD/data:/var/lib/influxdb3/data \
  -v $PWD/plugins:/var/lib/influxdb3/plugins \

  influxdb:3-core influxdb3 serve \
    --node-id=my-node-0 \
    --object-store=file \
    --data-dir=/var/lib/influxdb3/data \
    --plugin-dir=/var/lib/influxdb3/plugins
This command runs an InfluxDB 3 Core container and removes it when stopped (--rm). It maps port 8181 from the container to your local machine so you can access the database at localhost:8181. Two local directories are mounted into the container: one for persistent data ($PWD/data) and one for plugins ($PWD/plugins). Finally, it starts the InfluxDB 3 server with a specific node ID, using the filesystem as the object store (see all the options here), and points it to the mounted data and plugin directories. While we won’t be using the Python Processing Engine and plugins as a part of this tutorial, I like to serve all my instances of InfluxDB this way so it is available for future use.
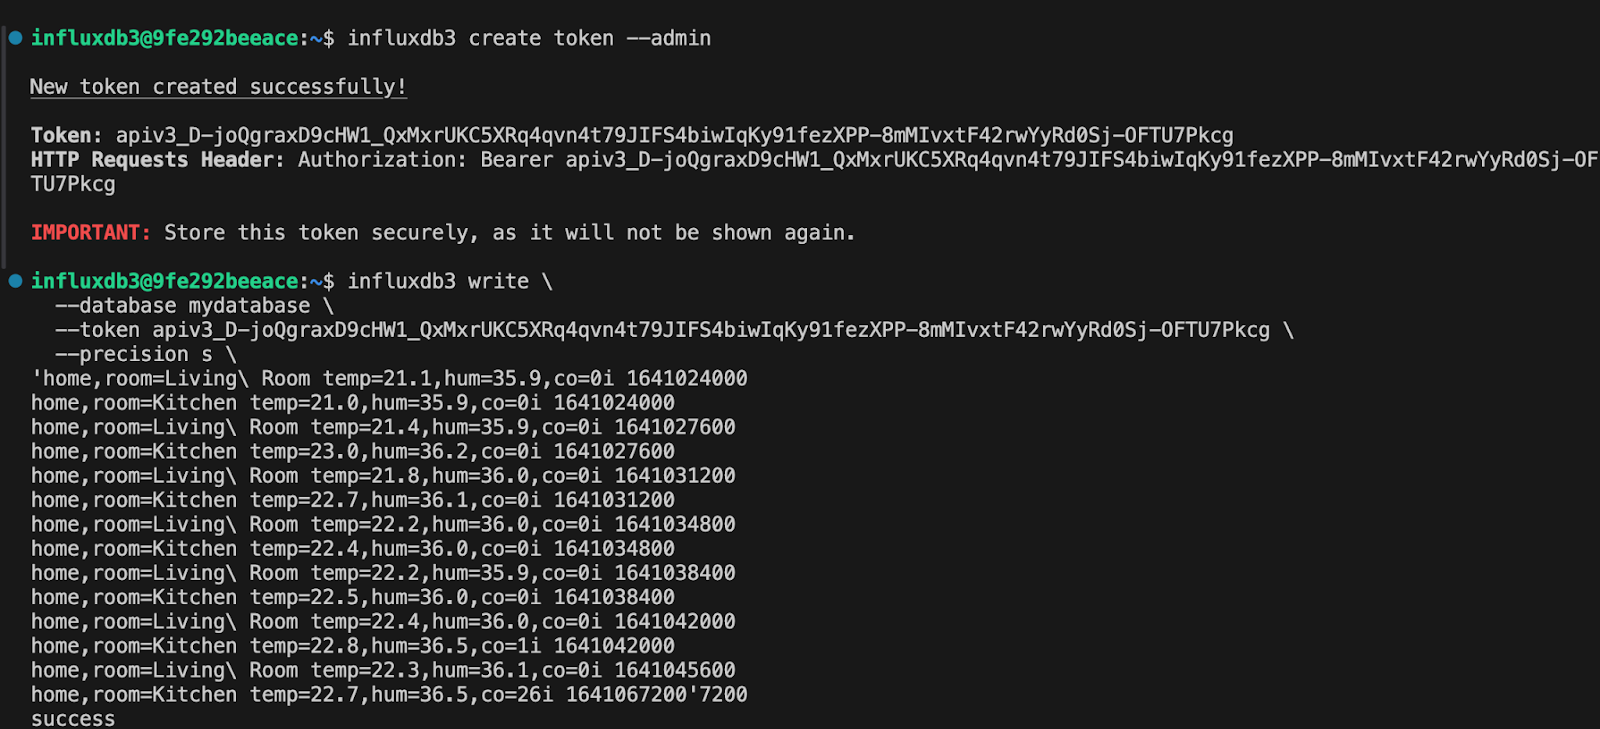
Now, we need to create a token for InfluxDB 3 Core and write some data to it. Let’s create that admin token with:
# With Docker — in a new terminal:
docker exec -it influxdb3-core influxdb3 create token --admin
Copy the first token you see; we’ll use it in the next command. In order to write data into InfluxDB, we first need to create a database to write data to:
docker exec -it influxdb3-core influxdb3 create database --token AUTH_TOKEN DATABASE_NAMEReplace DATABASE_NAME with the name of your choice—I used mydatabase, for example. Congratulations! You’ve successfully set up InfluxDB 3 Core.
Writing data to InfluxDB 3 Core
Now we’re ready to write some data to InfluxDB 3 Core so we can query and visualize it in Power BI Desktop. But before we do, I want to showcase a useful feature in the docs:
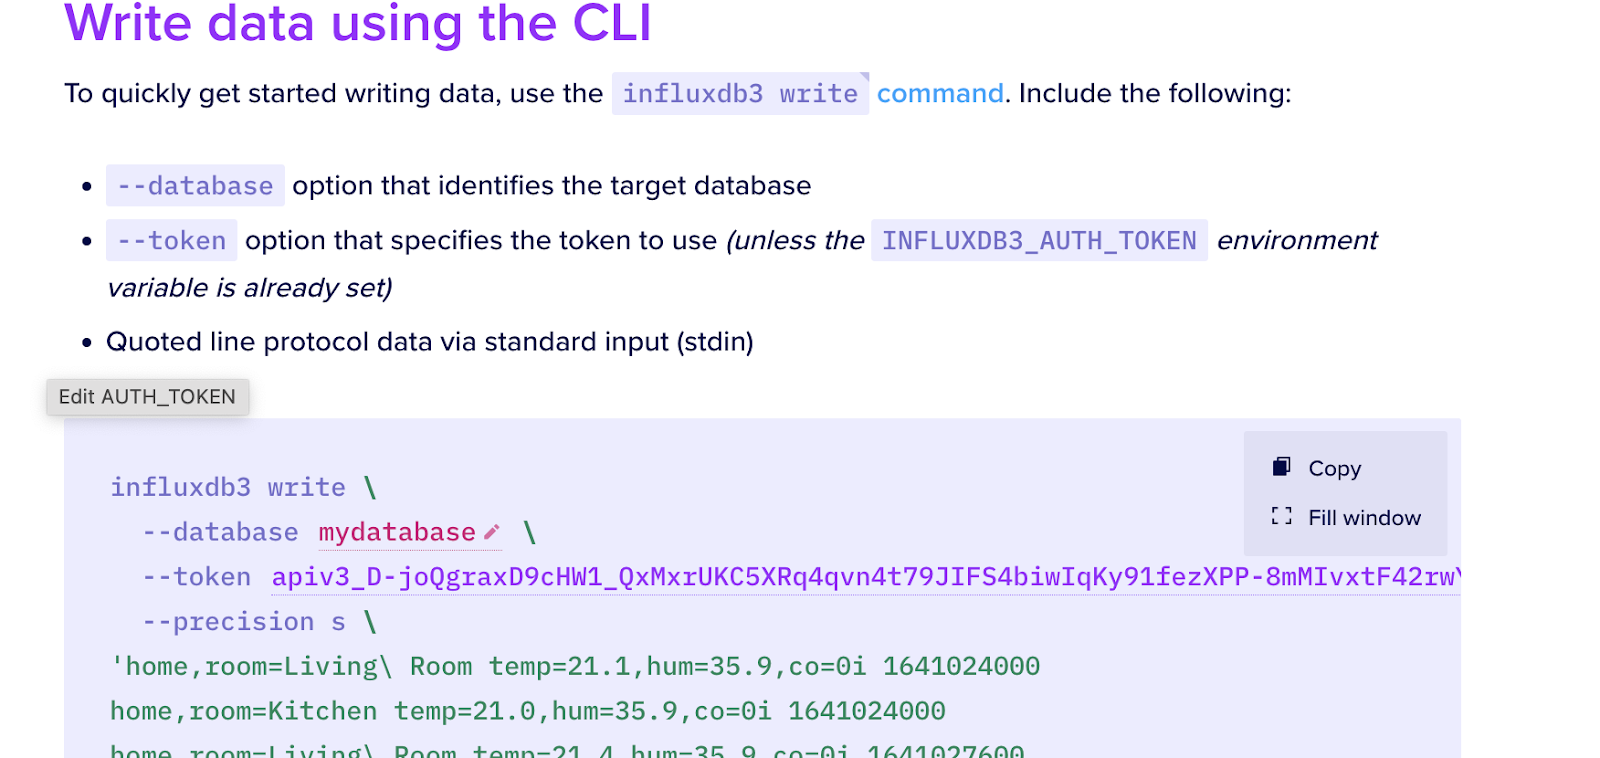
Editing code snippets in the InfluxDB Docs to more easily write data to InfluxDB 3.
Notice the red text: there you can edit any variables you need directly within the docs, like tokens and database names, to more easily copy code snippets.
Right, let’s get back to actually writing some sample data with the following:
influxdb3 write \
  --database DATABASE_NAME \
  --token AUTH_TOKEN \
  --precision s \
'home,room=Living\ Room temp=21.1,hum=35.9,co=0i 1641024000
home,room=Kitchen temp=21.0,hum=35.9,co=0i 1641024000
home,room=Living\ Room temp=21.4,hum=35.9,co=0i 1641027600
home,room=Kitchen temp=23.0,hum=36.2,co=0i 1641027600
home,room=Living\ Room temp=21.8,hum=36.0,co=0i 1641031200
home,room=Kitchen temp=22.7,hum=36.1,co=0i 1641031200
home,room=Living\ Room temp=22.2,hum=36.0,co=0i 1641034800
home,room=Kitchen temp=22.4,hum=36.0,co=0i 1641034800
home,room=Living\ Room temp=22.2,hum=35.9,co=0i 1641038400
home,room=Kitchen temp=22.5,hum=36.0,co=0i 1641038400
home,room=Living\ Room temp=22.4,hum=36.0,co=0i 1641042000
home,room=Kitchen temp=22.8,hum=36.5,co=1i 1641042000
home,room=Living\ Room temp=22.3,hum=36.1,co=0i 1641045600
home,room=Kitchen temp=22.8,hum=36.3,co=1i 1641045600
home,room=Living\ Room temp=22.3,hum=36.1,co=1i 1641049200
home,room=Kitchen temp=22.7,hum=36.2,co=3i 1641049200
home,room=Living\ Room temp=22.4,hum=36.0,co=4i 1641052800
home,room=Kitchen temp=22.4,hum=36.0,co=7i 1641052800
home,room=Living\ Room temp=22.6,hum=35.9,co=5i 1641056400
home,room=Kitchen temp=22.7,hum=36.0,co=9i 1641056400
home,room=Living\ Room temp=22.8,hum=36.2,co=9i 1641060000
home,room=Kitchen temp=23.3,hum=36.9,co=18i 1641060000
home,room=Living\ Room temp=22.5,hum=36.3,co=14i 1641063600
home,room=Kitchen temp=23.1,hum=36.6,co=22i 1641063600
home,room=Living\ Room temp=22.2,hum=36.4,co=17i 1641067200
home,room=Kitchen temp=22.7,hum=36.5,co=26i 1641067200'
The sample datasets consist of sensor data that records the temperature of various rooms in a house. Alternatively, consider writing a file of line protocol data with the file flag instead, using a client library or Telegraf.
Enabling the Power BI Desktop InfluxDB 3 Connector
We’re ready to set up the gateway to query our InfluxDB 3 instance, connect to our InfluxDB 3 Core instance, query our data, and create visualizations in Power BI Desktop.
Connector Extensibility
For this tutorial, we’re connecting InfluxDB 3 to Power BI through a custom connector. To enable custom connectors, I followed the Power BI Desktop custom Connector Extensibility documentation. Make sure you have downloaded the .pqx file from the Power BI Desktop InfluxDB 3 Connector download page. Copy or move it to [Documents]\Microsoft Power BI Desktop\Custom Connectors (make sure to create those folders if they don’t exist) with:
# 1. Create the Power BI custom connectors folder if it doesn't exist
mkdir -p ~/Documents/Power\ BI\ Desktop/Custom\ Connectors

# 2. Move your connector into that folder
mv InfluxDB.pqx ~/Documents/Power\ BI\ Desktop/Custom\ Connectors/
Now, return to Power BI Desktop. From the home page, select Options and Settings in the bottom left, then Options.
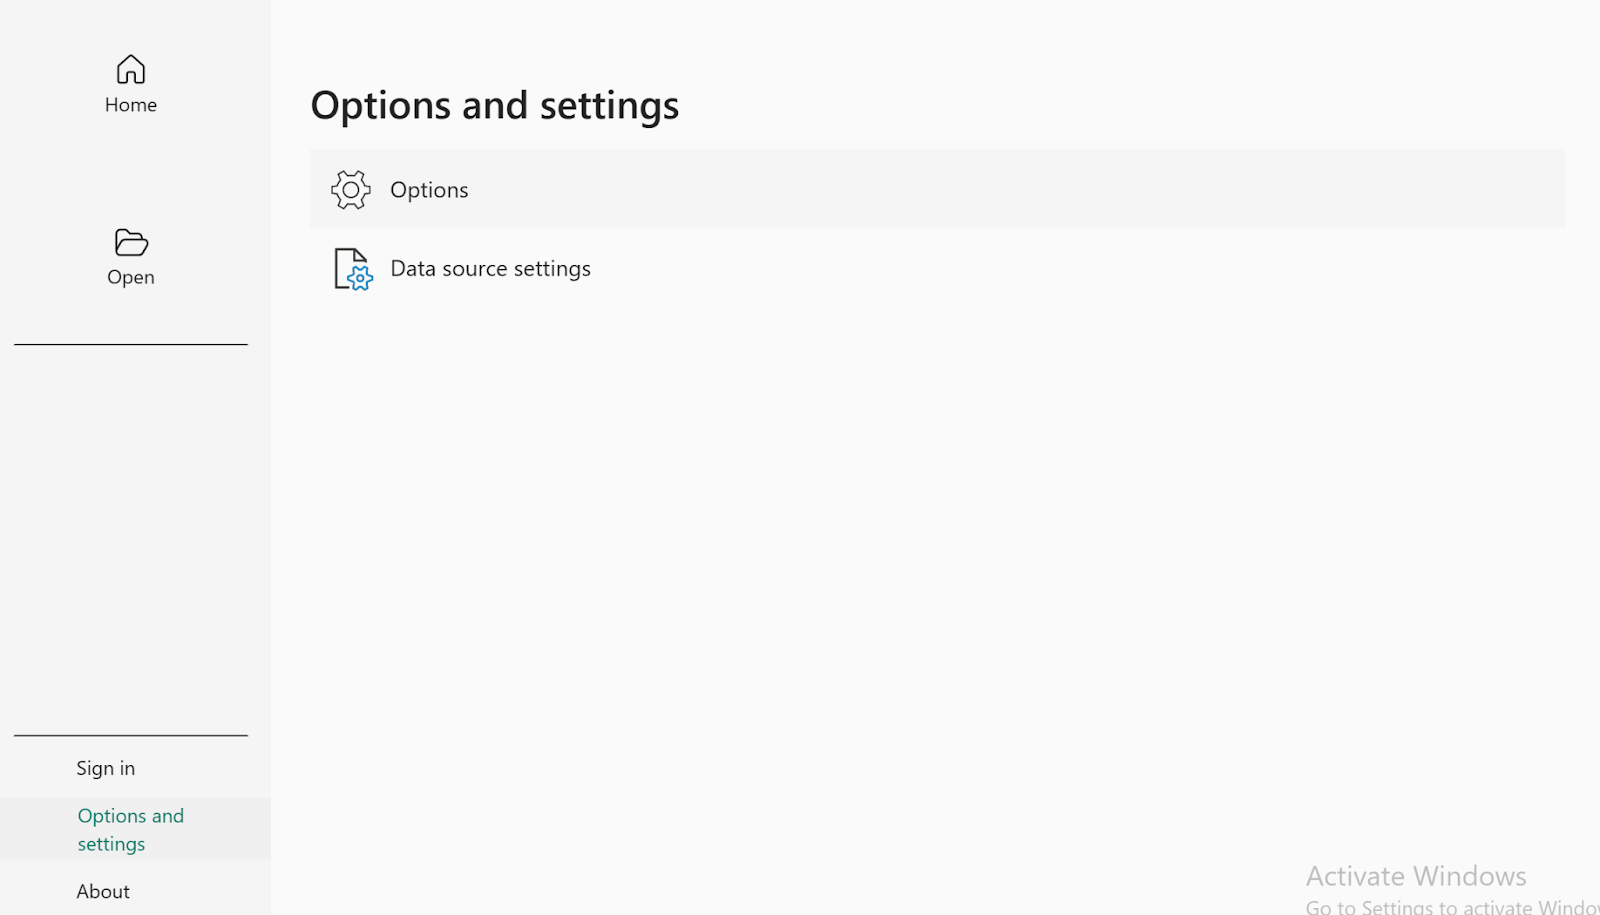 Screenshot of the options and settings page in Power BI Desktop, the first step in enabling the InfluxDB Connector.
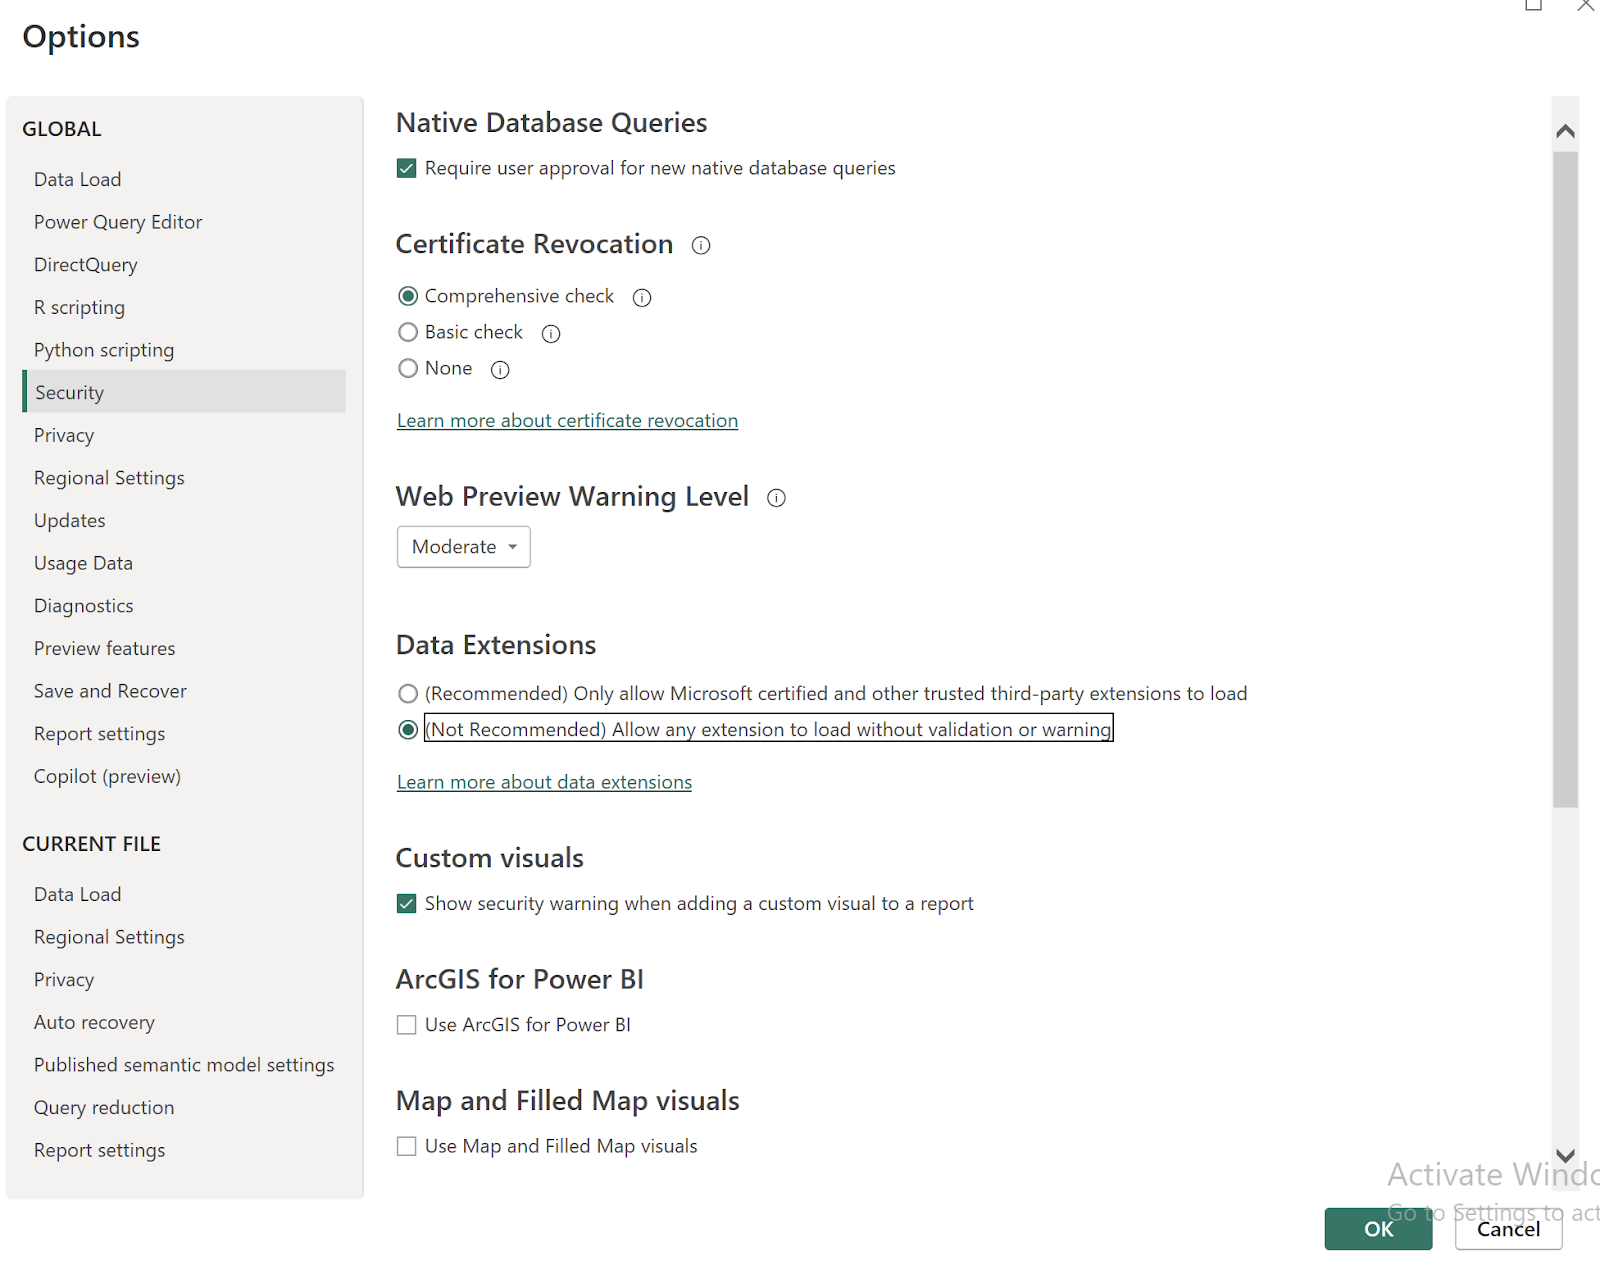 On the Options page in Power BI Desktop, click on “(Not Recommended) Allow any extension to load without validation or warning.”
Navigate to Security and select (Not Recommended) under Data Extensions. As per the Connector Extensibility docs, “The default Power BI Desktop data extension security setting is ‘(Recommended) Only allow Microsoft certified and other trusted third-party extensions to load.’ With this setting, if uncertified custom connectors are on your system, the Uncertified Connectors dialog box appears at startup and lists the connectors that can’t load.”
After you’ve changed these settings make sure to restart Power BI Desktop so that the connector can be discoverable.
Connect to InfluxDB 3
Return to the Power BI Desktop home page. Select Get Data from the Home ribbon in Power BI Desktop. Search and select InfluxDB 3.
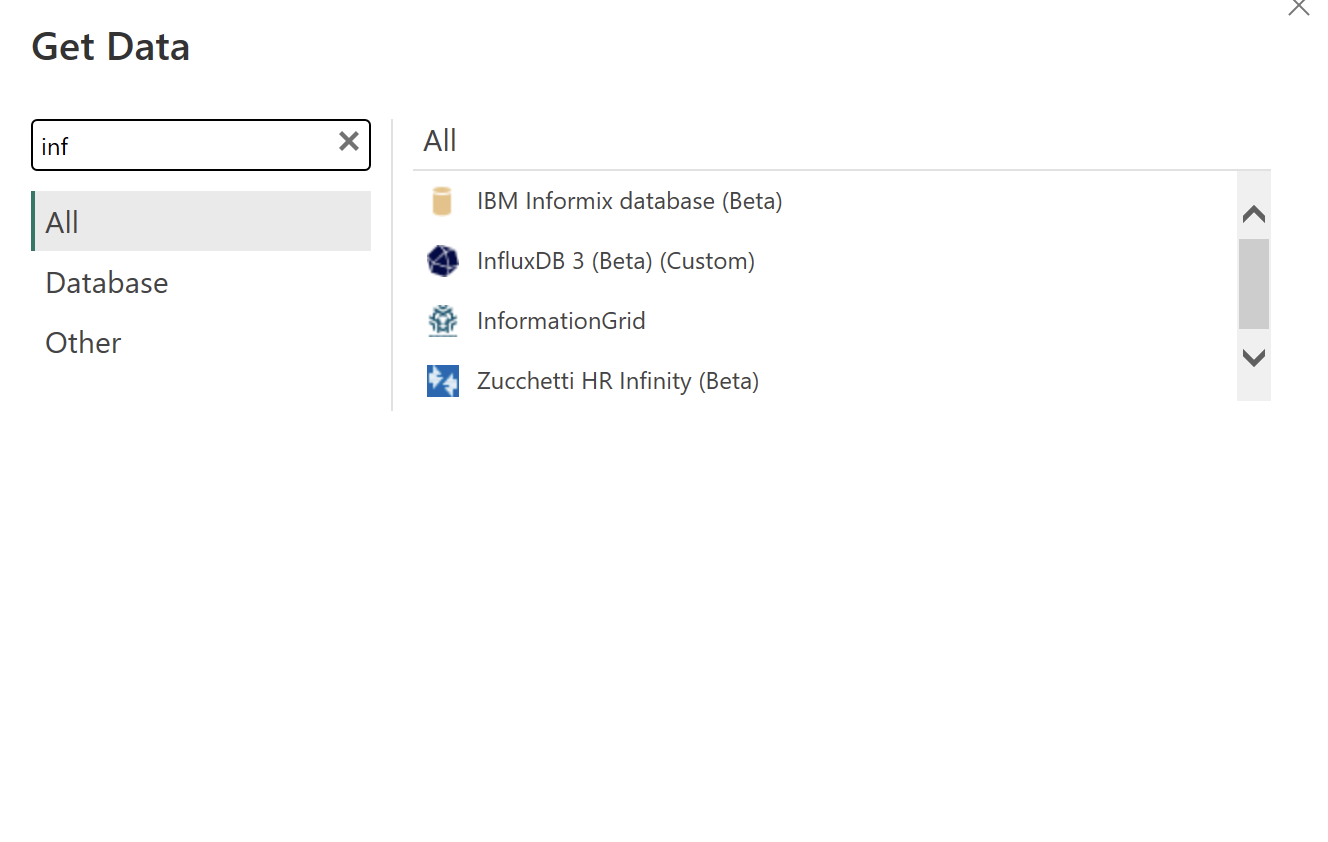 A screenshot of Power BI Desktop, searching for the InfluxDB 3 Custom connector.
We’re ready to use the connector to get data from our InfluxDB 3 Core instance. First, we need to specify the server URL. Since this is running on a Docker container on our machine, we can use http://localhost:8181 for the Server field. However, since I was running Windows on Parallels, I specified the IP directly with http://10.211.55.2. Make sure to include your database name and port (8181). Finally, we’ll select the Native Query option and include the data that we want to pull into Power BI.
Important Note: Because InfluxDB can handle high throughput and dimensional data, make sure to limit the size of the query request for each data source collection, so that Power BI can successfully handle data volume. Limit the size by using a limit clause or specifying time ranges, and optionally filtering by columns (or tags).
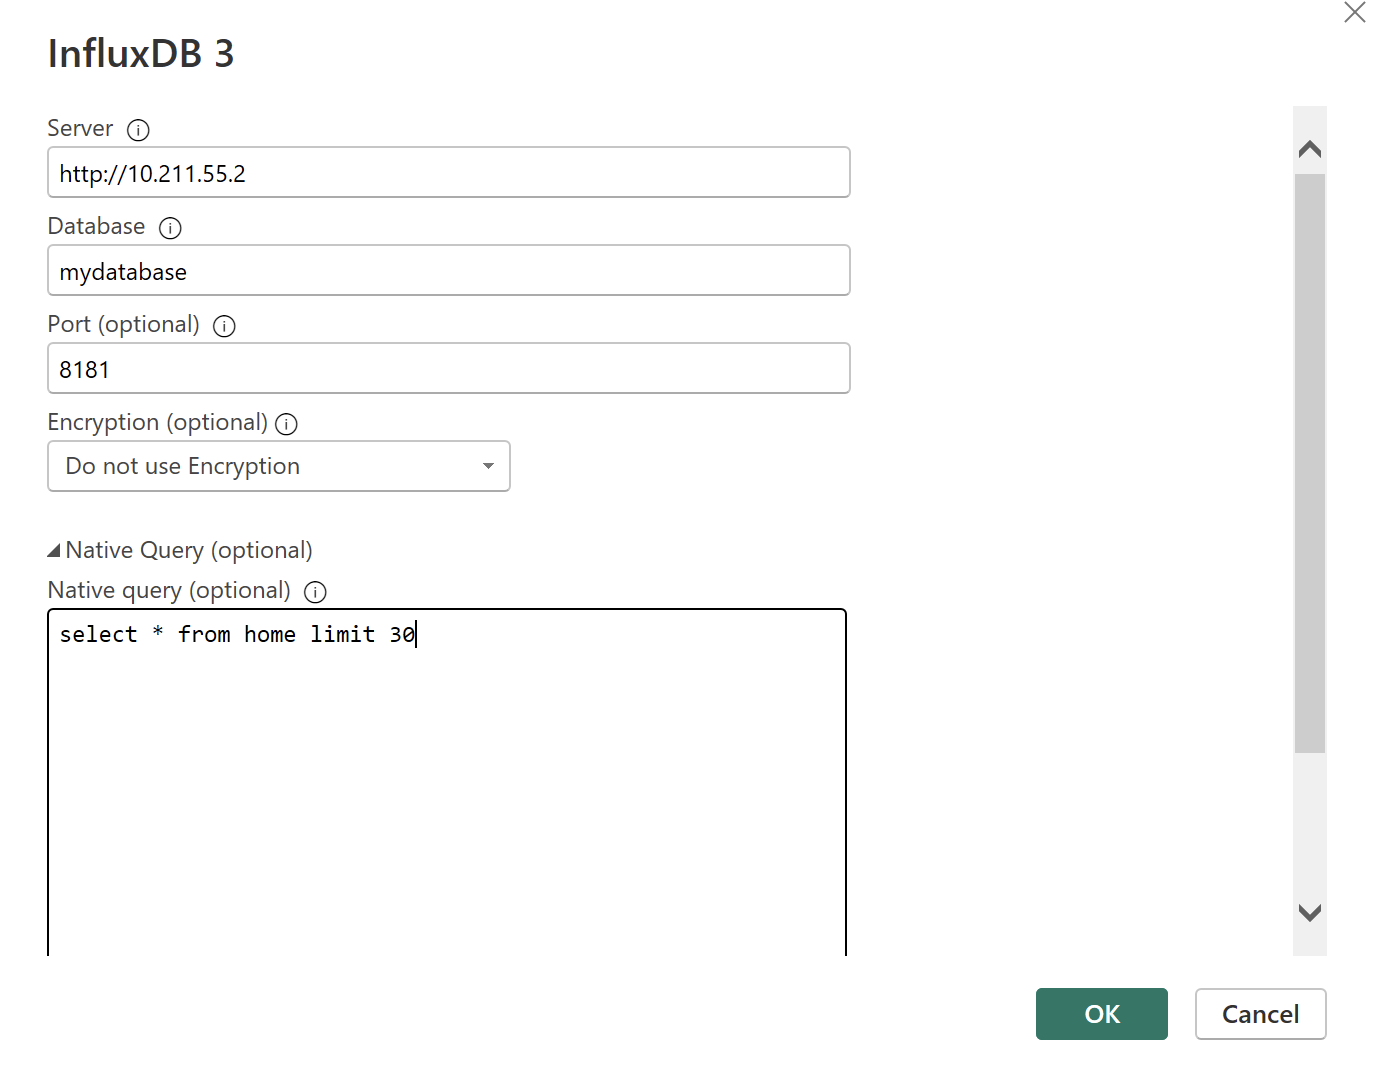 Querying InfluxDB 3 Core with a Native Query In Power BI Desktop.
Select DirectQuery as your query type and make sure to apply Native Query.
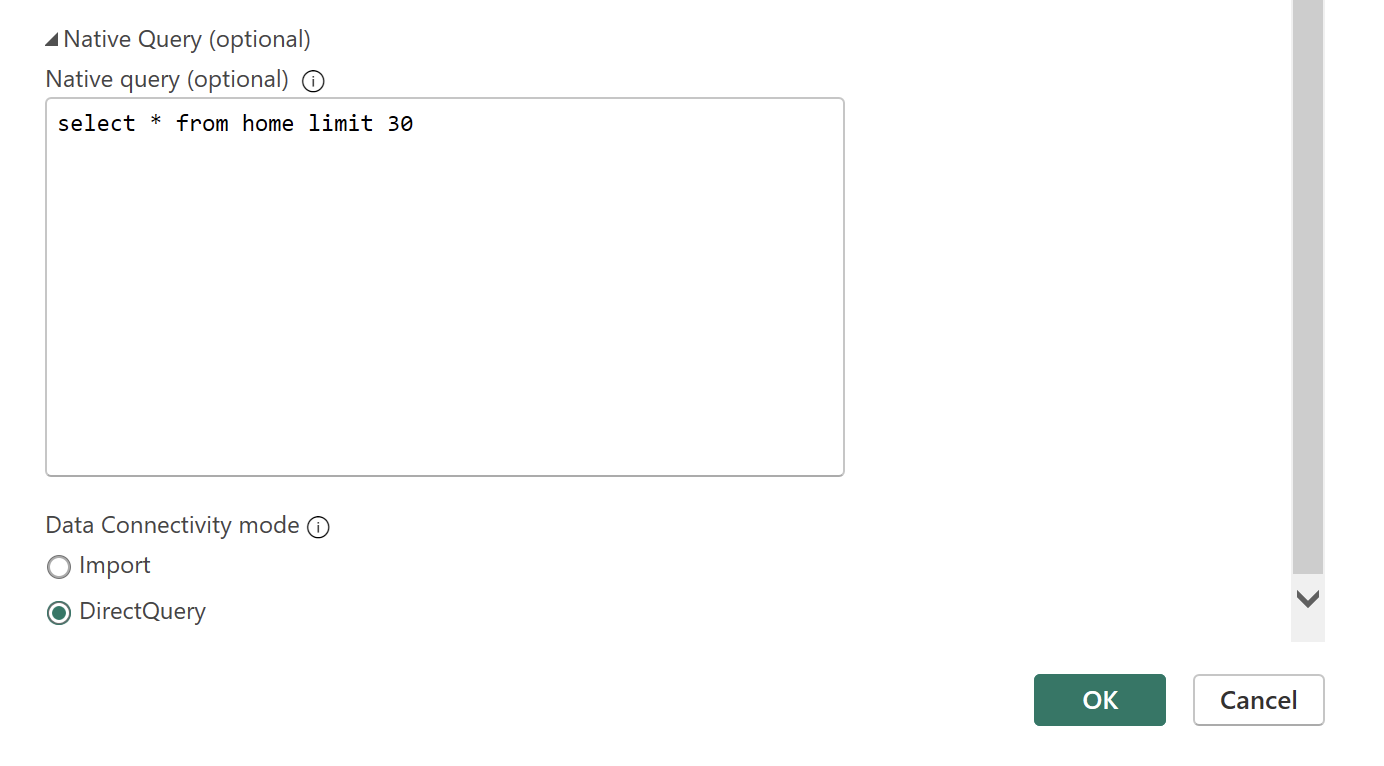 Select Direct Query as your Data Connectivity mode when configuring the Power BI Desktop InfluxDB3 connector.
Finally, make sure to add your token on the next page in order to complete the connection to your InfluxDB 3 instance:
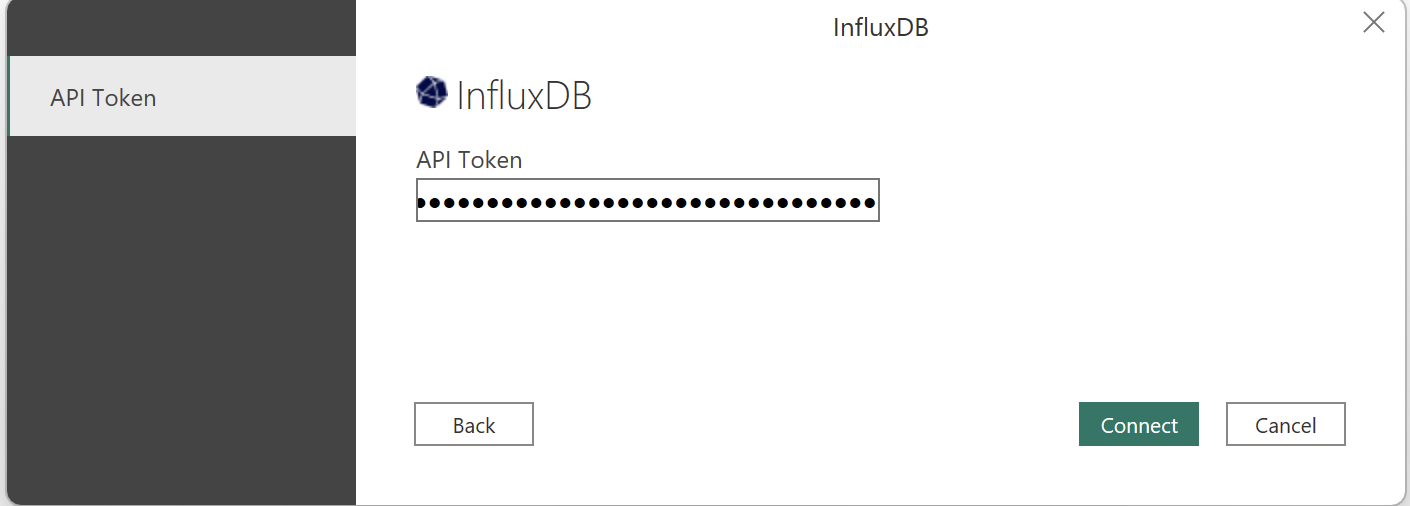 The final step in connecting to your InfluxDB 3 instance with a custom connector in Power BI Desktop.
We are then offered a preview of the data we want to load into Power BI Desktop, confirming a successful connection. Yay! We did it! Click Load to load the data.
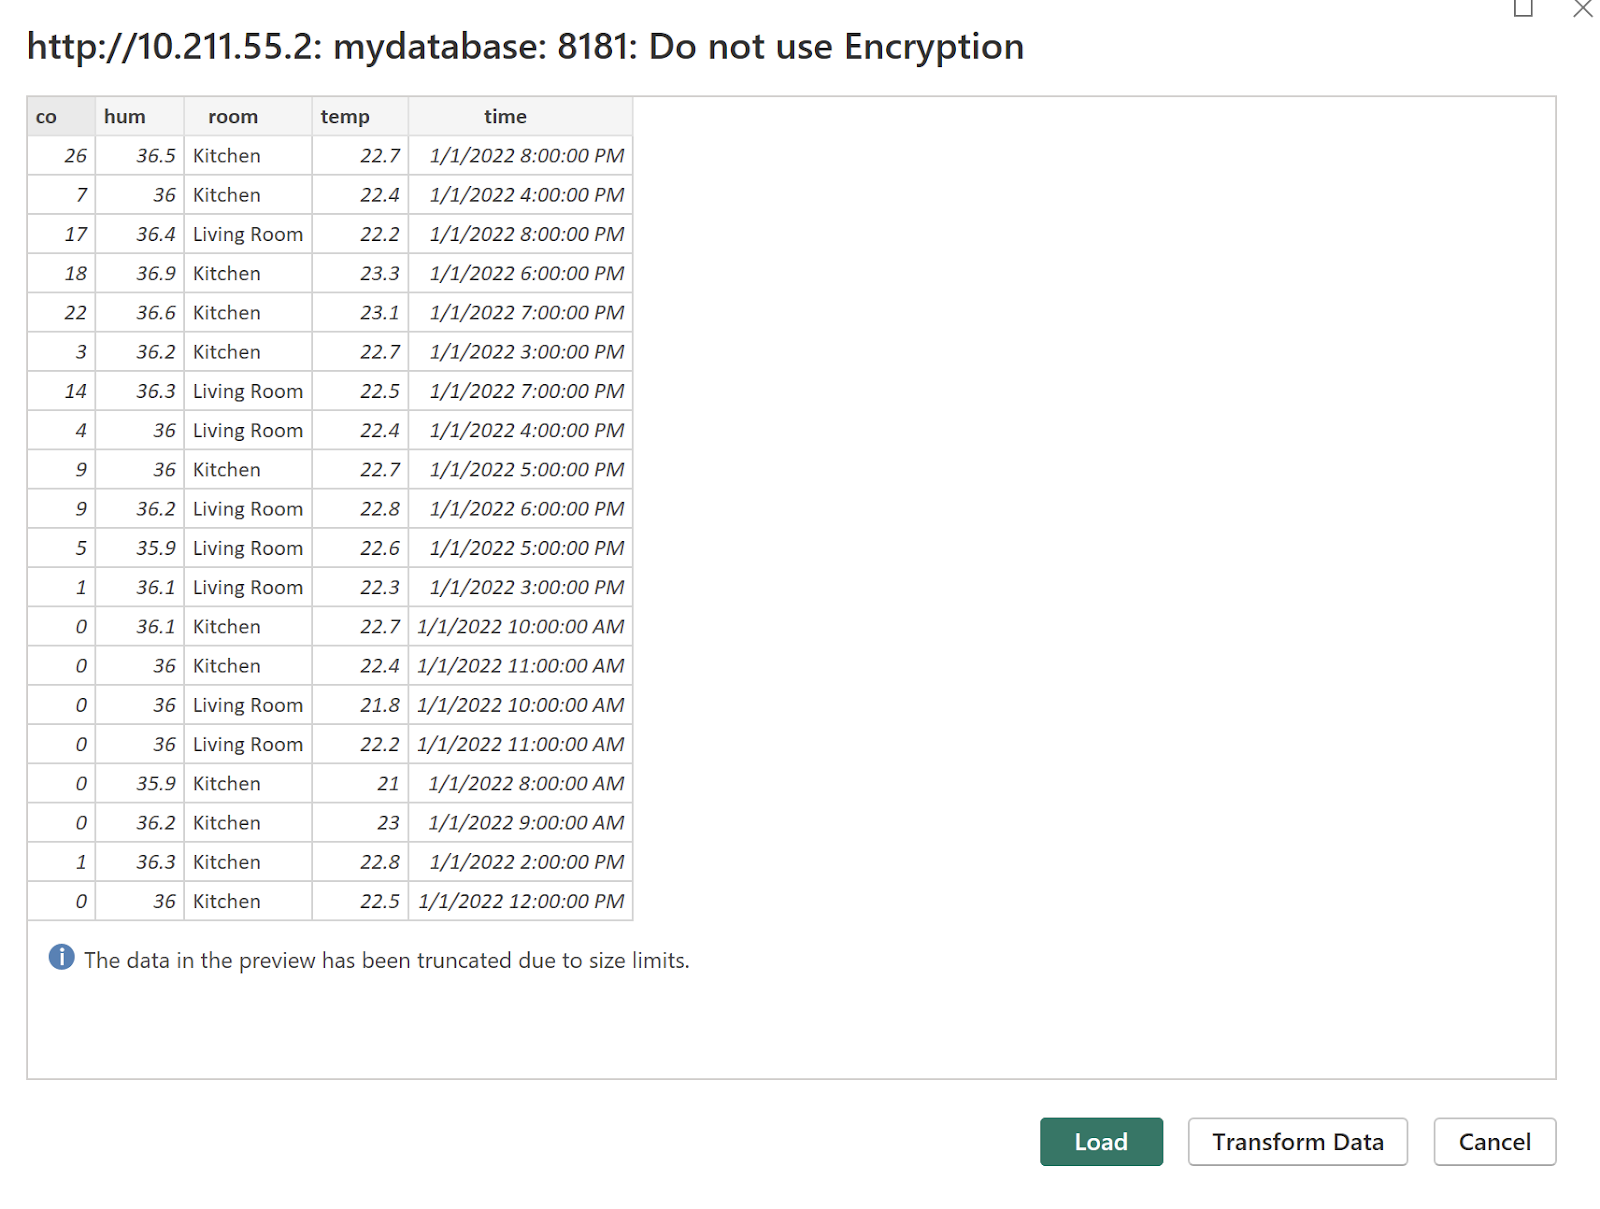 Preview of the time series data from InfluxDB 3 to be loaded into Power BI Desktop.
Visualizing data from InfluxDB 3 in Power BI Desktop
Congratulations! We’re now able to see our data in Power BI, apply filters, and create an assortment of visualizations. In the screenshot below we have a table view of all our data. We can apply filters to that data through the Filters panel. Make sure to specify the columns you want to include in your table on the right-most Query column. In the screenshot below, I select for the sum of co, room, and time. Fields are summed by default. Select the field in the Fields pane or the Visualizations pane, go to the Modeling tab, and change the Default Summarization to “Don’t Summarize,” if you desire raw values.
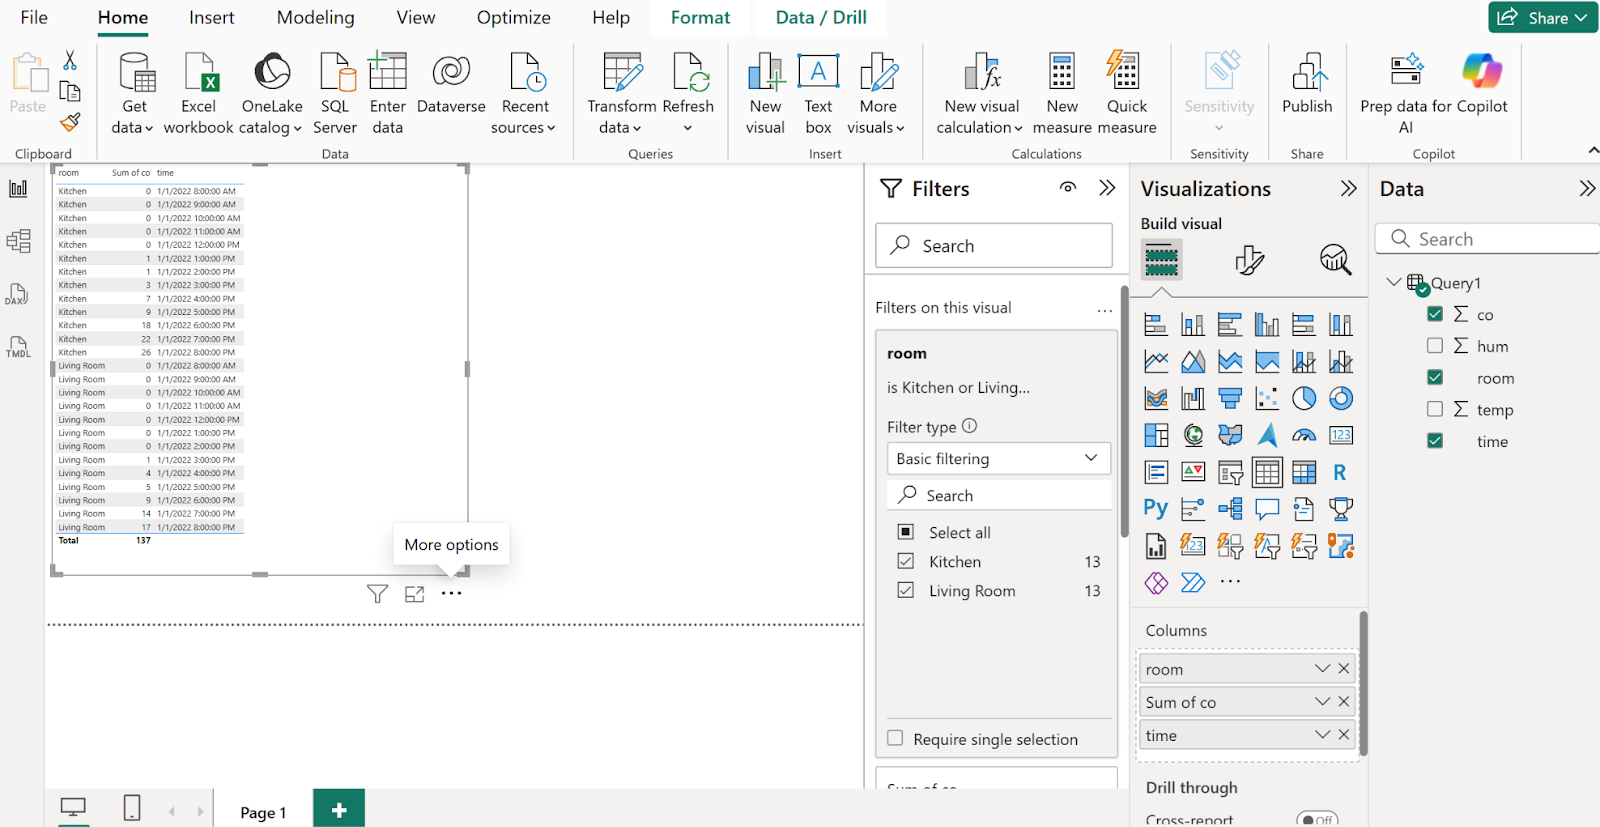 Viewing summarized time series data (default) in Power BI Desktop from InfluxDB 3.
Click on different visualization types in the middle Visualizations control panel, i.e., a line graph:
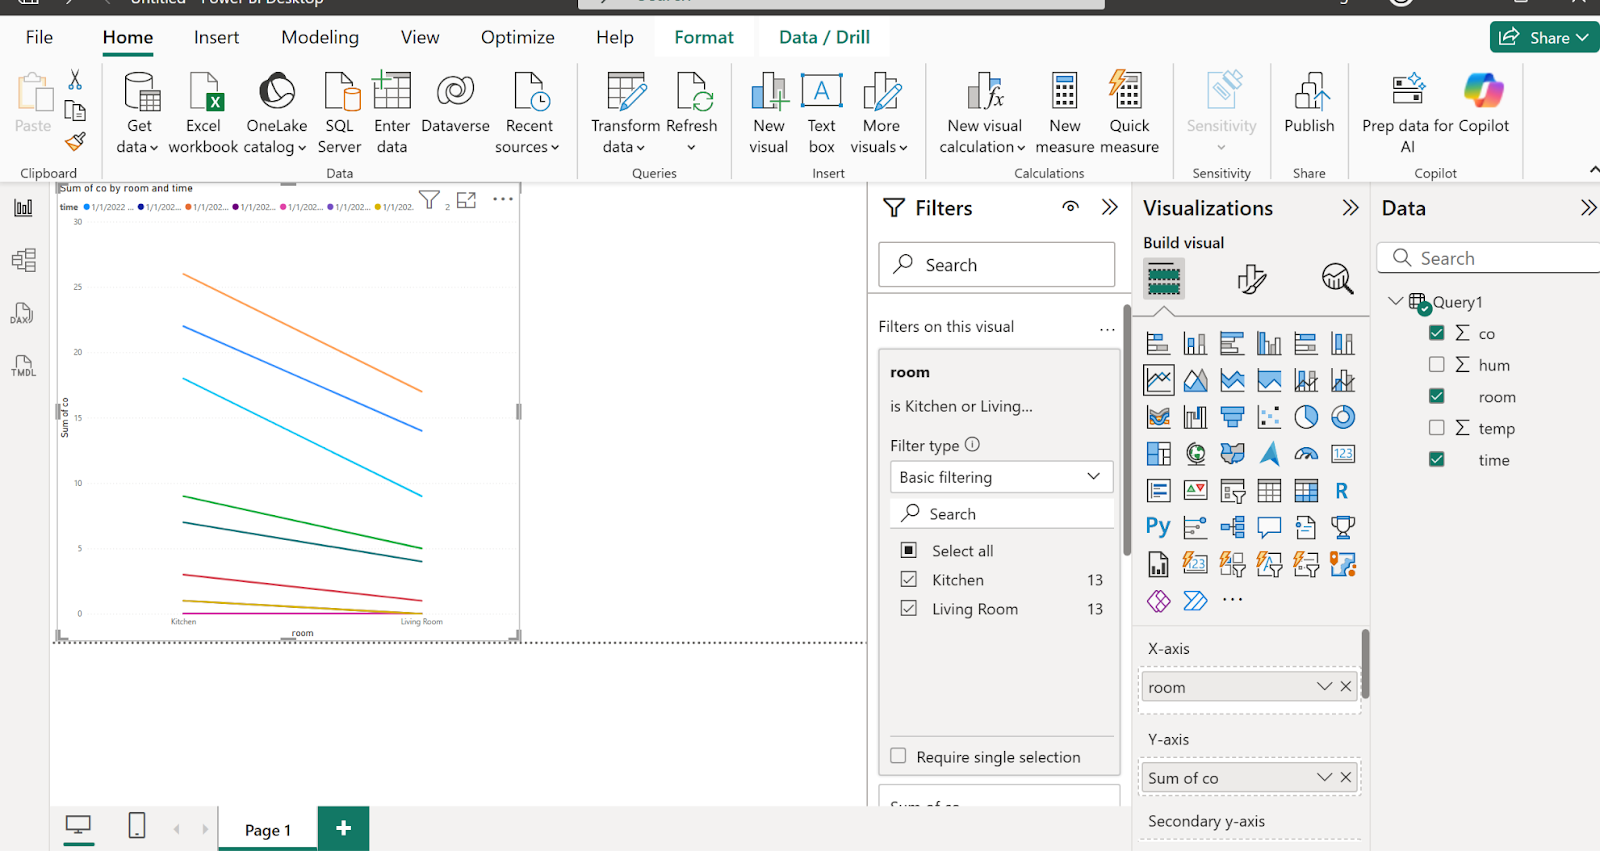
A line graph with data from InfluxDB 3 in Power BI Desktop.
Final thoughts
I hope this tutorial has helped you load your time series data from InfluxDB 3 to Power BI Desktop. This integration is a long awaited feature request, and I’m delighted that we’ve been able to deliver it to our users. For those who are new to InfluxDB, I want to take this opportunity to share other visualization tools that InfluxDB 3 offers in case you’re still exploring visualization and dashboarding options:
As always, if you need help, please contact us on our community site or Slack channel. If you are also working on a visualization project with InfluxDB, I’d love to hear from you! Please share your feedback on those channels as well.
