Predictive Analytics Using a Time Series Database
By
Anais Dotis-Georgiou
updated October 20, 2023
Use Cases
Product
Navigate to:
This article was originally published in The New Stack and is reposted here with permission.
Processing time-stamped data at high speed and volume, a time series database is particularly suited for anomaly detection and predictive maintenance.
Predictive analytics harnesses the power of big data, statistical algorithms and machine learning techniques to anticipate future outcomes based on historical data. Various industries use predictive analytics, from finance and healthcare to retail and marketing. Among its many uses, predictive maintenance and anomaly detection are two significant applications. Predictive maintenance uses predictive analytics to forecast machinery breakdowns, enabling timely maintenance and prevention of unexpected downtime.
Similarly, anomaly detection leverages the same predictive power to identify irregularities in data that could indicate a problem, such as fraud in financial transactions or intrusions in network security. Together, these applications of predictive analytics help organizations stay proactive and informed, paving the way for enhanced efficiency, reduced risks and improved decision-making.
A time series database provides key functionality for performing predictive analytics. Built specifically to handle data points indexed in time order, it allows for storing, retrieving and processing time-stamped data at high speed and volume. These capabilities make time series databases particularly suited for tasks such as anomaly detection and predictive maintenance.
InfluxDB 3.0 is a time series database and platform for storing all types of time series data including metrics, events, logs and traces.
In this post, we’ll explore how to combine InfluxDB Cloud, Quix and Hugging Face for predictive maintenance, including predictive analytics and forecasting. Quix is a platform that allows you to deploy streaming pipelines for analytics and machine learning. Hugging Face is a ML platform that enables users to train, build, host and deploy open source machine learning models and datasets.
The dataset
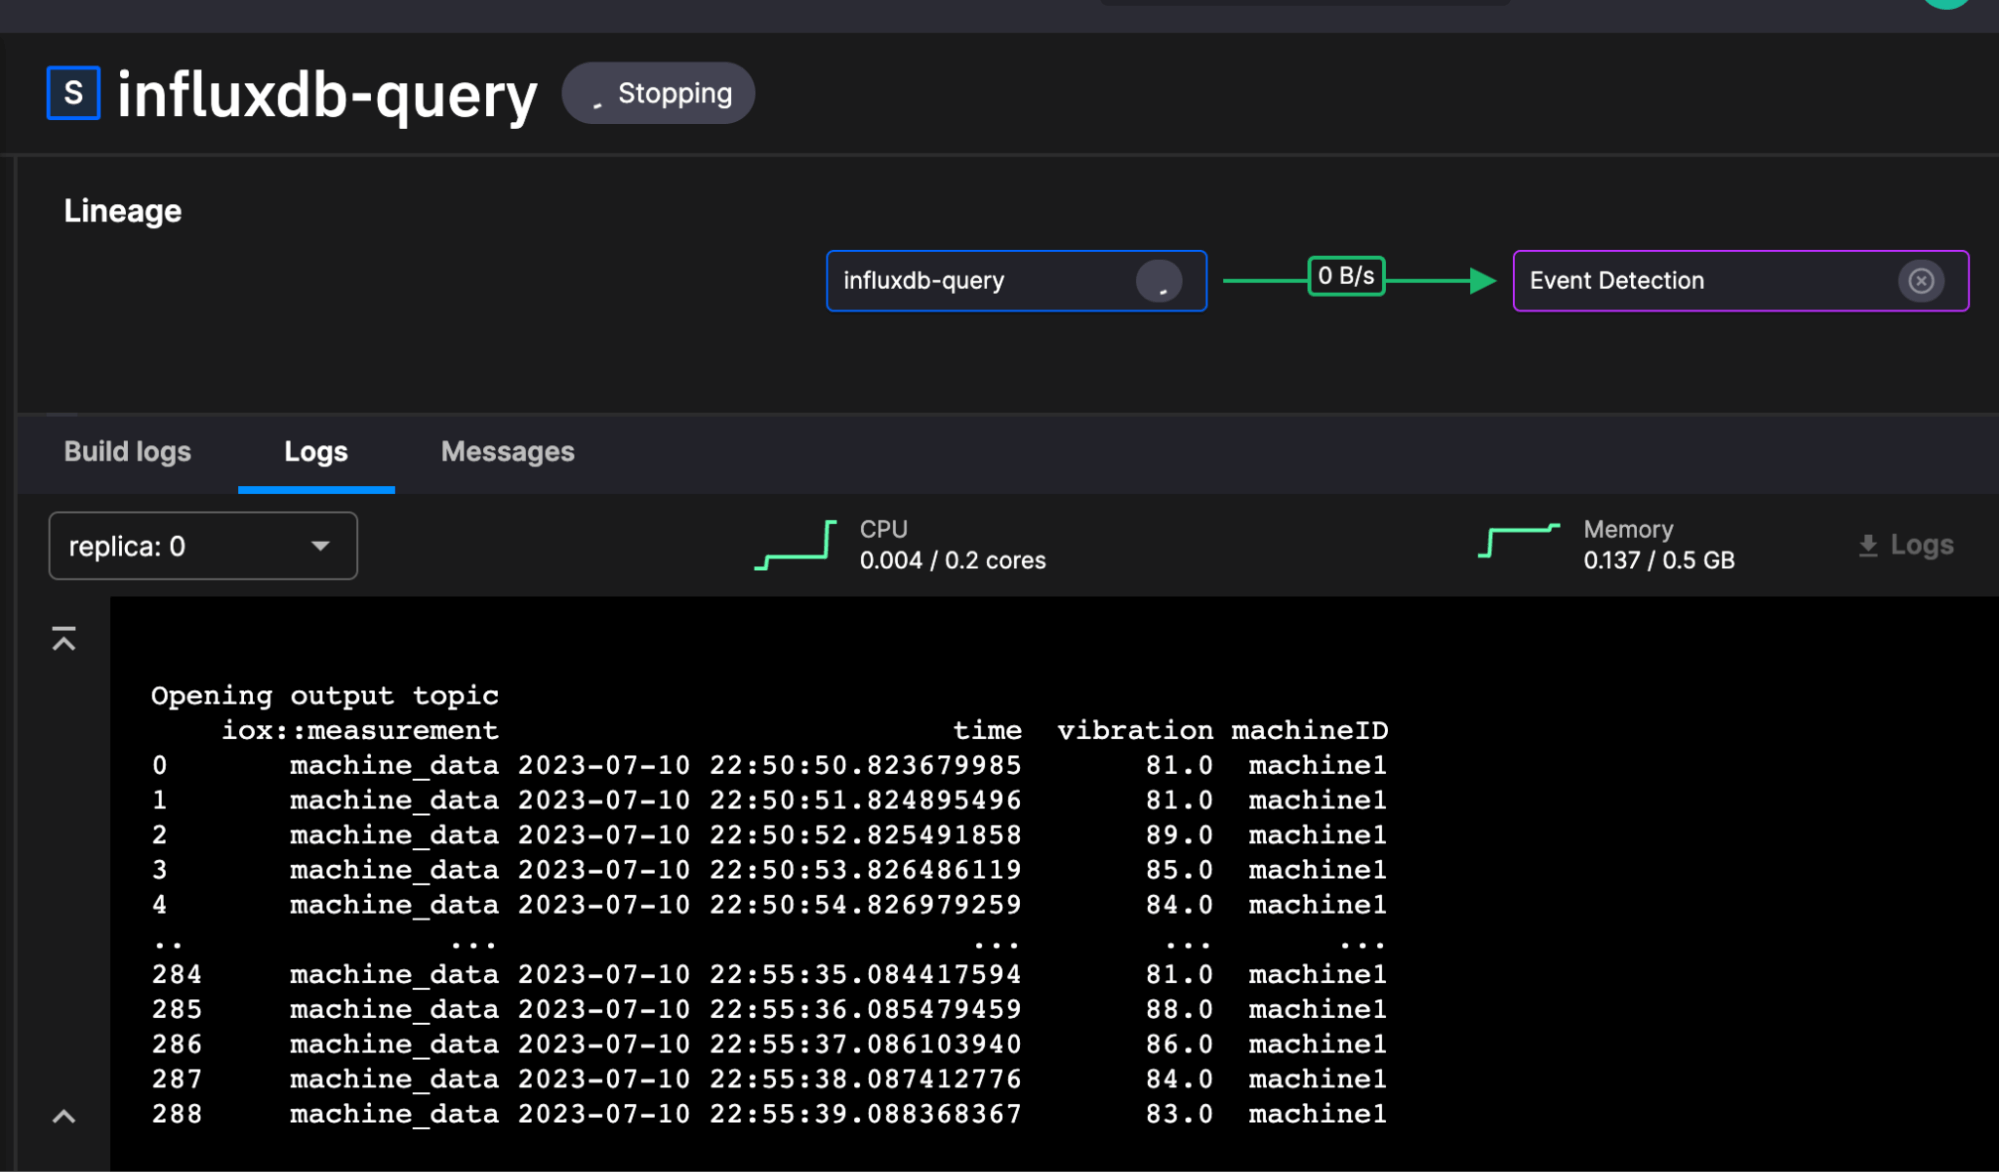
The dataset we’ll use for this post comes from this repo and specifically this script. It contains generated machine data with values like temperature, load and vibration for a variety of machine IDs. It’s a fabricated dataset so we can induce anomalies when needed to test the anomaly detection. This is what the data looks like coming out of the influxdb-query service.
The Quix anomaly detection and prediction pipeline
Quix enables us to deploy streaming pipelines for analytics and machine learning. The image below depicts our pipeline:
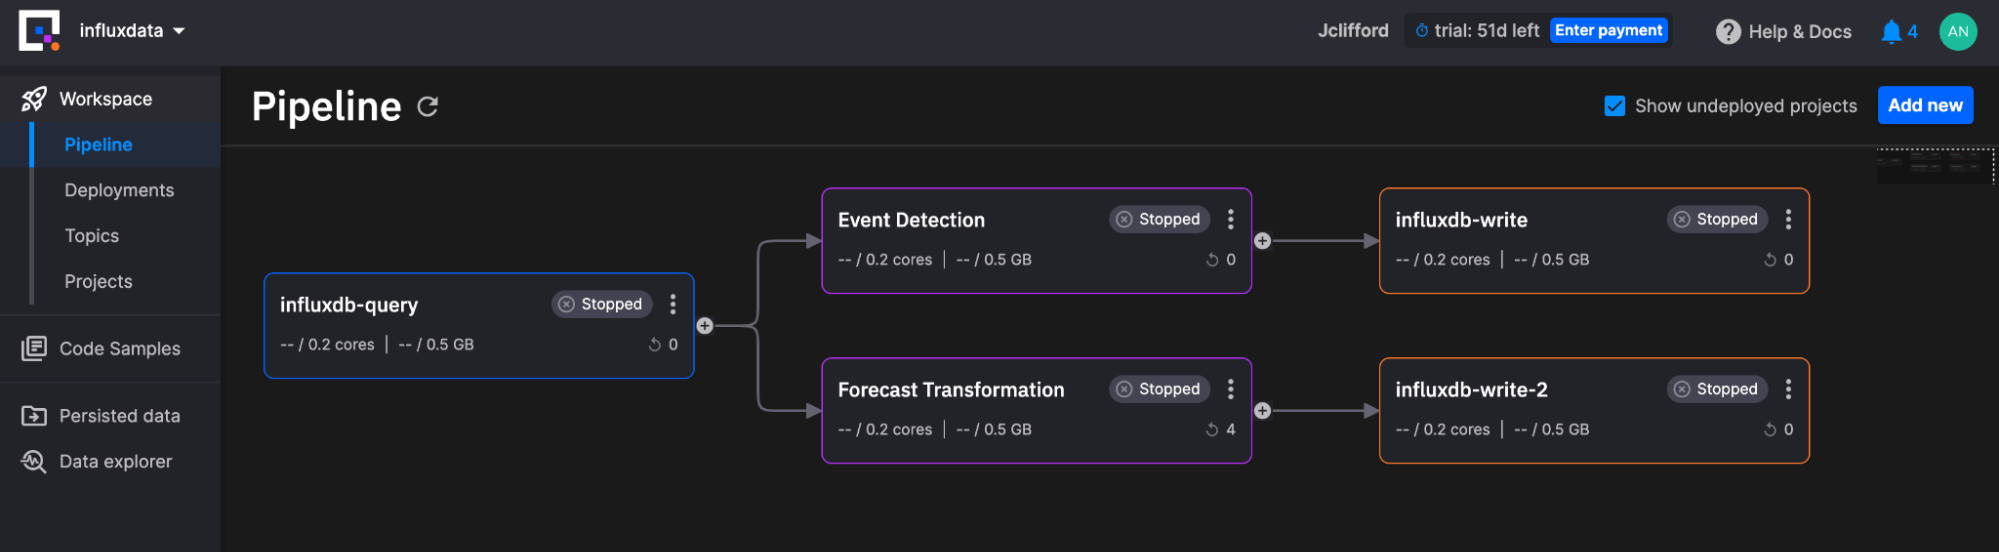
The Workspace Pipeline contains the following services:
-
A Source Project: This service project is responsible for querying InfluxDB Cloud with InfluxQL (query language) and converting the output to a Pandas DataFrame so that the Transformation block can consume it.
-
Two Transformations: These service projects are responsible for finding the anomalies within the data and generating predictions. They operate on the data from the source service in parallel.
- Event detection finds anomalies.
- Forecasting transformation generates forecasts.
-
Two Write Projects: These service projects are responsible for writing data back to InfluxDB Cloud with the InfluxDB 3.0 Python Client Library. There are two write instances because we’re writing to two separate InfluxDB Cloud instances. However, you could choose to write data back in parallel if you wanted to write all your data to the same instance.
What makes Quix so easy is that you can add a new service (services run on a user-defined schedule) or a new job (which runs once) by selecting from a variety of common services. They contain all of the boilerplate required to stream the data and pass the inputs into the correct outputs. Additionally you can easily stream Pandas DataFrames between projects, which removes any data conversion effort.
Source Project
This block runs every 60 seconds. It queries for the past 5 minutes of machine data with the following code with the InfluxDB 3.0 Python Client Library:
def get_data():

    # Query InfluxDB Cloud 3.0
    while run:
        try:
            query = "SHOW TAG VALUES WITH KEY = \"machineID\""
            table = client.query(query=query, language="influxql")
            machines = table["value"].to_pylist()

            for machine in machines:
                # this will end up loop when all data has been sent
                table = client.query(query=f"SELECT vibration, machineID FROM machine_data WHERE time >= now() - 5m AND machineID = '{machine}'", language="influxql")
                df = table.to_pandas()
                print(df)
                if df.empty:
                    break

                # If there are rows to write to the stream at this time
                stream_producer.timeseries.buffer.publish(df)
                sleep(int(os.environ["task_interval"]))
        except:
            print("query failed")
            sleep(int(os.environ["task_interval"]))
You configure the connection to InfluxDB Cloud
Event detection project
In this tutorial, we used Keras Autoencoders to create and train an anomaly detection model. Autoencoders are a type of artificial neural network used for learning efficient codings of input data. In anomaly detection, the Autoencoders train on normal data and learn to reproduce it as closely as possible. When presented with new data, the Autoencoders attempt to reconstruct it using the patterns learned from the normal data. If the reconstruction error (difference between the original input and the Autoencoder’s output) is significantly high, the model classifies the new data point as an anomaly, because it significantly deviates from the normal data.
We used this Jupyter notebook to train the data model before pushing it to Hugging Face. Next, we imported the model into the Quix Event Detection project. The model is a variable, so you can easily swap models in Hugging Face. This allows you to separate the model tuning and training workflow from your pipeline deployment.
from huggingface_hub import from_pretrained_keras

# Quix injects credentials automatically to the client.
# Alternatively, you can always pass an SDK token manually as an argument.
client = qx.QuixStreamingClient()

print("Opening input and output topics")
consumer_topic = client.get_topic_consumer(os.environ["input"], "default-consumer-group")
producer_topic = client.get_topic_producer(os.environ["output"])
model = from_pretrained_keras(os.environ["model"])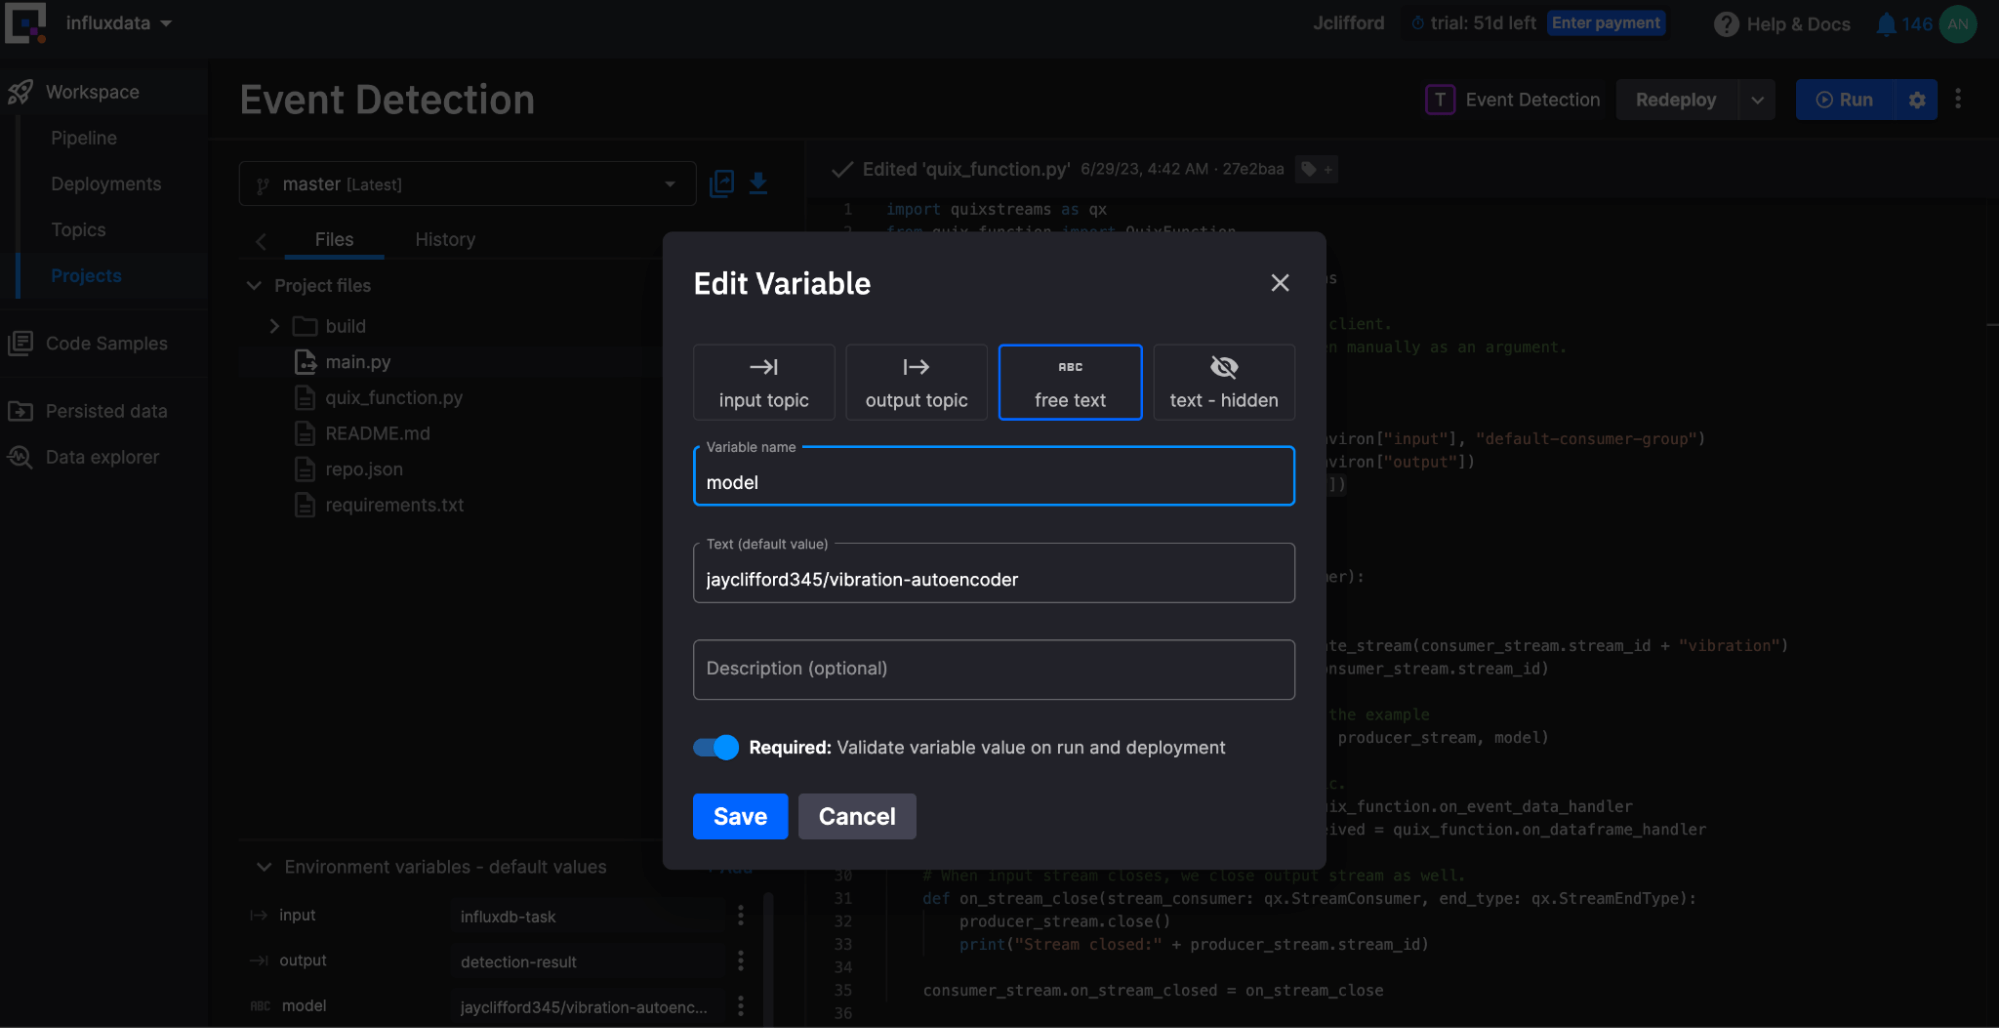
jayclifford345/vibration-autoencoder is selected.Forecasting transformation project
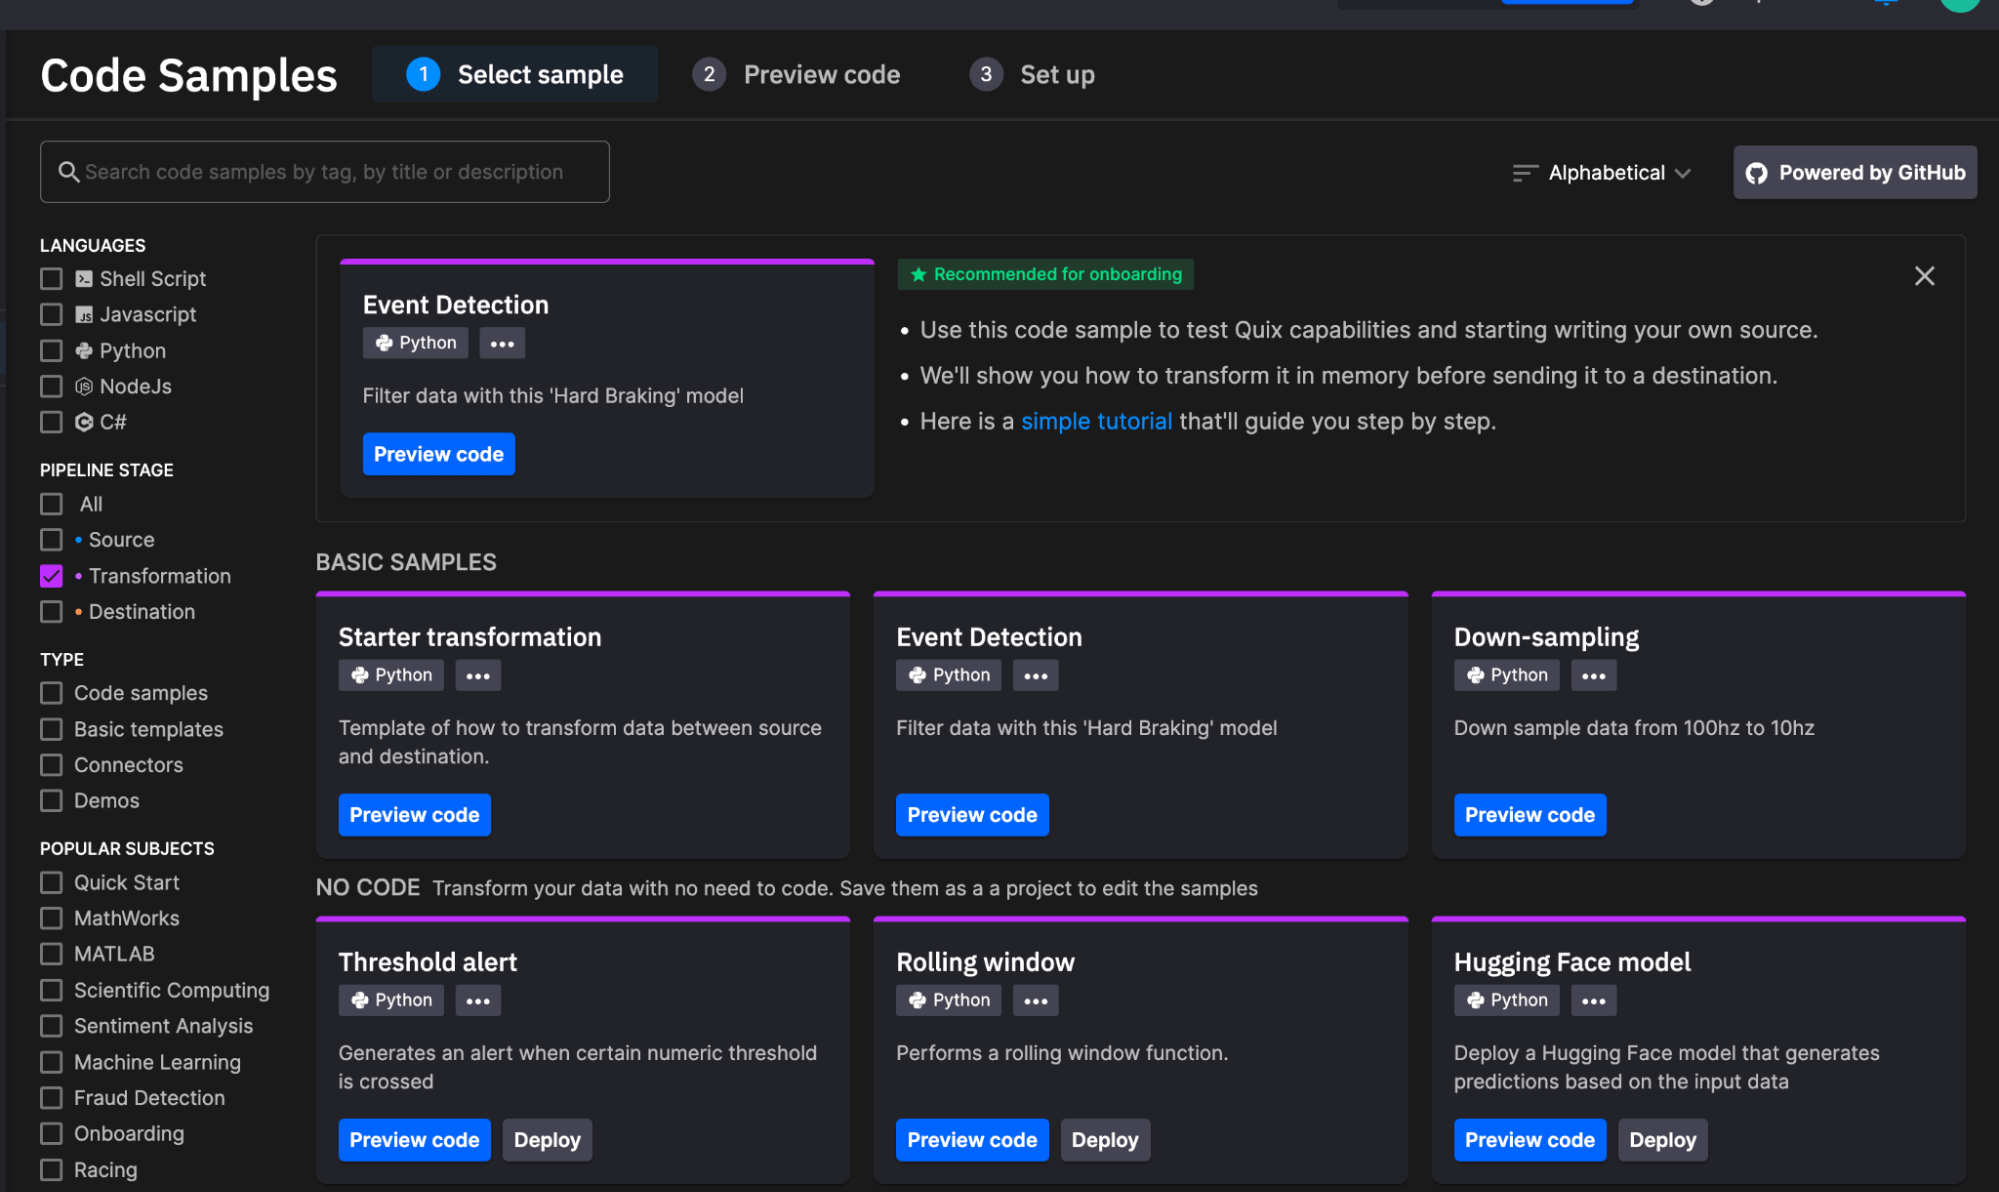
We built this project from the example Starter Transformation project from Code Samples. It uses Holt Winters from statsmodels to create a fast forecast.
df = df.set_index('timestamp')
    data = df.drop(columns=['iox::measurement', 'machineID'])
    fit = Holt(data,damped_trend=True,initialization_method="estimated").fit(optimized=True)
    fcast = fit.forecast(10).rename("Multiplicative damped trend")
    fcast = fcast.reset_index().rename(columns={'index': 'timestamp'})
Write Projects
The Write Projects (influxdb-write and influxdb-write-2) write the anomalies and forecasts to two separate InfluxDB instances. This design choice was arbitrary. It merely showcases this architecture as an option. The InfluxDB 3.0 Python Client LIbrary writes DataFrames to both instances.
import influxdb_client_3 as InfluxDBClient3

client = qx.QuixStreamingClient()

# get the topic consumer for a specific consumer group
topic_consumer = client.get_topic_consumer(topic_id_or_name = os.environ["input"],
                                           consumer_group = "empty-destination")

client = InfluxDBClient3.InfluxDBClient3(token=os.environ["INFLUX_TOKEN"],
                         host=os.environ["INFLUX_HOST"],
                         org=os.environ["INFLUX_ORG"],
                         database=os.environ["INFLUX_DATABASE"])

def on_dataframe_received_handler(stream_consumer: qx.StreamConsumer, df: pd.DataFrame):
    # do something with the data here
    df = df.rename(columns={'timestamp': 'time'})
    df = df.set_index('time')
    client.write(df, data_frame_measurement_name='mlresult', data_frame_tag_columns=['machineID'])
    print("Write successful")
Final thoughts
After writing our anomalies and forecasts into InfluxDB, we can use a tool like Grafana to visualize the data and create alerts to take action on it. For example, if we get too many anomalies we might decide we need to diagnose a problem in the system, replace a sensor or machine, assist in predictive maintenance or redesign a manufacturing process. Alerting on vibration forecasts could prevent manufacturing interruptions or optimize operations.
InfluxDB Cloud is a great tool for storing all of your time series data. It’s written on top of the Apache Ecosystem and leverages technologies like DataFusion, Arrow and Parquet to enable really efficient writes, storage and querying. It supports SQL queries, which allows developers to focus on building solutions on top of InfluxDB like this predictive maintenance pipeline. It also offers interoperability with a lot of other tools so you can leverage them for your specific predictive analytics needs. Get started with InfluxDB Cloud 3.0 here.
