Starting at InfluxDB - New Job, New Commute
By
Samantha Wang
updated December 14, 2025
Product
Use Cases
Developer
Navigate to:
I started at InfluxData as a Product Manager in mid-September 2019. A part of any new job is navigating your new commute. InfluxData’s San Francisco Headquarters is in a pretty busy part of the city where there are many different methods to commute for someone like me living across the bay in Oakland. I wanted to test out the shared bike program in the Bay Area, Bay Wheels (owned by Lyft), since I could use bikes in both San Francisco and in Oakland.
Retrieving Bay Wheels system data
Bay Wheels (owned by Lyft) shares its real-time bike station data to the public. I specifically used the station status information and station metadata for my dataset. Something to note is that the data is being reported every 5 minutes (ttl = 300s) as indicated in the end of the linked JSON files.
Configure Telegraf HTTP Input Plugin
My first InfluxDB setup was pulling local machine metrics on the InfluxDB 2.0 alpha instance by following the Getting Started guide (thanks Docs team!). In order to read the Bay Wheels system data into Telegraf, I used the Telegraf HTTP Input Plugin. I am historically not a developer, so the simplicity of the Telegraf input plugin made it really straightforward to use and begin collecting data. The main addition I had was the “interval = 300s” to read the data in every 5 minutes that was indicated in the Bay Wheels JSON file.
[[inputs.http]]
  interval = "300s"
  ## One or more URLs from which to read formatted metrics
  urls = [
    "https://gbfs.baywheels.com/gbfs/en/station_information.json"
  ]
  name_override = "baywheels_meta"
  tagexclude = ["url"]
  ## HTTP method
  method = "GET"
  ## Optional HTTP headers
  headers = {"User-Agent" = "Mozilla/5.0 (Macintosh; Intel Mac OS X 10_14_4) AppleWebKit/537.36 (KHTML, like Gecko) Chrome/74.0.3729.131 Safari/537.36"}
  ## Amount of time allowed to complete the HTTP request
  timeout = "5s"
  ## Data format to consume.
  ## Each data format has its own unique set of configuration options, read
  ## more about them here:
  ## https://github.com/influxdata/telegraf/blob/master/docs/DATA_FORMATS_INPUT.md
  data_format = "json"
  ## Query is a GJSON path that specifies a specific chunk of JSON to be
  ## parsed, if not specified the whole document will be parsed.
  ##
  ## GJSON query paths are described here:
  ##   https://github.com/tidwall/gjson#path-syntax
  json_query = "data.stations"
  ## Tag keys is an array of keys that should be added as tags.
  tag_keys = [
    "short_name",
    "station_id",
    "name",
    "region_id",
    "lat",
    "lon"
  ]
  ## String fields is an array of keys that should be added as string fields.
  json_string_fields = ["rental_url","external_id"]
  ## Name key is the key to use as the measurement name.
  json_name_key = ""
  ## Time key is the key containing the time that should be used to create the
  ## metric.
  json_time_key = ""
  ## Time format is the time layout that should be used to interprete the json_time_key.
  ## The time must be `unix`, `unix_ms`, `unix_us`, `unix_ns`, or a time in the
  ## "reference time".  To define a different format, arrange the values from
  ## the "reference time" in the example to match the format you will be
  ## using.  For more information on the "reference time", visit
  ## https://golang.org/pkg/time/#Time.Format
  ##   ex: json_time_format = "Mon Jan 2 15:04:05 -0700 MST 2006"
  ##       json_time_format = "2006-01-02T15:04:05Z07:00"
  ##       json_time_format = "01/02/2006 15:04:05"
  ##       json_time_format = "unix"
  ##       json_time_format = "unix_ms"
  json_time_format = ""
  ## Timezone allows you to provide an override for timestamps that
  ## don't already include an offset
  ## e.g. 04/06/2016 12:41:45
  ##
  ## Default: "" which renders UTC
  ## Options are as follows:
  ##   1. Local               -- interpret based on machine localtime
  ##   2. "America/New_York"  -- Unix TZ values like those found in https://en.wikipedia.org/wiki/List_of_tz_database_time_zones
  ##   3. UTC                 -- or blank/unspecified, will return timestamp in UTC
  json_timezone = ""
Data enrichment using Tasks & Flux
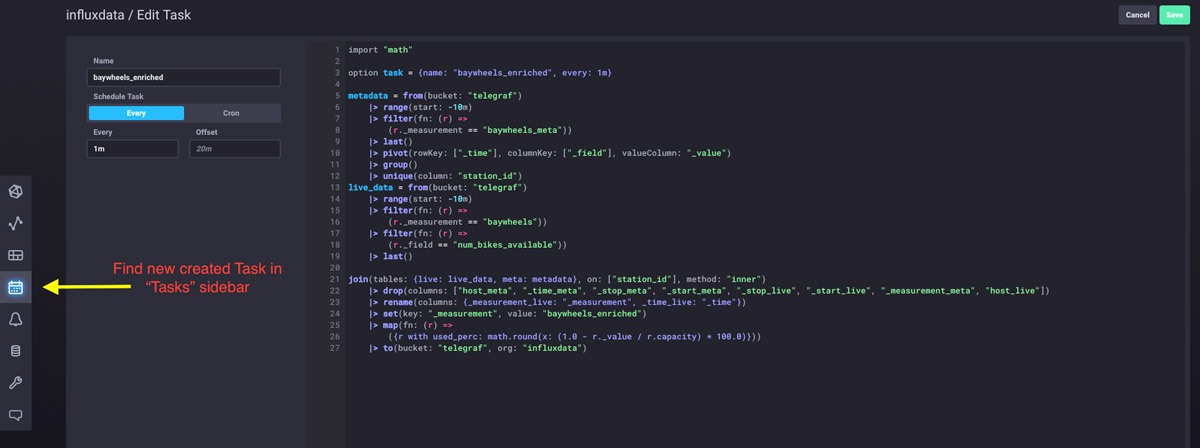
I ideally wanted to chart the station information with the actual station names and filter/query by regions and cities. In order to do so, I needed to enrich the data by joining the two measurements I created in InfluxDB (from station status and metadata). With Flux, I could also calculate a new usage metric to see what percentage of bikes at a station are currently in use. I was able to get a task up and running rather quickly with my Flux query by creating a task through Data Explorer. Tasks are Flux scripts that run periodically to modify or analyze streams of data and output them to a new data source in my case, taking the reported data from my two Bay Wheels tables and joining them every minute to a new “baywheels_enriched” source.
An InfluxDB task can be easily created with Flux through the Data Explorer:
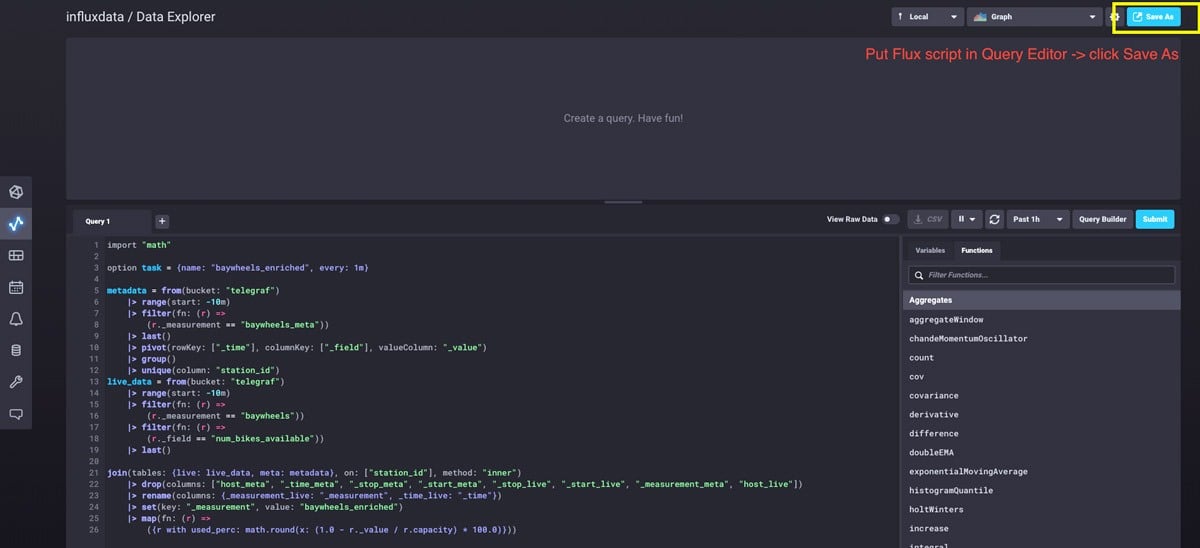

Flux Query for “baywheels_enriched” task:
import "math"
metadata = from(bucket: "telegraf")
|> range(start: -10m)
|> filter(fn: (r) =>
(r._measurement == "baywheels_meta"))
|> last()
|> pivot(rowKey: ["_time"], columnKey: ["_field"], valueColumn: "_value")
|> group()
|> unique(column: "station_id")
live_data = from(bucket: "telegraf")
|> range(start: -10m)
|> filter(fn: (r) =>
(r._measurement == "baywheels"))
|> filter(fn: (r) =>
(r._field == "num_bikes_available"))
|> last()
join(tables: {live: live_data, meta: metadata}, on: ["station_id"], method: "inner")
|> drop(columns: ["host_meta", "_time_meta", "_stop_meta", "_start_meta", "_stop_live", "_start_live", "_measurement_meta", "host_live"])
|> rename(columns: {_measurement_live: "_measurement", _time_live: "_time"})
|> set(key: "_measurement", value: "baywheels_enriched")
|> map(fn: (r) =>
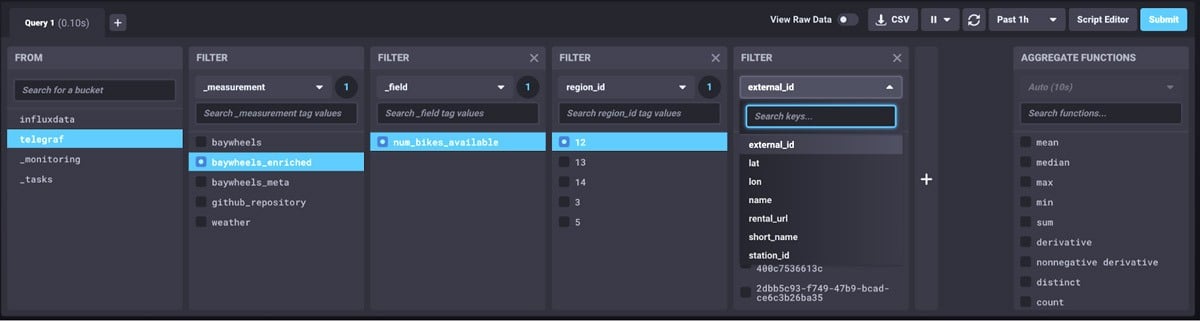
({r with used_perc: math.round(x: (1.0 - r._value / r.capacity) * 100.0)}))Now with my new “baywheels_enriched” table, I can filter and query based off the Bay Wheels station metadata. I can search directly by station name, location, or in the example below select all stations in a particular region of the Bay Area.
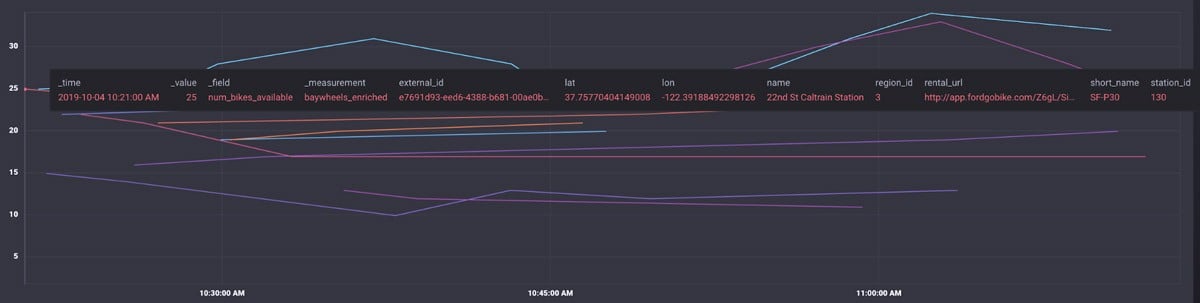
In my visualizations, I can now see all the station information from both the station status and metadata tables.
Setting up alerting & monitoring
My initial idea of getting bike information into InfluxDB was to set up an alerting system when stations I regularly would get bikes from were running low. I set up Slack as an endpoint for the notifications so I would get a Slack message whenever one of these stations were running low and out of bikes. I can set up thresholds for critical, warning, info, and okay and determine when to get messaged. Here's a great blog by Katy that shows you how to step-by-step on how to set up a check & alert in Cloud 2.0. I chose to get a Slack message at any of these checks (example below show the 19th Street Station at good levels around 5 pm).
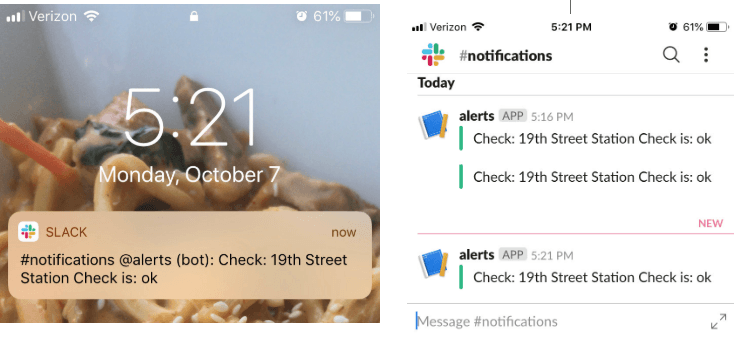
So next time the 19th Street BART Station is running low on bikes, I'll know to run out of the office as soon as possible to snag the last one (or know to head to a different station ) :P
In case you're wondering why I joined InfluxData...
Previous to joining, I spent most of my career in telecommunications and mobile analytics at major corporations. I was really intrigued by InfluxData because of how they were leading the time series database and open source space. I knew this role would be a tremendous challenge technically and a place I could rapidly grow as a Product Manager. InfluxData is also the first time I’ll be working for a company with less than 40,000 employees (InfluxData is 0.5% of that!) so I knew it would provide an exciting environment.
