Table of Contents
This post was written by Ravil Nugmanov, Software Architect at One-Way Automation, a startup located in Edmonton, Canada.
This article describes an end-to-end solution built with open source components InfluxDB and Grafana and the ogamma Visual Logger for OPC, to collect industrial process control data, analyze it in streaming mode, and visualize it in a dashboard.
The problem
For this demo, we are using a hypothetical industrial pump which publishes the following values via an OPC UA Server:
- Input pressure
- Output pressure
- Temperature
- Power status
In a dashboard, we would like to visualize the following information:
- The current values of these variables
- The historical values in a graph
- Calculate the difference between the average values of input and output pressure and display the result in the dashboard
- Periodically check the pressure difference calculated from the data listed above and generate notifications if it is out of the desired range, and display this in the dashboard.
The solution
The diagram of the proposed solution for this problem is shown below:
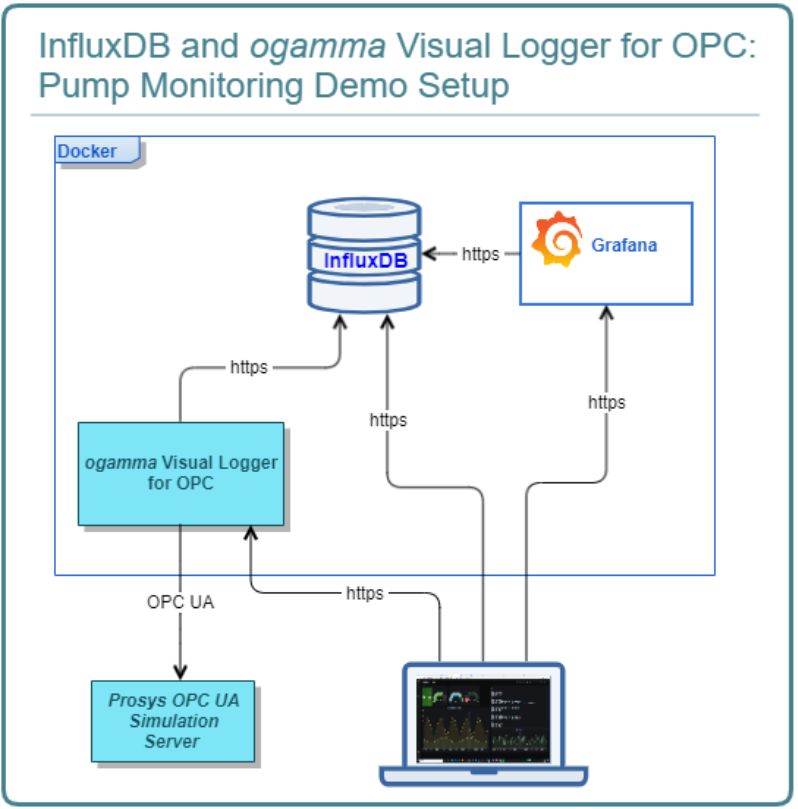
The following sections describe all the details about the components used and how they interact.
OPC UA data source
As a data source providing values for the monitored pump, we are using Prosys OPC UA Simulation Server. It differs from other available simulation servers in that you can build custom OPC UA address space up to your specific requirements, and values for variables can be automatically generated according to selected patterns like random, sinusoid, sawtooth, and so on.
Time series database and stream analytics engine
As a time series database, InfluxDB was chosen because it can store data in a highly efficient way, and it supports real-time stream analytics. You can analyze data using Flux scripts that meet your requirements and provide results on the fly.
Moving data from an OPC UA server to InfluxDB
To collect data from the OPC UA Servers and push it into the InfluxDB time series database, the ogamma Visual Logger for OPC is used. It can be deployed in Windows, Linux or Docker, has a web-based configuration GUI, is high-performant, and does not require much hardware resources (written in C++).
Visualization of information in dashboards
For this demonstration, another open-source project, Grafana, is used. Alternatively, it is also possible to build dashboards in InfluxDB.
The end result: a screenshot of the dashboard. 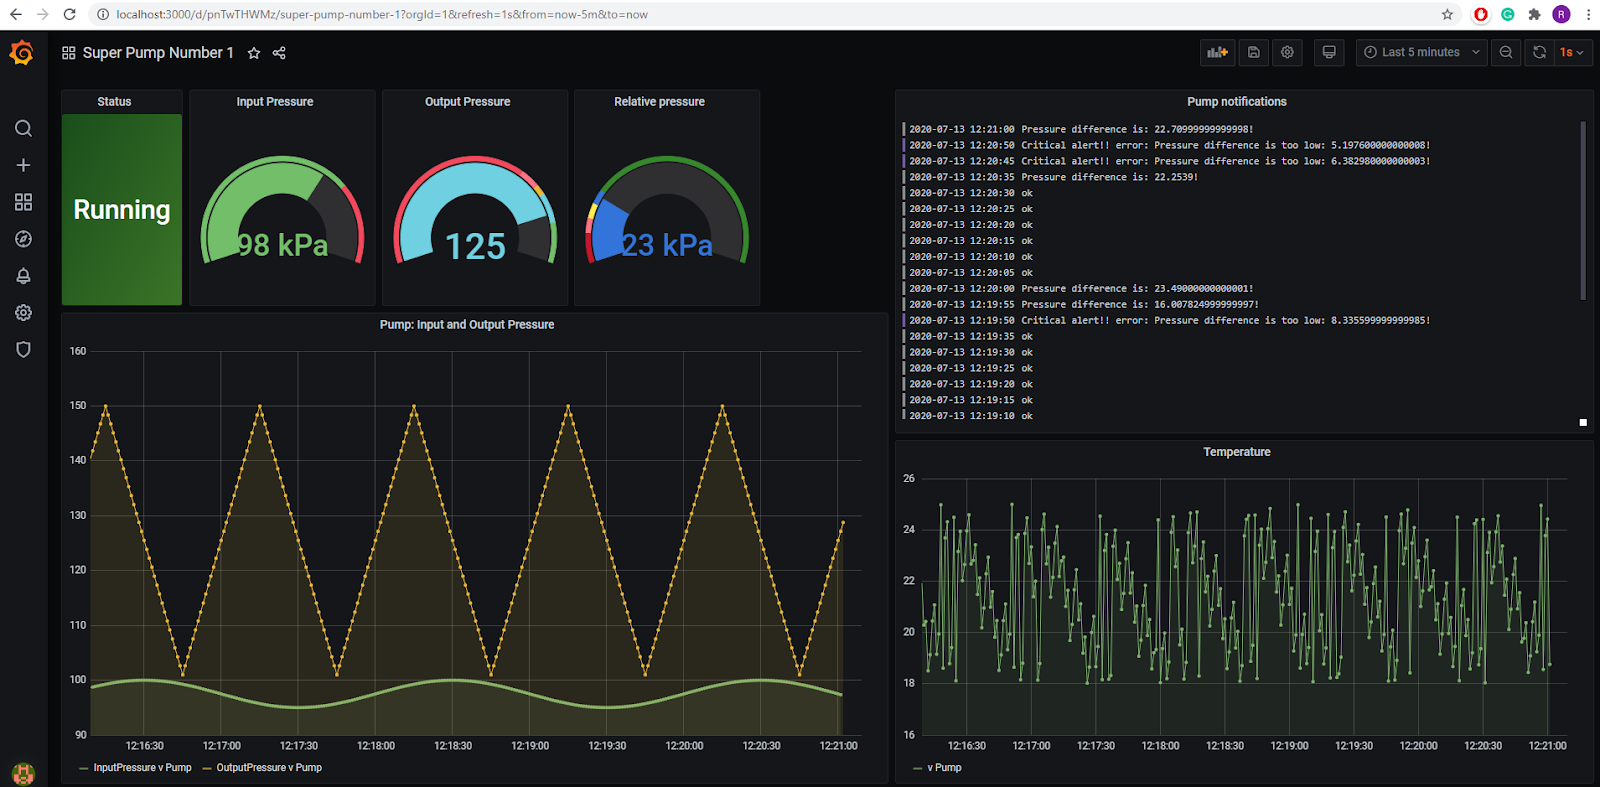
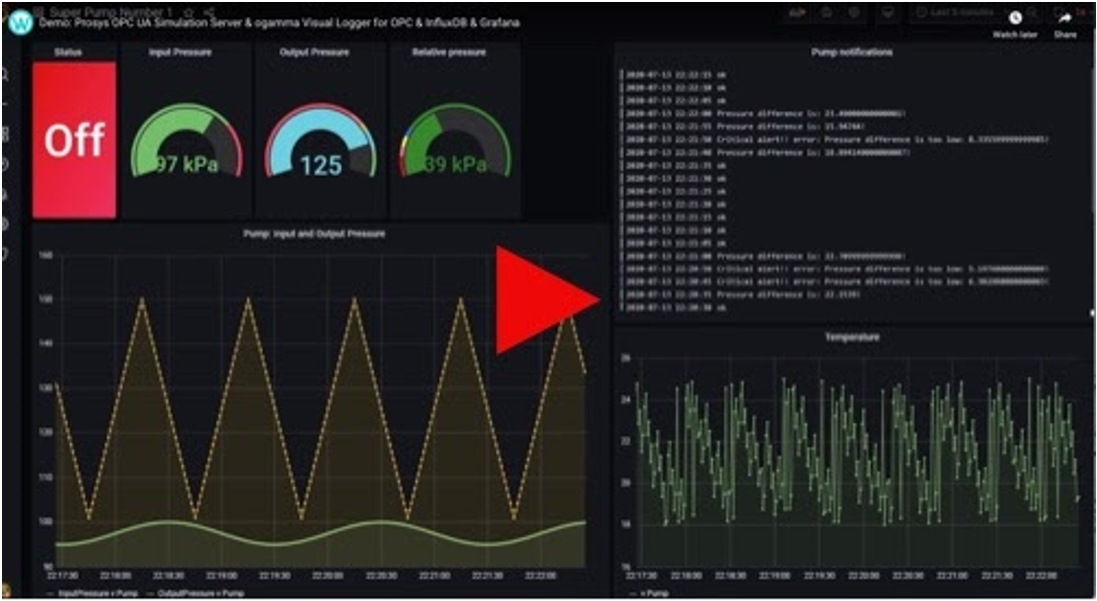
The end result: screen recording.
Technical details
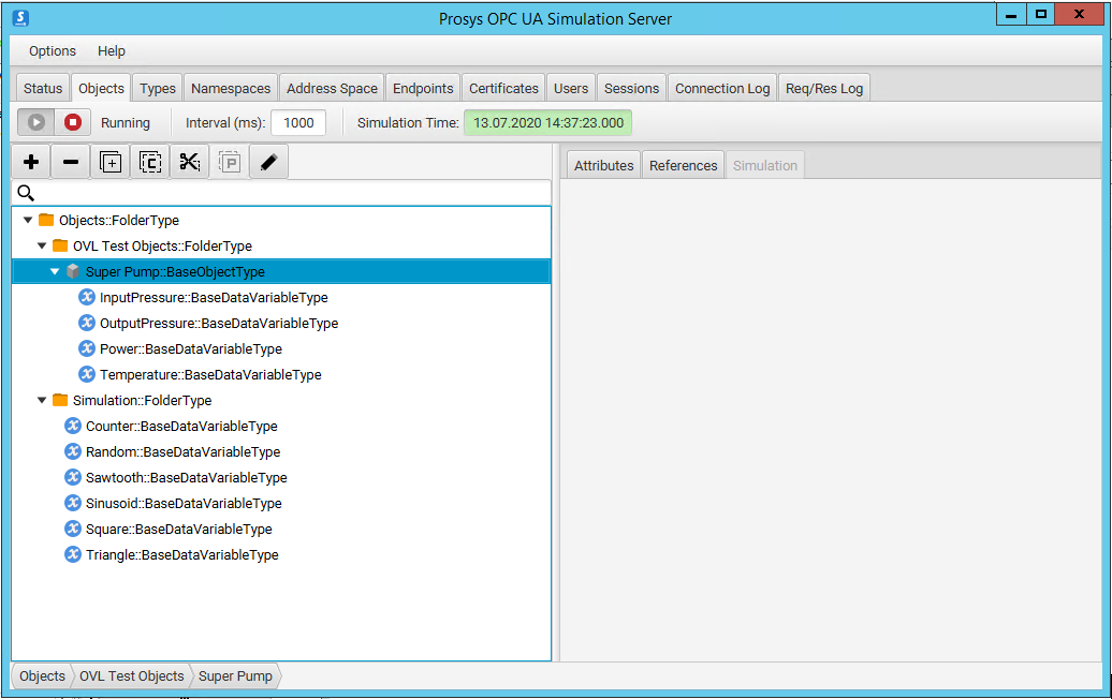
Configuring the Prosys OPC UA Simulation server
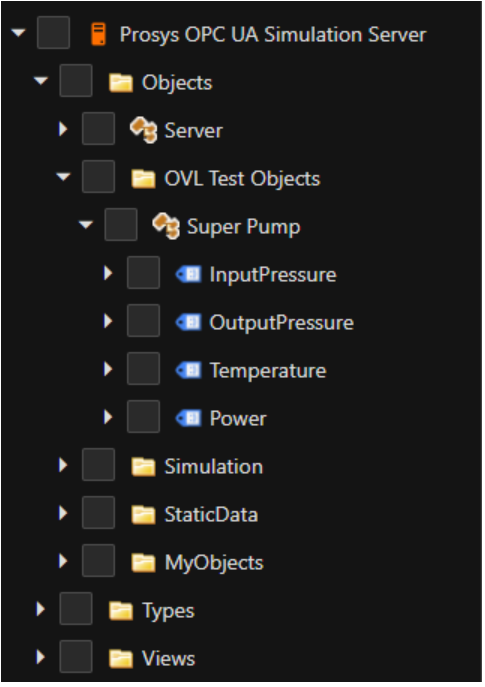
An instance of the Prosys OPC UA Simulation server is installed on a Windows Virtual Machine. Under the Objects folder, objects and variables are created:
From the OPC UA Client perspective, the address space looks like this:
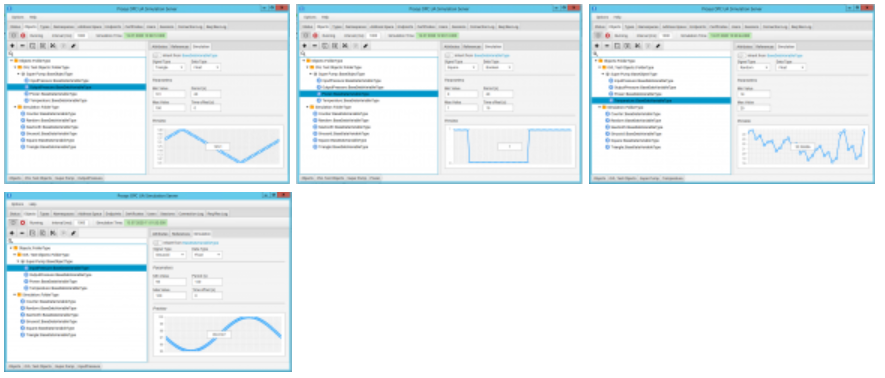
The variable configuration settings are captured in the following below screenshots:
Configuring the ogamma Visual Logger for OPC to connect to the server in secured mode
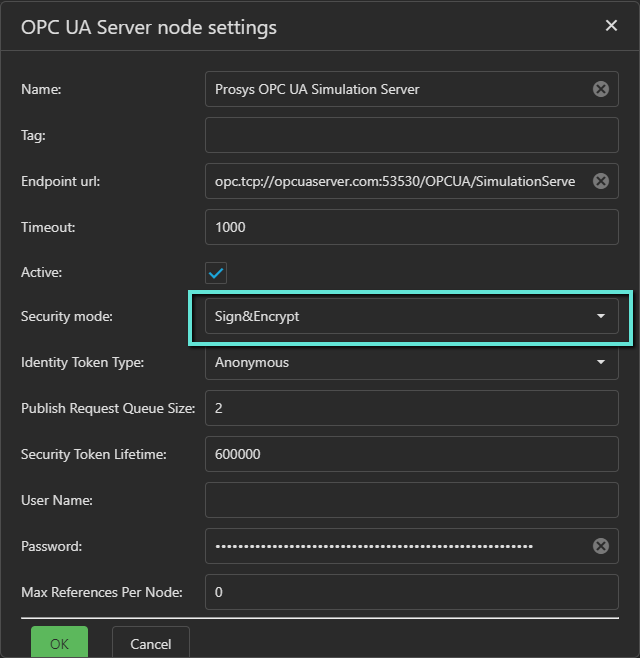
First, a new OPC UA Server node should be created in the Address Space panel. Note that the Security mode is set to Sign&Encrypt. Some additional steps to configure trust on the server side will be required.
After adding the OPC UA Server node, the initial attempt to connect will fail. On the server-side, the ogamma Visual Logger’s OPC UA application instance certificate will be saved in the rejected certificates folder. From the Prosys OPC UA Simulation Server GUI, it needs to be marked as trusted. This can be done after switching to the Expert Mode (menu Options / Switch to Expert Mode), via the Certificates tab page:
Just trusting the ogamma Visual Logger instance certificate is not enough though. You will need to:
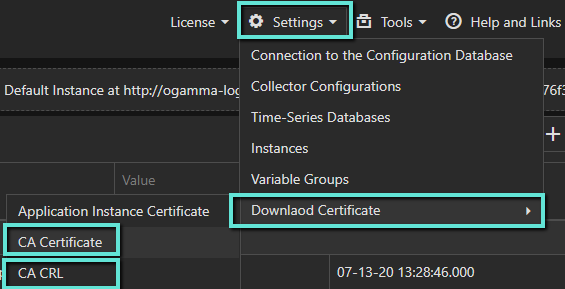
- download its CA certificate (via menu Settings / Download Certificates / CA Certificate) and save it in the server-side into folder C:\Users\Administrator\.prosysopc\prosys-opc-ua-simulation-server\PKI\CA\certs,
- download CRL (via menu Settings / Download Certificates / CA CRL) and save it in the server-side into folder C:\Users\Administrator\.prosysopc\prosys-opc-ua-simulation-server\PKI\CA\crl.
Note: The actual folder where the certificates are located can be different in your installation. Therefore, open the folder using Prosys OPC UA Simulation Server GUI, via menu Certificates / Open in file Explorer.
When the certificate trust configuration is correct, the ogamma Visual Logger for OPC should be able to connect to the server. To verify this, try to browse it by expanding nodes in the Address Space panel.
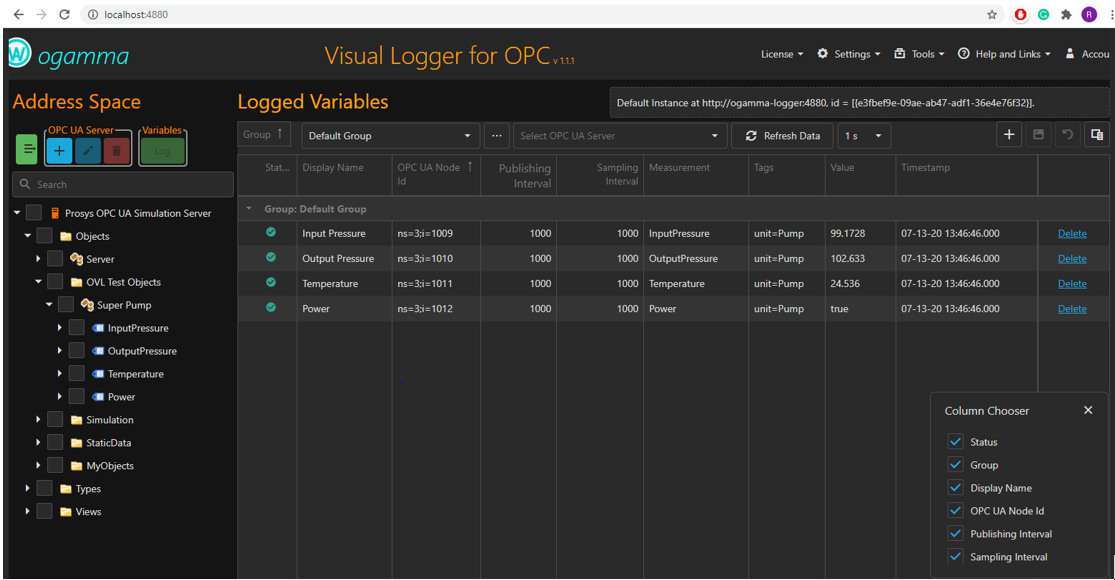
Configuring the ogamma Visual Logger for OPC to log desired variables
Select nodes from the Address Space panel and add them to the Logged Variables table by clicking on the button Log. If everything is correct, in the Status column an icon with a checkmark should be displayed.
Configuring the ogamma Visual Logger for OPC to connect to the InfluxDB instance
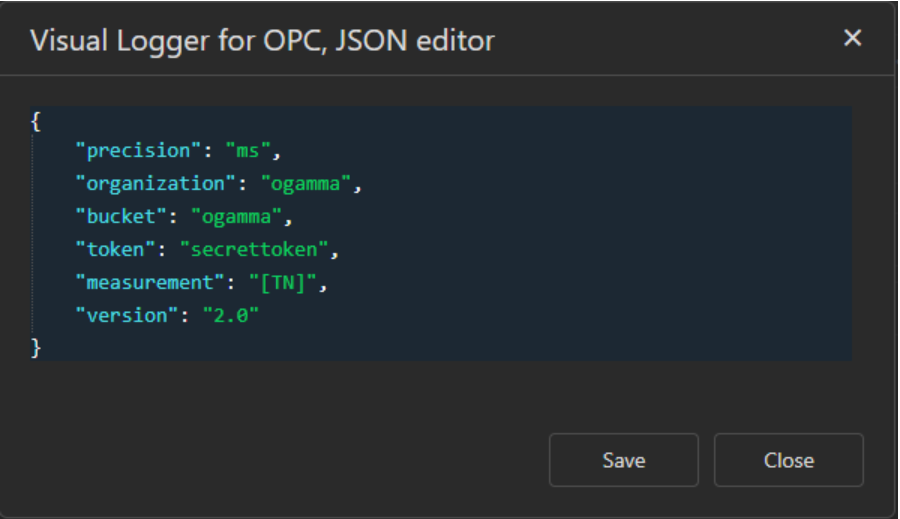
First, add a new record in the time series database list (menu Settings / Time-Series Databases). Set value of the field Type to InfluxDB 2.0, and modify fields Host, Port, Use Secure Mode, and JSON. In the last field (JSON) set option “measurement” to “[TN]”, and make sure that options organization, bucket, token are set correctly.
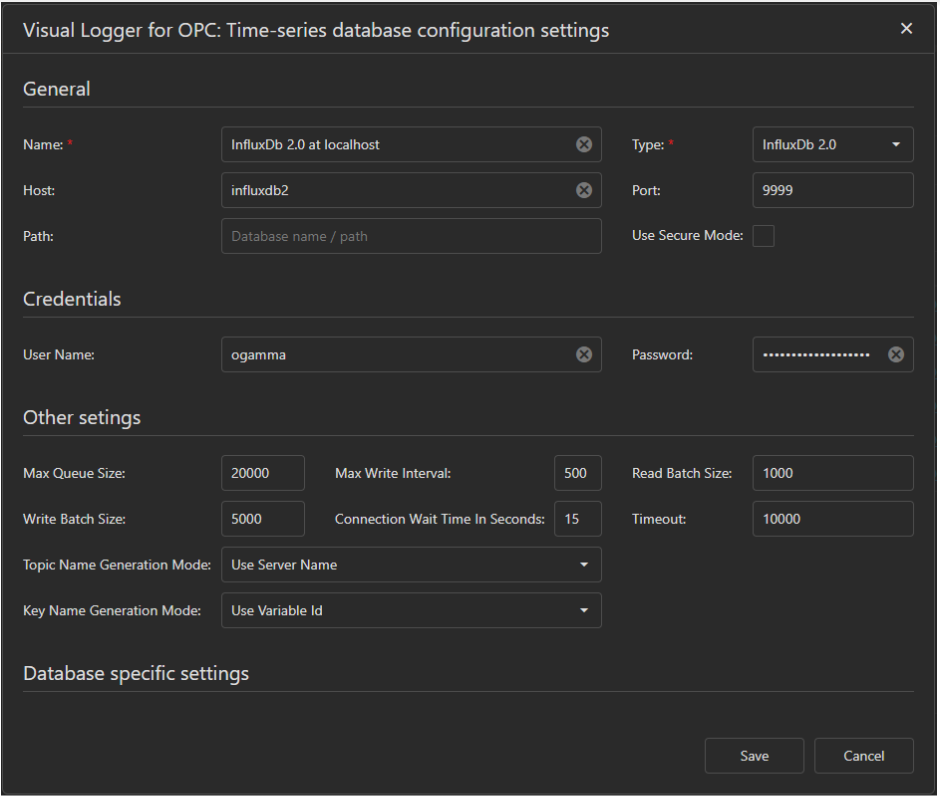
Verify that connection settings are correct by clicking on the button Test Connection. Now the real-time data values are ingested into the InfluxDB database.
Analysis of variable values in streaming mode and generating notifications
For stream analysis, the InfluxDB Tasks feature is used. Create this by writing a Flux script that will calculate the mean of the values for variables for the Input Pressure and Output Pressure and their difference every 5 seconds. Then based on the value of this difference, a notification message is generated. If the difference is below the specified thread, the message level is set to critical, otherwise, set to warn, info, or ok, depending on value. Then notification is written into special system bucket _monitoring, with _measurement set to statuses.
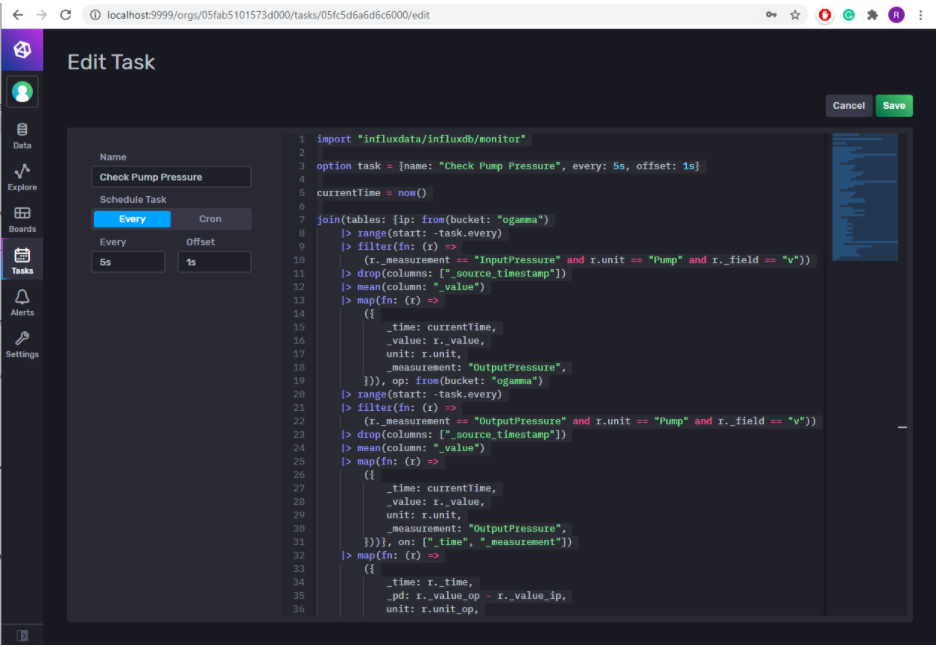
Full Flux script code is quoted below:
import "influxdata/influxdb/monitor"

option task = {name: "Check Pump Pressure", every: 5s, offset: 1s}

currentTime = now()

join(tables: {ip: from(bucket: "ogamma")
	|> range(start: -task.every)
	|> filter(fn: (r) =>
		(r._measurement == "InputPressure" and r.unit == "Pump" and r._field == "v"))
	|> drop(columns: ["_source_timestamp"])
	|> mean(column: "_value")
	|> map(fn: (r) =>
		({
			_time: currentTime,
			_value: r._value,
			unit: r.unit,
			_measurement: "OutputPressure",
		})), op: from(bucket: "ogamma")
	|> range(start: -task.every)
	|> filter(fn: (r) =>
		(r._measurement == "OutputPressure" and r.unit == "Pump" and r._field == "v"))
	|> drop(columns: ["_source_timestamp"])
	|> mean(column: "_value")
	|> map(fn: (r) =>
		({
			_time: currentTime,
			_value: r._value,
			unit: r.unit,
			_measurement: "OutputPressure",
		}))}, on: ["_time", "_measurement"])
	|> map(fn: (r) =>
		({
			_time: r._time,
			_pd: r._value_op - r._value_ip,
			unit: r.unit_op,
			_measurement: "OutputPressure",
		}))
	|> monitor.check(
		crit: (r) =>
			(r._pd < 10.0),
		warn: (r) =>
			(r._pd < 15.0),
		info: (r) =>
			(r._pd < 25.0),
		ok: (r) =>
			(r._pd >= 25.0),
		messageFn: (r) =>
			(if r._pd < 10.0 then "Critical alert!! error: Pressure difference is too low: ${string(v: r._pd)}!" else if r._pd < 15.0 then "Warning! Pressure difference is low: ${string(v: r._pd)}!" else if r._pd < 25.0 then "Pressure difference is: ${string(v: r._pd)}!" else "ok"),
		data: {
			_check_name: "Pressure difference check",
			_check_id: "pres_diff",
			_type: "threshold",
			tags: {unit: "Pump"},
			_measurement: "statuses",
		},
	)
Visualization of the real-time and stream-processed data in Grafana
Grafana ships with a feature-rich data source plugin for InfluxDB. The plugin includes a custom query editor and supports annotations and query templates. To add InfluxDB as a data source in Grafana:
- Open the side menu by clicking the Grafana icon in the top header
- In the side menu under the Dashboards link, you should find a link named Data Sources
- Click the + Add data source button in the top header
- Select InfluxDB from the Type dropdown
- Make sure you select Flux from the Query Language list
Each panel queries data from InfluxDB with the use of Flux scripts. Description of each panel and the corresponding Flux script code quotes are below.
Status
This panel displays the current status of the pump, based on the value of the boolean type variable Power.
from(bucket: "ogamma")
  |> range(start: v.timeRangeStart, stop:v.timeRangeStop)
  |> filter(fn: (r) =>
    r._measurement == "Power" and
    r._field == "v"
  )
  |> last()
>
Input pressure
In this panel, the current value of the Input Pressure variable is displayed.
from(bucket: "ogamma")
  |> range(start: v.timeRangeStart, stop:v.timeRangeStop)
  |> filter(fn: (r) =>
    r._measurement == "InputPressure" and
    r._field == "v"
)
Output pressure
In this panel, the current value of the Output Pressure variable is displayed.
from(bucket: "ogamma")
  |> range(start: v.timeRangeStart, stop:v.timeRangeStop)
  |> filter(fn: (r) =>
    r._measurement == "OutputPressure" and
    r._field == "v"
)
Relative pressure
In this panel, the current value of the calculated difference between Output and Input Pressure is displayed. Note that for each input and output pressure variables, first the mean value is calculated, and therefore the difference is not equal to the difference between current values.
from(bucket: "_monitoring")
  |> range(start: -10s, stop:now())
  |> filter(fn: (r) =>
    r._measurement == "statuses" and
    r.unit == "Pump"
  )
  |> drop (columns:["_source_timestamp", "_check_id", "_check_name", "_start", "_stop"])
Pump: input and output pressure
In this panel, historical values for pressure variables for the latest display interval are displayed.
from(bucket: "ogamma")
  |> range(start: v.timeRangeStart, stop:v.timeRangeStop)
  |> filter(fn: (r) =>
    r._measurement == "InputPressure" and
    r._field == "v"
)
Pump notifications
In this panel, notifications generated as a result of the processing of streamed values are displayed.
from(bucket: "_monitoring")
  |> range(start: v.timeRangeStart, stop:v.timeRangeStop)
  |> filter(fn: (r) =>
    r._measurement == "statuses" and
    r.unit == "Pump"
  )
  |> drop(columns: ["_source_timestamp"])
Temperature
In this panel, the historical values of the Temperature variable are displayed.
from(bucket: "ogamma")
  |> range(start: v.timeRangeStart, stop:v.timeRangeStop)
  |> filter(fn: (r) =>
    r._measurement == "Temperature" and
    r._field == "v"
  )
The end result
And in the end, we get this working dashboard in Grafana!

