Table of Contents
Last week we released Telegraf 1.15 with new plugins for network monitoring and a large number of processors to help with your data ingestion. All packages were written in Go 1.14.5.
This all couldn’t have been done without the 50+ community members who contributed to writing plugins, fixing bugs, reviewing code, and everything else to help make Telegraf better!
Here’s a quick look into new plugins and features we launched in Telegraf 1.15.

How to run Starlark with Telegraf
Our new Starlark Processor Plugin is an exciting new processor that gives Telegraf users the flexibility of performing various operations in Telegraf using the Starlark language that’s similar to Python.
We’re really excited about this plugin since we have had a lot of requests for math capabilities within Telegraf. With this plugin, you now have access to a vast range of arithmetic, logic and string functions in Telegraf. Using the Starlark processor, you can perform real-time aggregates (min, max) on your data in Telegraf before sending it on to InfluxDB. This can now all be done through configuration.
Here’s how it works: the Telegraf Starlark Processor calls a Starlark function for each matched metric, allowing for custom programmatic metric processing. The Starlark language is a dialect of Python, and will be familiar to those who have Python experience.
Here’s an example for IoT that was requested by a community member who wanted to calculate power locally from the current and voltage fields read from the Telegraf Modbus Input Plugin. The Starlark function within the processor, to multiply two Telegraf metrics, would be as follows:
[[processors.starlark]]
  # Reads the Starlark script embedded
  source = '''
def apply(metric):
    # Get the field called current and put into variable I
    I = metric.fields['current']
    # Get the field called voltage and put into variable V
    V = metric.fields['voltage']
    # Create a new field, power, which is I times V
    metric.fields['power'] = I * V
    # Return power as part of your Telegraf metrics stream
    return metric
There is a LOT more we can say about Starlark, so if being able to do math in Telegraf is of interest, check out this blog on how to use Starlark in Telegraf.
Ensure that Telegraf always sends a field
The new Defaults Processor Plugin lets you ensure that certain fields will always exist with a specified default value on your metric(s). This is also known as “gap fill”, and solves the problem of missing data, which could arise from unplanned downtime, system maintenance, network outages, sensor malfunctions, or other reasons.
For example, you can ensure a status_code field with N/A is inserted in the metric by default when one is not set in the metric. To set this up, put this into your Telegraf configuration file:
[[processors.defaults]]
 [processors.defaults.fields]
 status_code = "N/A"
You’ll always see that the field status_code is in your metrics, even if it wasn’t originally captured by a Telegraf input plugin. Here is an example of the differences of your line protocol output, first without the processor plugin, then later with the processor plugin:
diff
- lb,http_method=GET cache_status=HIT,latency=230
+ lb,http_method=GET cache_status=HIT,latency=230,status_code="N/A"
For numerical values, you can provide a “functional null” value as the default which can easily be excluded when performing analytic queries on the data.
Big thanks to Jeff Registre for the contribution!
How to run external programs with Telegraf
To supplement the Execd Input Plugin from 1.14, we have released an Execd Output and Processor Plugin in Telegraf 1.15. Similar in concept to Go’s execd command, all the execd plugins are built to run an external program in any programming language including Node, Python, Java, Ruby, shell script, Golang and Rust that can be run by the server where Telegraf is running on Linux, Windows, or Mac systems.
How the Execd plugins work: the external program runs as a daemon and continues to stay running. This differs from the existing Telegraf Exec plugin that runs an external program once and stops. There is also a Go Shim that will make it trivial to extract an internal input, processor, or output plugin from the main Telegraf repo out to a standalone repo.
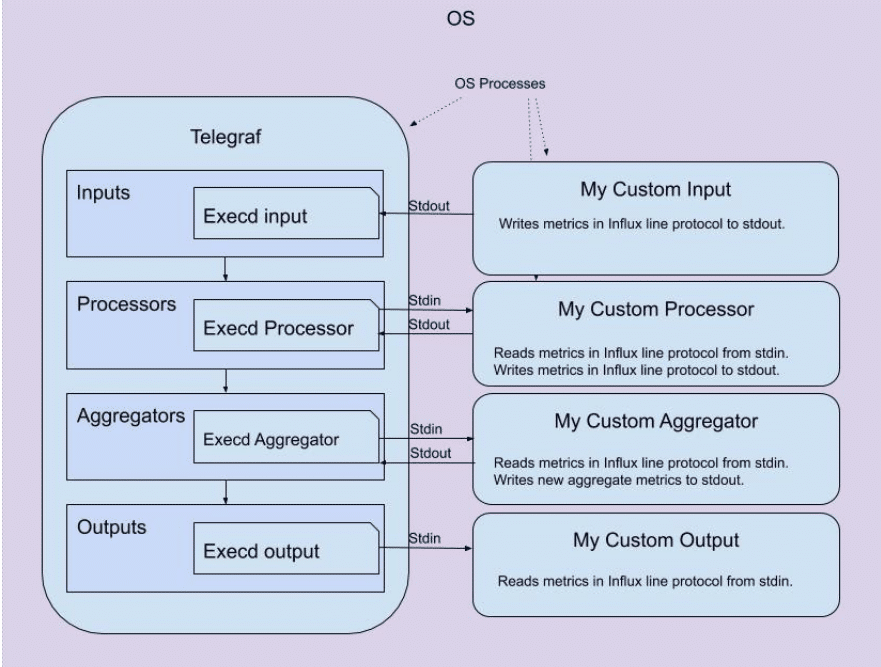 <figcaption> How external plugins interact with their respective execd plugin</figcaption>
The great thing about the execd plugins is the amount of flexibility they bring to Telegraf. To see what I mean, check out the initial list of external plugins you can use with execd.
If you wish to contribute to our external plugins, feel free to follow the contributing guide steps, and submit a PR. There will be more to come with external plugins, but we want you to try out the plugins with execd and start building your own!
Set up your Telegraf paths for your Go environment
Suppose you need to tell Telegraf about the paths in your Go environment, so that execd can find the Go programs it needs. To do that, you’d use the Filepath Processor Plugin, which maps certain Go functions from the filepath package “path/filepath” onto tag and field values.

The implemented functions are:
- Base (accessible through
[[processors.filepath.basename]]) - Rel (accessible through
[[processors.filepath.basename]]) - Dir (accessible through
[[processors.filepath.dir]]) - Clean (accessible through
[[processors.filepath.clean]]) - ToSlash (accessible through
[[processors.filepath.toslash]])
Shoutout to Andrés Álvarez for building this plugin!
Include SNMP network interface names in Telegraf metrics
When collecting network performance observability metrics, it’s very helpful to include the network interface name, such as en0, in your metrics stream. To do that, use the Telegraf Network Interface Name Processor Plugin. The ifname processor plugin looks up network interface names using SNMP. In your processor configuration, you would set the name of the tag that contains the interface number that you’re looking up and the output destination for the service name. In this example, the ifIndex = 2 will look up and return the field ifname of eth0, if you have this in your Telegraf configuration file:
[[processors.ifname]]
 tag = "ifIndex"
 dest = "ifName"
Map port numbers to service names in Telegraf metrics
When looking at network monitoring metrics, it’s helpful to resolve TCP and UDP port numbers to well-known service names. For instance, it’s not all that helpful to know that you have a lot of network traffic on port 3306 what service is driving all that traffic? But, if you can automatically resolve port 3306 to MySQL, that gives you the information you need to zero in on what’s causing the traffic spike.
To map port numbers to their registered service names in line protocol, use the new Telegraf Port Name Lookup Processor Plugin. Similar to the ifname processor, you will need to configure the tag containing the port number and the output destination for the service name. In this example, port 80 corresponds to an HTTP port and would return http in the service field.
[[processors.port_name]]
 ## Name of tag holding the port number
 # tag = "port"
 ## Name of output tag where service name will be added
 # dest = "service"
 ## Default tcp or udp
 # default_protocol = "tcp"
Resolve IP addresses to domain names in Telegraf metrics
If you’re looking at network observability telemetry with IP addresses, it’s helpful to resolve them into domain names. To do this, use the Telegraf Reverse DNS Processor Plugin. This processor does a reverse DNS lookup on tags (or fields) that contain IP addresses. Like the other lookup processors in this release, you would configure the tag or the field that contains the IP address that you wish to lookup and the output location for the DNS name.
How to monitor NGINX with Telegraf
NGINX is a popular open source web server, reverse proxy, cache, load balancer, and media streaming server. For this reason, Telegraf has several plugins to choose from to monitor NGINX:
- NGINX (open source version of NGINX)
- NGINX Plus (commercial version of NGINX)
- NGINX Plus API
- NGINX Upstream Check
- NGINX VTS (virtual host traffic status)

With Telegraf 1.15, we’re adding another set of capabilities for NGINX observability with the NGINX Stream STS (Server Traffic Status) Input Plugin: This plugin gathers NGINX status using an external virtual host traffic status module, similar to this:
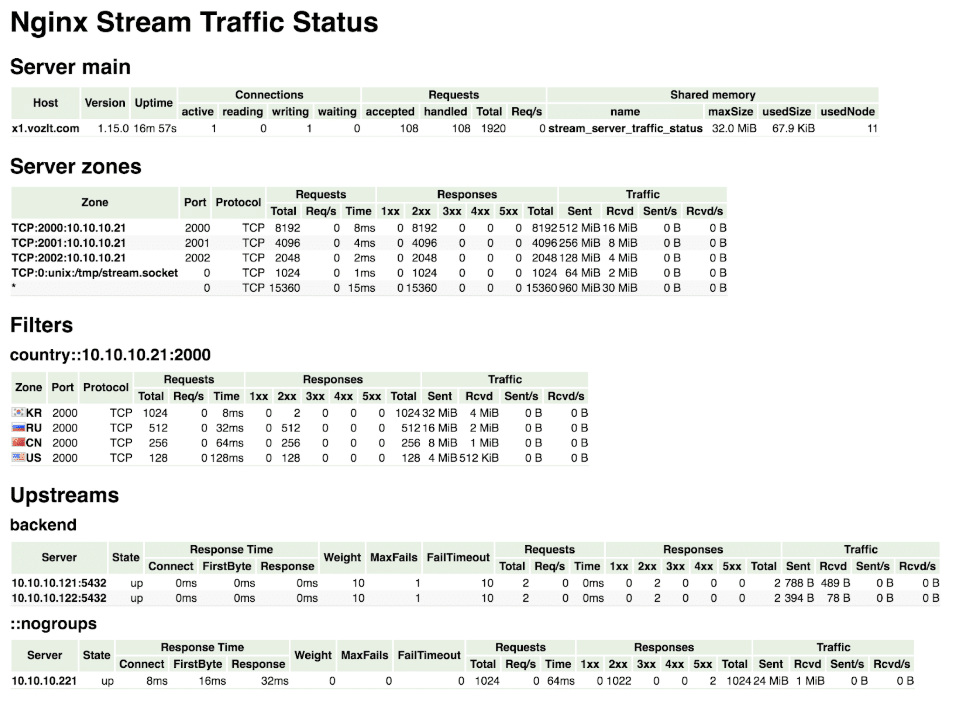
This is an NGINX module that provides access to stream host status information and contains the current status of servers, upstreams and caches. This is similar to the live activity monitoring of NGINX Plus. Thanks to Zinovii Dmytriv for the plugin.
How to monitor Redfish with Telegraf
Redfish is a specification of protocols for REST interfaces to manage servers, storage, networking, and converged infrastructure. In Telegraf 1.15, we now have a Redfish Input Plugin. This plugin gathers metrics and status information about physical server metrics like CPU temperature, fan speed, power supply, voltage, hostname and location details (datacenter, placement, rack and room) of hardware servers for which DMTF’s Redfish is enabled. Thanks to Sarvani Konda who contributed this plugin.
 <figcaption> Credit: Thomas Jensen via Unsplash</figcaption>
New Relic and Telegraf
A lot of monitoring tools are essentially a one-way street: data gets in, but it doesn’t get out. That constraint makes it really difficult when you’re trying to get the most out of your time series data.
For this reason, Telegraf has a number of outputs so that you can avoid vendor lock-in. So, we’re pleased to announce our newest in Telegraf 1.15, the New Relic Output Plugin. This output plugin writes to New Relic Insights using New Relic’s Metrics API. Once you have your New Relic Insights API Key, the configuration should be simple for you to start writing data.
All Telegraf plugins support dual-write. So, if you’d like to send metrics data to both New Relic and (for example) InfluxDB 1.x and InfluxDB 2.0, it’s as simple as adding these output plugins to your Telegraf config:
# Write to New Relic Insights
[[outputs.newrelic]]
 ## New Relic Insights API key
 insights_key = "insights api key"
 ## Prefix to add to add to metric name for easy identification.
 # metric_prefix = ""
 ## Timeout for writes to the New Relic API.
 # timeout = "15s"

# Write to InfluxDB v 1.x
[[outputs.influxdb]]
 ## The full HTTP or UDP URL for your InfluxDB instance.
 urls = ["http://127.0.0.1:8086"]
 ## The target database for metrics; will be created as needed.
 # database = "telegraf"
 ## HTTP Basic Auth
 # username = "telegraf"
 # password = "metricsmetricsmetricsmetrics"

# Write to InfluxDB 2.0
[[outputs.influxdb_v2]]
 ## The URLs of the InfluxDB cluster nodes.
 urls = ["http://127.0.0.1:9999"]
 ## Token for authentication.
 token = "fill_in_your_token"
 ## Organization is the name of the organization you wish to write to.
 organization = "fill_in_your_org"
 ## Destination bucket to write into.
 bucket = "fill_in_your_bucket"
This uses the Telegraf output plugin for InfluxDB 1.x and for InfluxDB 2.0, and is an example of a multi-write pattern is available for all Telegraf output plugins that gives you the freedom to use your data wherever you need it.
Thanks to @hsinghkalsi for the plugin.
...and there's more!
Of course with every minor release, not only are there exciting plugins but the Telegraf community and our team have also worked on a long list of features and enhancements to the existing product. Some of these enhancements include:
- Authentication support for the Telegraf HTTP Response Input Plugin for synthetic monitoring of websites and REST endpoints
- Older version compatibility for the Microsoft SQL Server Input Plugin for Telegraf, so you can monitor a broader range of databases
- Additional fields for the MongoDB Input Plugin for Telegraf, for deeper insight into your MongoDB instances.
Check out the full list of features and bugs for improvements on Telegraf across the board. Then go ahead and download or upgrade to Telegraf 1.15 to try out these new plugins and features. As always, feel free to reach out to us or engage with the community on our Telegraf GitHub page, InfluxDB community site, or public InfluxData Slack channel!

