Table of Contents
When you decide to build a database, you set yourself a particular software engineering challenge. As infrastructure software it must work. If people are going to rely on your system for reliably storing their data, you need to be sure it does just that.
InfluxDB is tested in various ways. We use CircleCI for unit-level testing, as well as some basic integration-level testing. We find CircleCI to be easy to use, well-designed, and responsive. But as we approach the 1.0 release our testing is becoming more sophisticated and thorough.
Correct software is obviously critical – every data point received must be indexed, and every query must return the correct results. But resource usage – CPU, disk IO, and RAM – are just as important. We want a system that is stable when running, and monitoring resource usage during testing can flag issues. Memory leaks become apparent, and excessive disk IO can indicate a sub-optimal design or implementation. Bugs too, may be exposed – a pegged CPU may indicate a problem in the code. So in this post we discuss how we monitor resource usage on systems under test.
Test Infrastructure
A high level view of our test infrastructure is shown below.
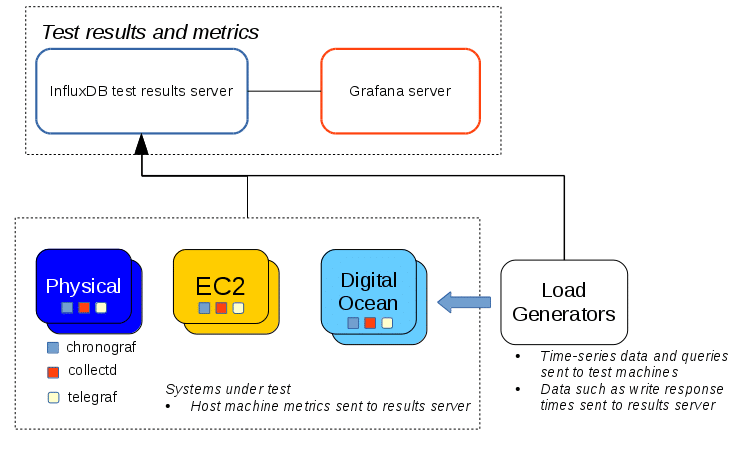
On each node under test we run collectd, configured to output in Graphite format, and Telegraf. Data from these agents is then sent to another InfluxDB system, which we run specifically to store metric data from our test systems. This setup achieves two objectives – it allows us to analyze the test results and means we are also dogfooding our own software.
While an InfluxDB system is under load we record various metrics about the host machine during the entire test run. Most importantly we record disk IO, memory usage, CPU load, and the resident set size of the InfluxDB process. During and after a test the results are shared with the team, and with the help of our Grafana dashboards, we study the results for problems, and (hopefully!) confirm our software is working as expected.
Testing the TSM1 Engine
We recently starting testing the new tsm1 storage engine. A recent test ran for about 8 hours and involved writing billions points to a single InfluxDB node, across 1000s of different series. The target retention policy also had a duration of 1 hour, so we could test those code paths too – since old data would be deleted hourly as new data was being indexed. The Grafana dashboard, showing results of the complete test run, is shown below.
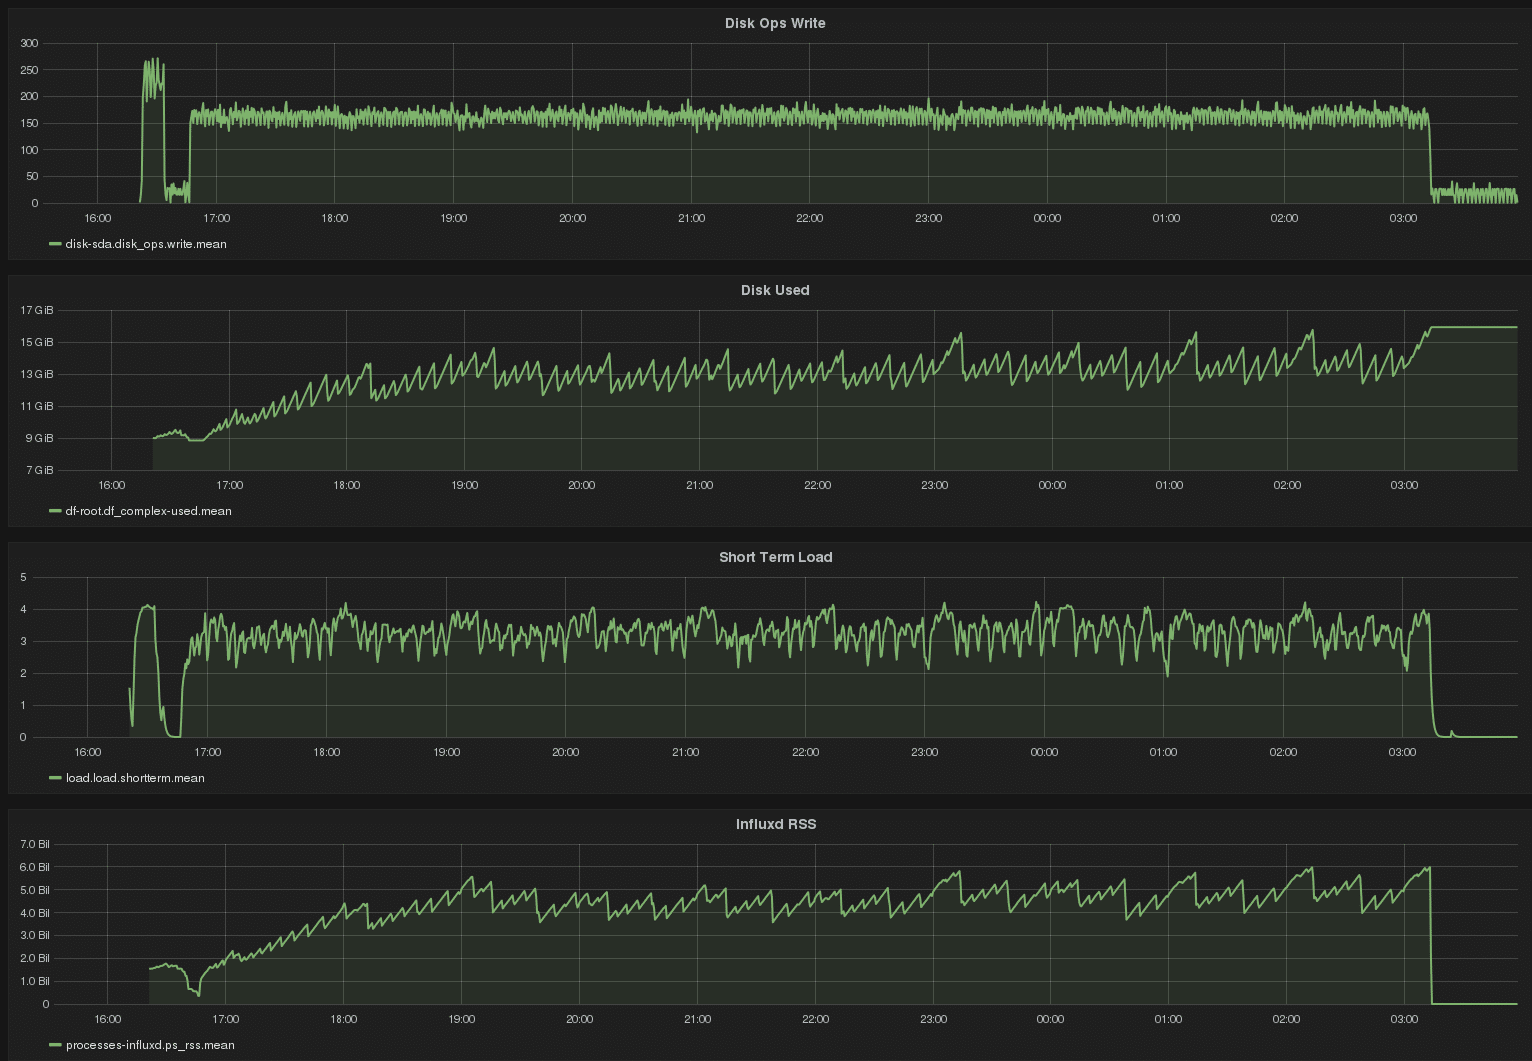
Some interesting features are present. Write load is steady, as is CPU load. Disk usage reached a steady-state as the retention enforcement deleted data at about the rate incoming data was being indexed. The sawtooth pattern in disk usage is a mixture of compaction performed by the tsm1 engine, as well as retention enforcement. Interestingly InfluxDB RSS correlates closely with disk usage, which makes sense to us. The software memory-maps data on disk, so as data on disk is deleted, memory usage declines. But memory usage is generally steady over the long run, at about 30% total physical RAM on the host machine. This tells us this software does not suffer any detectable memory leaks. (The short spike at the very left of each graph is an aborted run.)
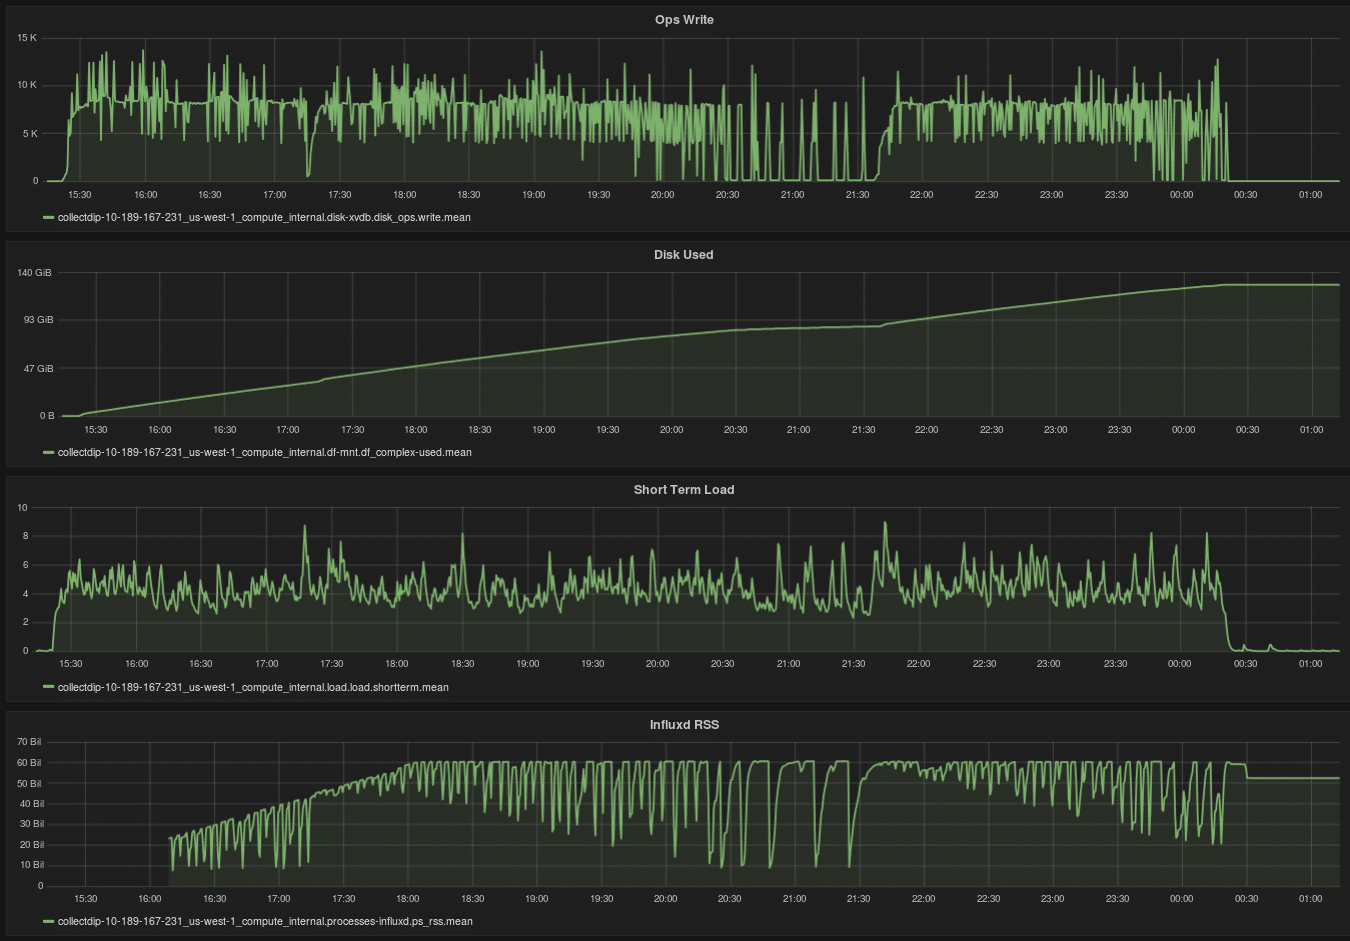
By comparison, the bz1 engine consumes resources in a more irregular manner, as shown below.
Test Environments
We run this kind of testing on a mixture of systems – AWS EC2 instances, Digital Ocean droplets, and physical machines. Physical machines are a particularly important part of our test infrastructure as they allow us to focus on our software – after all nothing is changing between test runs except our code. We don’t have to worry about noisy neighbours or busy networks – running on physical hardware allows us to rule out all factors except the ones we control. But, of course, testing with cloud environments is very important since so many of our users run InfluxDB systems in such environments.
We also use Ansible for our test system deployment and configuration management.
Test Strategies
We recently started building race-detection enabled builds alongside our nightly builds. This allows us to run the test suite against these binaries, which helps us detect race conditions in our code. We also differentiate between stress testing – loading a system to the extreme until it falls over – versus moderate-to-high load testing, which we expect to run for days without any problems. We call this latter testing “burn-in”.
Plans for the Future
We have much more to do as we ramp up testing. Unit and basic integration testing can only take you so far, and it’s important to run tests that last for hours and days. Other key features – such as clustering – are still Beta so as new features come online testing in those areas will increase. Query performance is another key area, which will undergo significant work and testing in the near future.
As Richard Feynman once said: “For a successful technology, reality must take precedence over public relations, for nature cannot be fooled.” And our testing makes sure we don’t fool ourselves.
