The Chande Momentum Oscillator and InfluxDB
By
Anais Dotis-Georgiou
updated December 14, 2025
Product
Use Cases
Developer
Navigate to:
I’m sitting in my friend’s living room. He’s sitting cross-legged in white linen pants, with his hands casually placed on his knees, nodding gently. His guests are part of a fairly successful pop band, and they’re recounting their adventures from their latest tour around Europe and Asia in a sailboat, magic tiny-home-schoolbus, or some hip mode of transportation. I noticed the only quiet guy there. The only thing I know about him is that he’s supposed to be a music production wizard. He’s typing away furiously, concentrated on his screen. I ask him what he’s doing, and he gently replies, “I’m creating a python script to execute an automated bitcoin trading strategy”. I have no idea whether his bot yielded a good return or whether he even finished it. However, actually hearing that string of buzzwords out loud and watching those words casually leave his lips left an impression on me I too must play that game one day. Well, here I am.
InfluxDB as a learning tool to develop a trading strategy
I stumbled across Alpaca, the commission-free REST API stock brokerage. It’s pretty cool. You have the option of paper trading or live trading. Plus, the documentation comes with example algorithms and instructions for how to deploy on Heroku so you can actually implement your trading commission free.
However, I quickly found that their example algorithms are pretty basic. I need to familiarize myself with more financial analysis tools and evaluate the long-term performance of various algorithms before committing to an investment strategy. Eventually, I’d like to monitor the success of my algorithm as well. Luckily, InfluxDB is here to help.
People who are familiar with InfluxData hear InfluxDB and think, “DevOps Monitoring” or “IoT”. However, InfluxDB can also be a great tool for someone looking to start a ‘home’ financial services project. InfluxQL, InfluxData’s SQL-like query language for interacting with InfluxDB, has several of out-of-the box technical analysis functions which can help you identify market characteristics. The Chande Momentum Oscillator is among them.
What is the Chande Momentum Oscillator?
The Chande Momentum Oscillator (CMO) is a technical indicator that was invented by Tushar Chande in 1994. Specifically, it’s a momentum oscillator. It is the ratio of the difference between all of the sums and gains and the total number of price movements within a recent period.
CMO = (H - L)/(H + L) *100
where H and L is the sum of higher and lower closes, respectively, within N periods.
How to use the Chande Momentum Oscillator with InfluxDB
To view my data I use the following InfluxQL query:
SELECT "Close" FROM "AAPL"."autogen"."price" WHERE time > :dashboardTime: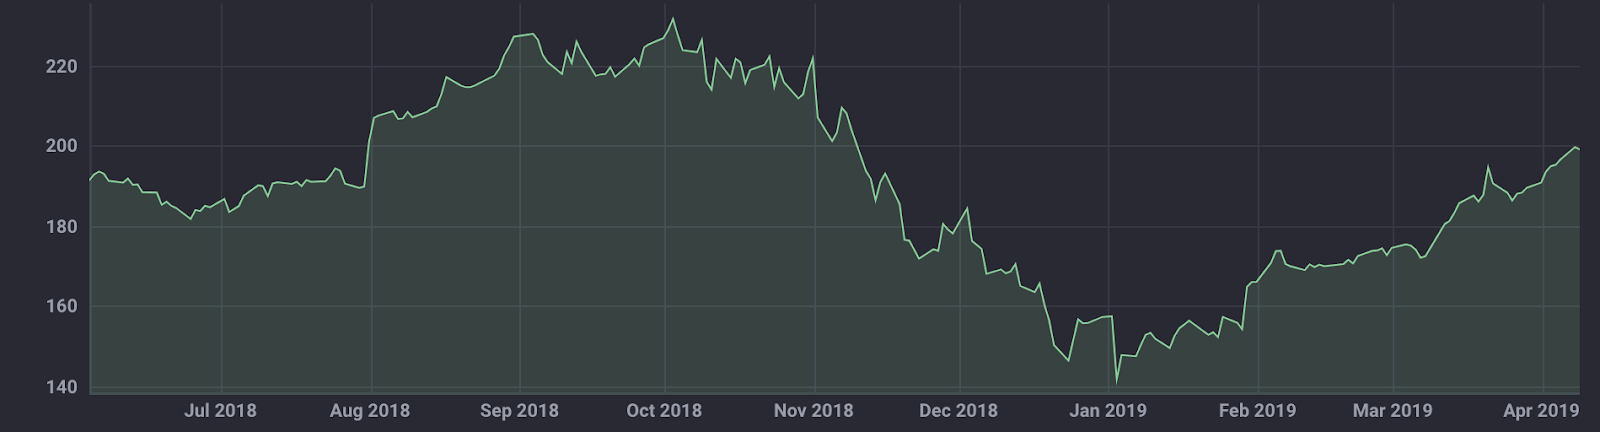 <figcaption> AAPL closing price data from the past year, visualized in Chronograf</figcaption>
To apply the CMO, as described in the docs, I submit:
SELECT CHANDE_MOMENTUM_OSCILLATOR("Close", 20) FROM "AAPL"."autogen"."price" WHERE time > :dashboardTime:Where I set the period to 9. Typically investors will use a period of 7-10 when they are analyzing closing prices.
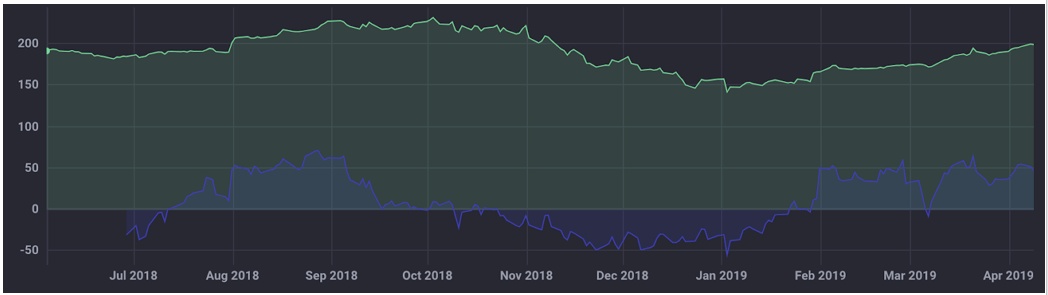 <figcaption> The Chande Momentum Oscillator (blue) and AAPL closing price (green) visualized in Chronograf with InfluxDB</figcaption>
When to buy or sell using the Chande Momentum Oscillator
The blue line indicates the CMO. When it goes over +50, the stock is considered overbought and when it drops below -50 it is oversold.
For example, in early January 2019, the CMO falls below the -50, and the stock is oversold. Immediately following, we see bullish behavior. Also, note that the slope of the CMO and the AAPL closing price are both negative before the CMO line crosses the -50 level. When the slopes of the CMO and price data are in agreement, it can confirm that the CMO is a good indicator.
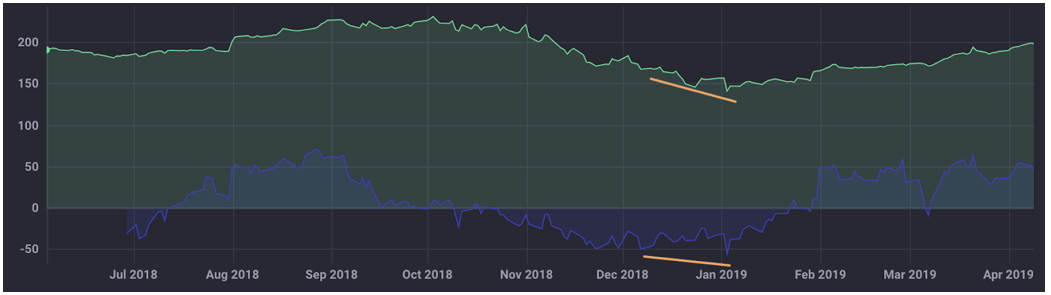 <figcaption> An example of positive or bullish divergence, characterized by a negative price trend and a positive CMO trend</figcaption>
However, when the slopes are opposing, this is referred to as divergence. Divergence can signal a potential reversal. Negative divergence occurs in September. The AAPL price continues to go up, but the CMO, although over 50+, is decreasing relative to late August. Negative divergence is defined by positive price trend and a negative CMO trend. A negative divergence could suggest that the CMO might not be reliable in the longer term, and to expect bearish behavior. This is witnessed in early October where the CMO peaks above the +50 level, but the price decreases after.
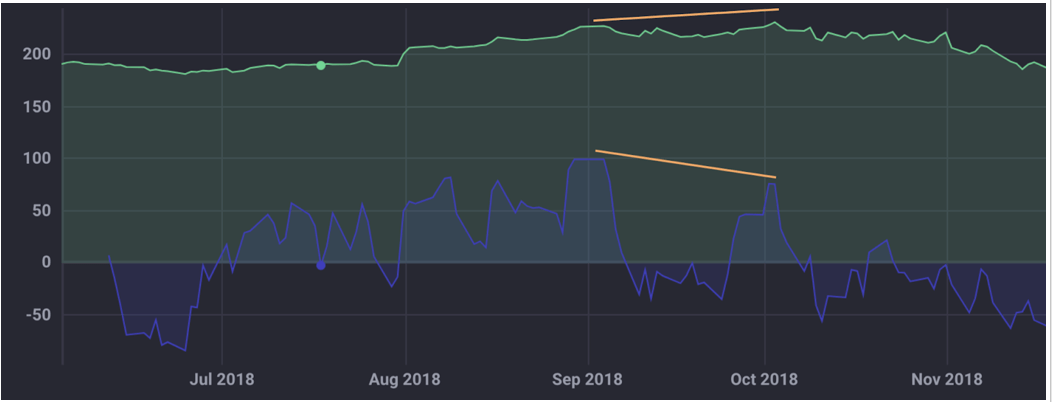 <figcaption> An example of negative or bearish divergence</figcaption>
You can also use a moving average (MA) in conjunction with a longer-term CMO as another confirmation indicator. I calculated a 9-day MA for a CMO with a 20 day period with the following query:
SELECT MOVING_AVERAGE("CMO_20", 9) FROM (SELECT CHANDE_MOMENTUM_OSCILLATOR("Close", 20) AS "CMO_20" FROM "AAPL"."autogen"."price" WHERE time > :dashboardTime:)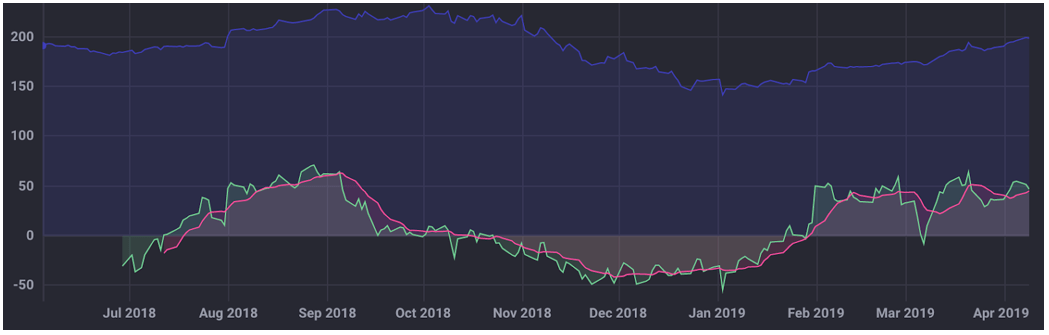 <figcaption> APPL closing price (blue), 20-day CMO (green), and MA (pink)</figcaption>
The MA acts as a signal line. When the CMO crosses the MA, it is interpreted as bullish signal. In early September, we see the opposite happening. The CMO falls below the MA, indicating a bearish signal instead. This confirms our interpretation of the divergence that we observed above.
Conclusion
InfluxQL has several other technical analysis functions, and I’m excited to see what the rest teach me, and how I will apply them. As always, if you have any questions, please post them on the community site or tweet us @InfluxDB.
