The Effect of Cardinality on Data Ingest — Part 1
By
Ed Bernier
Product
Developer
Company
Dec 01, 2017
Navigate to:
In my role as a Sales Engineer here at InfluxData, I get to talk to a lot of clients about how they’re using InfluxDB and the rest of the TICK Stack. We have a large number of very large clients using InfluxDB Enterprise for metrics collection, analysis, visualization and alerting in their DevOps area and so we’ve done a lot of scale out testing for these clients. In these tests, we see very linear scale out as we add additional nodes to an InfluxDB Enterprise Cluster. I’ll talk about this in my next blog post.
Over the last 6 months, I’ve seen more and more large manufacturers, energy companies and utilities coming to us for collecting metrics from their IoT devices. Many times, they’re working with consulting companies that specialize in building IoT solutions, and these companies bring InfluxDB into the solution because we’re so well-suited for time series applications.
A few things I’ve noticed with these IoT applications is that many times, there is a need for a local instance of InfluxDB running in the factory and alerting locally on anything they’re monitoring. In these cases, the equipment they have to run on is pretty lightweight, so it’s just as important to understand how we scale down as how we scale up. The other thing is the cardinality of the data can be rather large compared to the amount of data to be ingested. So I thought I’d do some scale down testing as well as measure the impact of cardinality on write throughput. That’s what this blog post is about. It’s the first of a series I’m doing on performance testing of InfluxDB Enterprise. So if you’re interested in this topic, stay tuned.
The Setup
For the purposes of this testing I’ll be spinning up a cluster in AWS using some utilities we’ve built to make this easy. If you haven’t worked with InfluxData’s TICK Stack before, you’ll be surprised how easy it is to install and setup. In fact, one of my peers, David Simmons, wrote another post on that topic you can find here Go from Zero to Awesome in 5 Minutes or Less. Check it out.
For running InfluxDB on AWS, we’ve found that the R4 type of instances which are optimized for memory-intensive applications work best. These also use SSD storage which is recommended for your data, wal and hh directories when running InfluxDB or InfluxDB Enterprise.
For the testing, I’ll be spinning up the following size clusters on AWS:
- (2) nodes with 2 cores and 15.25 GB of memory (r4.large)
- (2) nodes with 4 cores and 30.5 GB of memory (r4.xlarge)
- (2) nodes with 8 cores and 61 GB of memory (r4.2xlarge)
- (2) nodes with 16 cores and 122 GB of memory (r4.4xlarge)
And I’ll test these using data with the following cardinalities: 10,000, 100,000, and 1,000,000 series, to see how the number of unique series affects the ingest rate and the heap used.
For Part Two of this series, I’ll also scale out to 4, 6, 8 and 10 node clusters and increase the cardinality to show how well InfluxDB Enterprise scales horizontally.
To generate data for the testing with the correct granularity, I’ll be using a utility developed by one of our engineers called inch, which stands for INflux benCHmarking. This is an awesome utility for simulating streaming data for benchmarking purposes. It’s written in Go and is available out on Github at https://github.com/influxdata/inch. If you type inch –h you’ll get help on using the utility. I’ve listed the options below:
Usage of inch:

-b int
Batch size (default 5000)

-c int
Concurrency (default 1)

-consistency string
Write consistency (default any) (default "any")

-db string
Database to write to (default "stress")

-delay duration
Delay between writes

-dry
Dry run (maximum writer perf of inch on box)

-f int
Fields per point (default 1)

-host string
Host (default "http://localhost:8086")

-m int
Measurements (default 1)

-max-errors int
Terminate process if this many errors encountered

-p int
Points per series (default 100)

-password string
Host Password

-report-host string
Host to send metrics

-report-password string
Password Host to send metrics

-report-tags string
Comma separated k=v tags to report alongside metrics

-report-user string
User for Host to send metrics

-shard-duration string
Set shard duration (default 7d) (default "7d")

-t string
Tag cardinality (default "10,10,10")

-target-latency duration
If set inch will attempt to adapt write delay to meet target

-time duration
Time span to spread writes over

-user string
Host User

-v
Verbose
Using inch, I’ll generate data from two client nodes running on AWS m4.2xlarge nodes which have 8 cores each and 32 GB of memory. I’ll be running 8 streams on each client for a total of 16 concurrent writers.
The difference in performance was minimal scaling up to 32 writers so I decided not to include the numbers.
In summary, I’ll use the following constants for my testing:
- (2) m4.2xlarge nodes running 8 write streams each
- Batch size for writes = 10,000
- Consistency = ANY
- Replication Factor = 2
- Number of points to write per series = 100000
The Testing
For this test I’m only using 2 node clusters which provide high availability, but since we are replicating writes across both nodes in the cluster I’m not testing scale out horizontally. In fact, due to cluster overhead, this performance would be slightly less than you’d expect on a single node of InfluxDB. Since most of our customers want high availability and InfluxDB provides a very high ingest rate even on smaller servers, this is a common configuration we see.
After spinning up the cluster on AWS, the first thing I did was create my database with a replication factor of 2. I called my database “stress” and used the CLI to create it:
influx -execute 'create database stress with replication 2'Next, I logged into my client nodes and entered the following inch commands to start generating my workload for the 10,000 unique series test:
inch -v -c 8 -b 10000 -t 1,5000,1 -p 100000 -consistency any
inch -v -c 8 -b 10000 -t 1,1,5000 -p 100000 -consistency any
Now let me explain the command line options for the above inch commands. The –v tells inch to print out detailed stats as it’s running, so I can see how many points have been written, the ingest rate and other details about the test. The –c tells inch how many write streams to run concurrently. I’m running 8 each so 16 concurrent write streams total. The –b allows me to set the batch size. A batch size 5,000 to 10,000 is recommended for InfluxDB so I chose 10,000. The –t allows me to define the shape of my data; in other words, the number of tags and how many unique values to generate for each tag. Client one generated 3 tags, the second one having 5000 unique values and client two generated 3 tags with the third one having 5000 unique values for a combined 10000 unique values overall. The –p indicates how many points to generate per series, and the –consistency option allows me to set my write consistency which I set to any.
Here is a sample of what the generated data looks like:
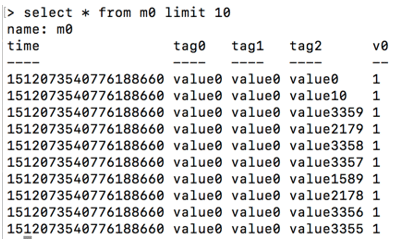
The Details
So here are the results of my testing. As you can see, vertical scaling as I tested on systems with more cores was very linear. Also as the cardinality was increased, it definitely had an impact on the ingestion rate, and I found that there is a performance hit as new series are being created for the first time but then once all the series are created, ingestion performance levels off to the rates you can see in the chart below.
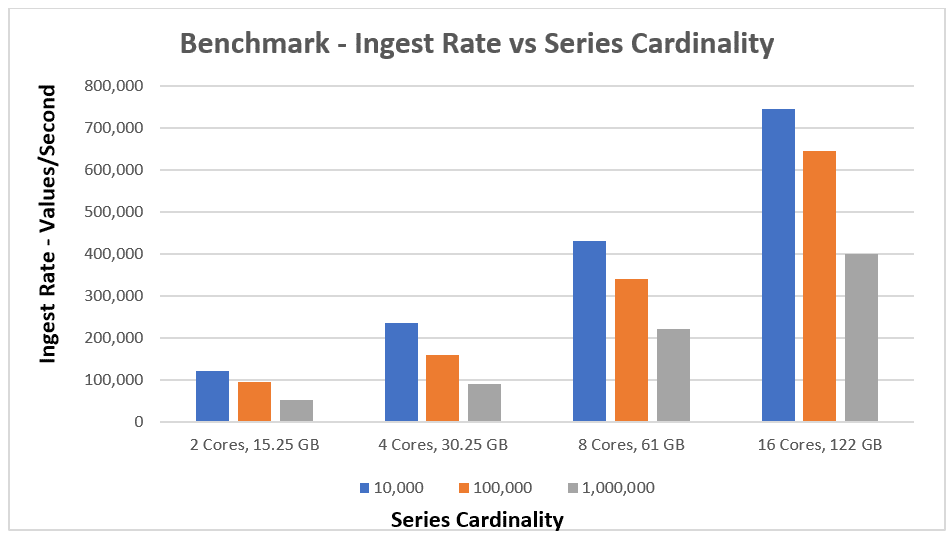
I've also included the detailed numbers below:
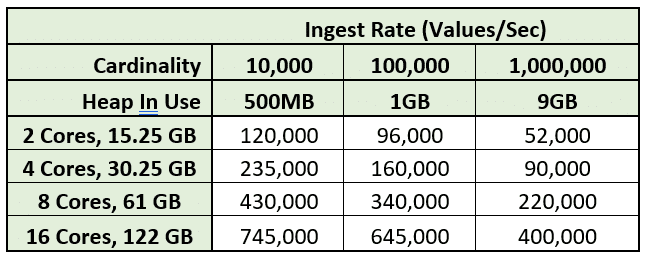
Observations
I was pleasantly surprised by how much data a cluster with 2 core nodes could handle since many IoT use cases have minimal size servers at the edge of the network where there’s sometimes a need to have some local storage, visualization and alerting.
I also was pleased to see how linearly the vertical scaling was as cores were added and as the cardinality of the data was increased. Also, the amount of memory needed as the cardinality was increased 10x from 100,000 to 1,000,000 also increased about 10x, which again was very predictable, which is good when doing capacity planning on your InfluxDB Enterprise environment.
What's Next?
Stay tuned for Part 2 where I’ll test horizontal cluster scale out.
If you’d also like to see some comparison benchmarks of InfluxDB vs. OpenTSDB, ElasticSearch, Cassandra or Mongo, check out these other benchmarks that have been run.
