The State of TICKscript Development
By
Russ Savage
updated December 14, 2025
Product
Developer
Navigate to:
In order to get the most out of Kapacitor (the ‘K’ of the TICK Stack) and the monitoring and alerting it provides, you and your team will need to write TICKscripts. TICKscript is a simple yet powerful way to aggregate, analyze, and alert on the data flowing through InfluxDB. In this post, I am going to walk through the various tools available for writing TICKscripts and highlight some common patterns I’ve seen for organizing the development process for scripts. Let’s start off by highlighting some of the development tools available for writing TICKscripts. The plugins for the various editors and IDEs have been contributed by the community and are not maintained by InfluxData. If you have a favorite editor that might be missing a TICKscript editor, we encourage you to create one and share it in the Community page.
Development Environments
Every developer has a favorite IDE that they use for writing and deploying their code. Below is a quick rundown of the various tools we know about that developers are using to write TICKscripts.
Chronograf Web UI
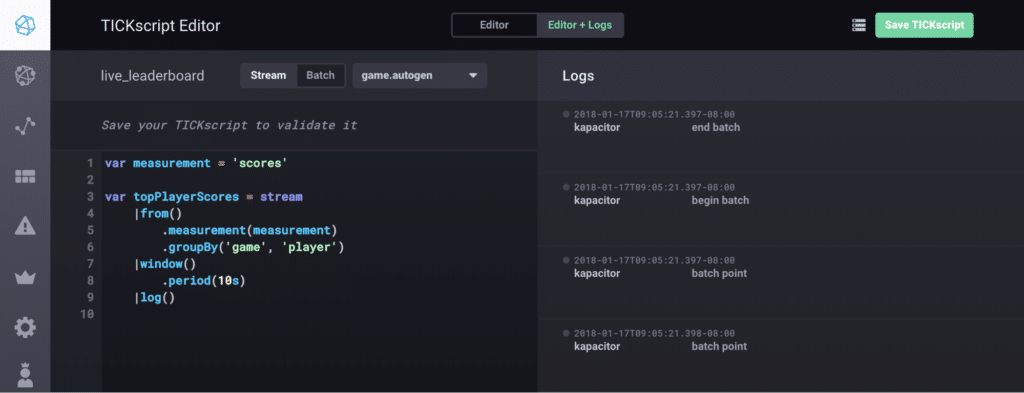
One of the quickest ways to get up and running writing TICKscripts is to do so through the built-in editor in the Chronograf UI. To get started, make sure you have access to the full TICK Stack running somewhere. If you want to try it out on your machine, check out this tutorial on getting everything set up and connected. The TICKscript editor can be found under the Alerting tab in the create submenu.

From there, you have two options: you can create an alert rule using the wizard in the UI, or you can create and edit a custom TICKscript to do whatever you like. Behind the scenes, the alert wizard will generate a TICKscript that you can then go in and manually edit later. This is useful as a starting point that you can then use for further customization. One thing to keep in mind is that the Chronograf UI will only interact with the linked Kapacitor instance you have selected. This is where it will pull the list of scripts as well as the actual code displayed. If you have files stored locally on the Kapacitor machines, they will need to be manually synced if you make changes through this UI. Also, in version 1.4 of Chronograf, we introduced a new Kapacitor Log Viewer that allows you to see the output of any log() commands right in your browser. This is extremely helpful for debugging scripts.
Vim Integration
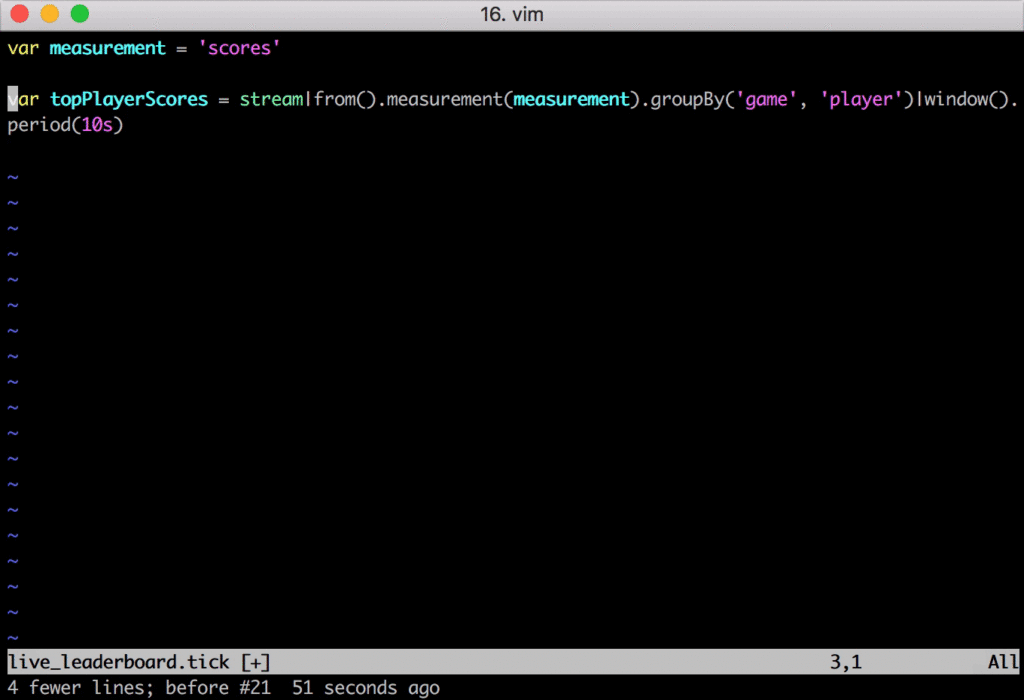
For those of you what don’t like to leave the terminal, there’s also a Vim plugin that is maintained by InfluxData’s own Nathaniel Cook. It can be found in the vim-tickscript GitHub repo. Installation is quick using your favorite Vim plugin manager but there are instructions for Pathogen and vim-plug provided in the README file. After installing, you can run the :TickInstallBinaries command which will add tickfmt to your path for formatting your scripts. When I installed this, since I don’t use Vim for development, I also needed to install the vim-go plugin, otherwise I was seeing a bunch of errors when I tried to run the script to install tickfmt. By default, this plugin will automatically format your scripts each time you save, but that can be changed in the preferences.
Emacs Major Mode
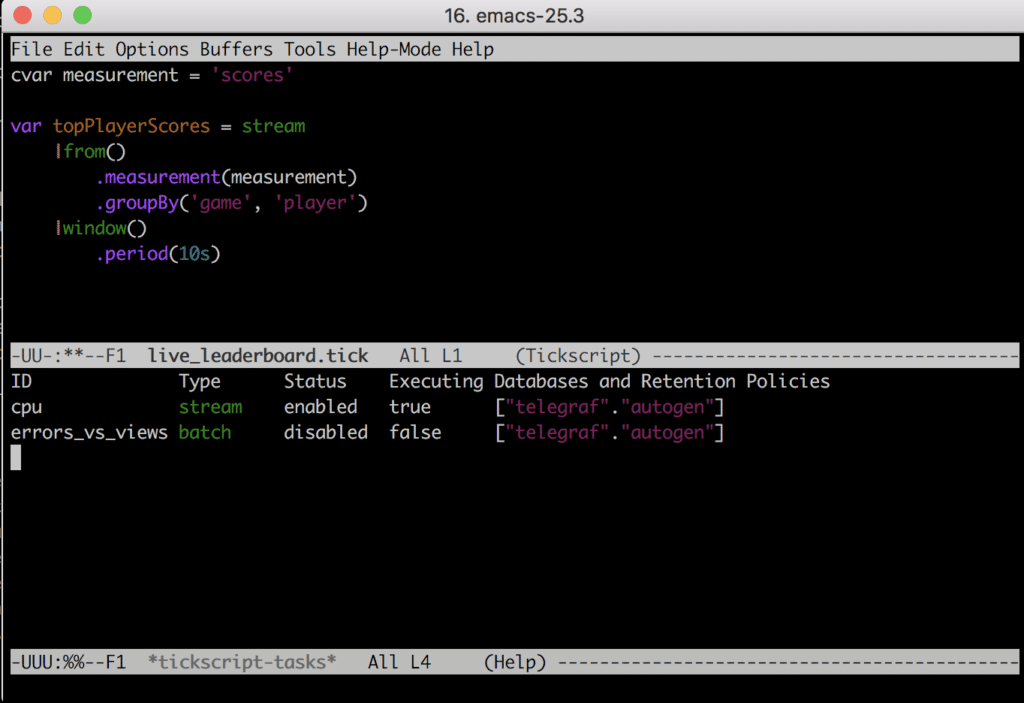
Of course, if we talk about Vim, we need to give equal time to Emacs. Marc Sherry has put together a pretty awesome Emacs major mode for TICKscript files and shared it with the community. In addition to syntax highlighting and formatting, it also allows you to run common Kapacitor functions through Emacs commands. You can find a list of commands in the README file.
Atom Integration
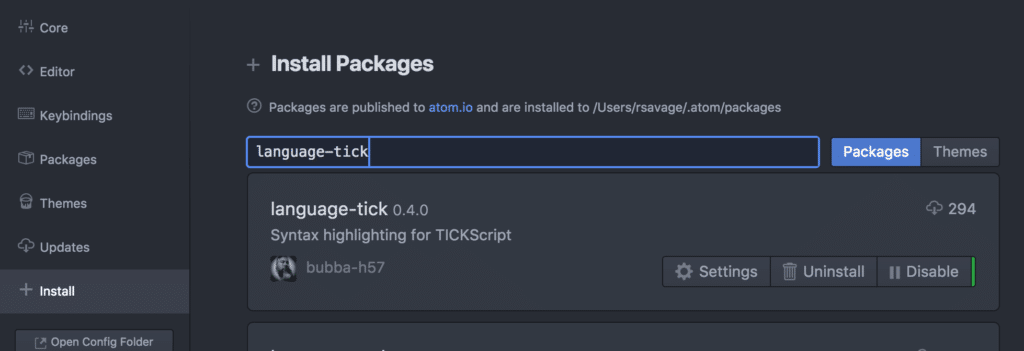
Atom is an extremely flexible open-source text editor that many developers love using. Bubba Hines built a nice Atom package for TICKscript syntax highlighting. Installation is quick and easy via the Atom package installer, just search for language-tick and you’re all set. It doesn’t automatically format your scripts, but the syntax highlighting is helpful for quickly finding issues. If you’re looking for everything in one screen, you could install the platformio-atom-ide-terminal plugin and use it for testing and installing your scripts in Kapacitor.
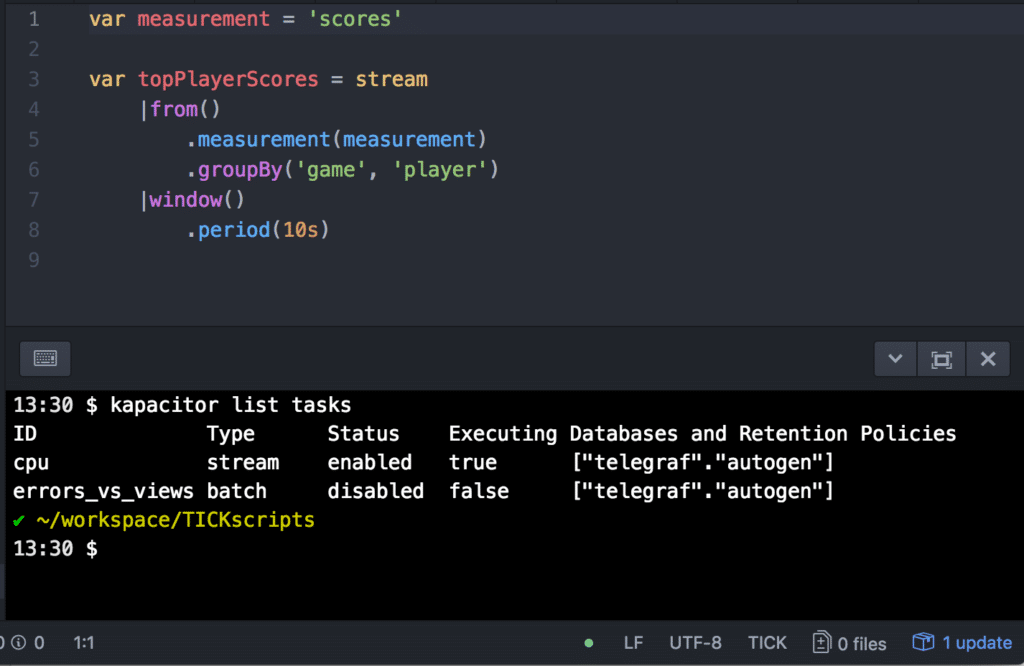
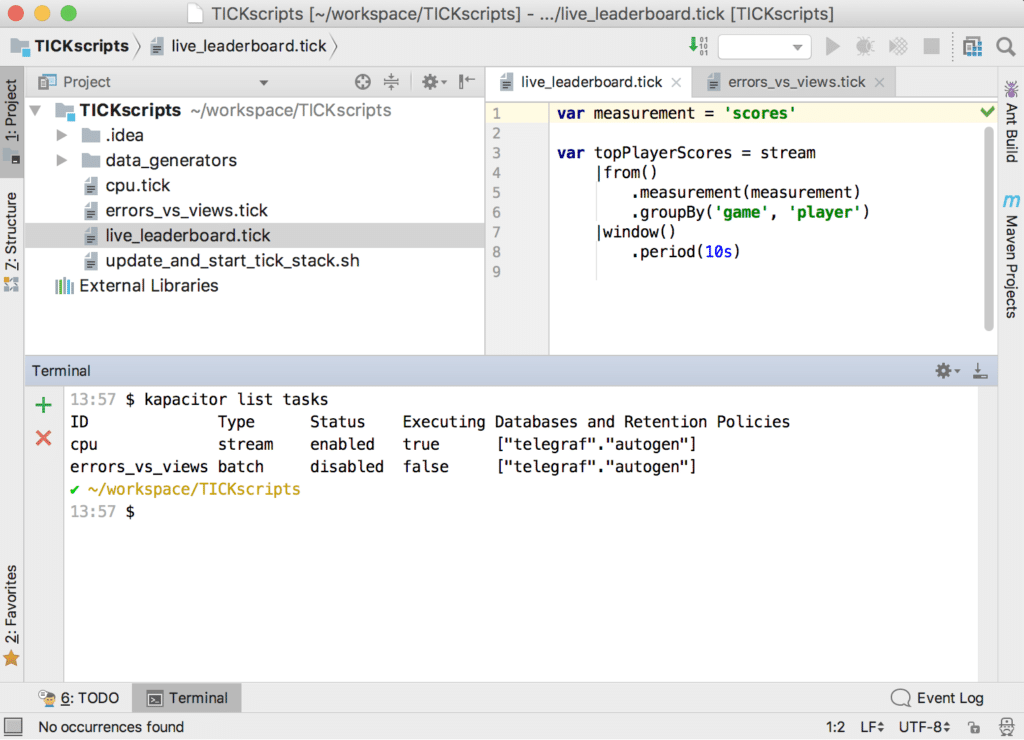
Jetbrains Plugin
The Jetbrains Intellij platform also has support for TICKscript editing courtesy of Vladislav Rassokhin and his intellij-kapacitor plugin. This can be used on any Intellij based IDE including GoLand or IDEA. Like the Atom plugin, it has syntax highlighting and the built-in terminal panel makes it easy to update scripts in Kapacitor all in the same window. You can also jump to variable definitions quickly using command-click, just like writing Java or Go code.
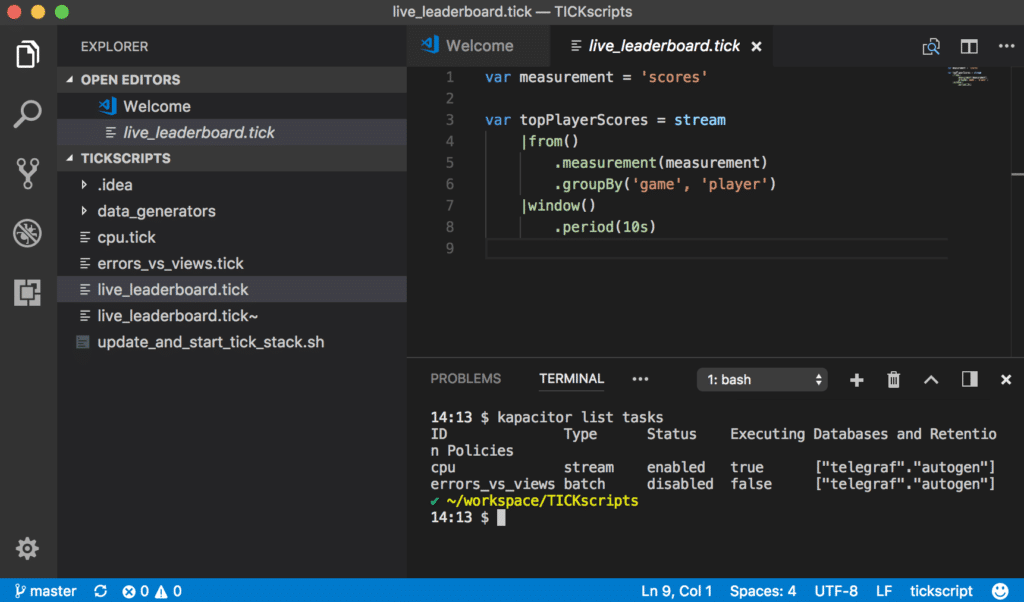
Visual Studio Code Plugin
And last but not least, for those who have fallen in love with Microsoft’s Visual Code tool, Matt Jones has written a TICKscript syntax highlighter plugin for that as well. Installation is easy via the install button in the browser once you have Visual Code installed. Like the other IDEs, Visual Code comes with an integrated Terminal panel which is useful for sending commands to Kapacitor.
Recommended Development Workflow
As you can see, there is no shortage of tools available for writing TICKscripts. But having the right tools in place is only part of the solution. You will need to standardize a process for moving TICKscripts from your local developer machine into your production system.
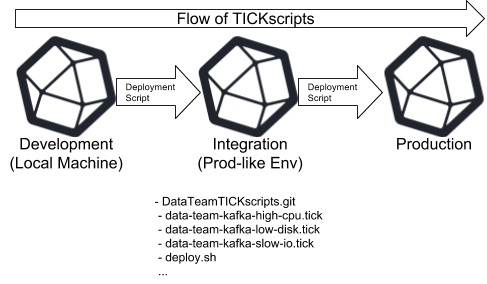
Let’s start with deployment environments. Developing TICKscripts should be handled like any other type of code in your organization, and you should never edit scripts directly in production. Most of our larger users have at least three environments up and running: a local development environment, an integration environment, and a production environment. You may have more, but with any less you will greatly increase your chances of rolling out scripts that don’t function or monitor properly. All new scripts or changes flow from left to right and never the other way around, no matter how small.
Source Control is a Must
Many of our customers keep their TICKscripts checked into some sort of source control system, usually Git or SVN. We recommend organizing repositories around the different teams responsible for monitoring. A single repo should contain all the TICKscripts that will be deployed by a single team on their instance or cluster of Kapacitor. Not only does this make it easier to deploy the scripts (one shell script at the root of the repository can quickly scan for all the TICKscripts in the repo and load them through the Kapacitor API), but it also makes it easier to find, add and fix them, since each team manages their own.
Another common pattern we see is when there is a centralized infrastructure team that is keeping track of a core set of TICKscripts deployed to every Kapacitor instance in the company. Then, each individual team can also have their own repository with their own set of scripts. The idea here is to make sure that teams don’t have to ask permission from each other to make changes since each team has their own repository that they can manage with their own TICKscripts.
Repository Structure
There are many different ways to structure the repository containing your TICKscripts, ranging from having all your scripts in the root directory to having them categorized neatly into folders. If you are planning to leverage the file based loading of scripts in Kapacitor, you will need to maintain a predefined structure. Regardless of how they are organized, when they are sent into Kapacitor, each is only referenced by their name, so we recommend encoding useful keywords into the actual name of the file and script. For example, if the data team has an alert for monitoring high CPU on a Kafka cluster, the script file name might be data-team-kafka-high-cpu.tick with a corresponding script name. Of course, you are free to choose whatever format you like, but our advice is to keep it consistent on each Kapacitor instance and encode as much searchable information into it as you can. Also remember that results are returned alphabetically from the Kapacitor API.
Testing and Deploying Changes
The process for making changes to TICKscripts should also follow standard development best practices. Developers should first check out the repository from source control, make their changes (possibly on a different branch), and have the changes code reviewed by another team member before merging them back into the main branch. You can also write unit tests for your TICKscripts using this awesome library from Gonçalo Pestana. With this unit test framework, you can define sample data that should trigger your alert and verify that it is working as expected. These unit tests should live in the same repository as your TICKscripts.
Once your code has been merged back to the main branch, it should be deployed to your testing environment for integration testing using an automated script. Your integration environment should mimic your production environment as closely as possible, so that any problems or clashes with other scripts or alerts can be discovered here instead of production. You should be able to mimic the issue you are trying to alert on in your integration environment using sample data generation.
Finally, once your TICKscript has been verified to work in your integration environment, it should be automatically loaded into your production environment using deployment scripts.
All of this might sound like a lot of work to set up at first, but a little investment up front will pay back many times over with increased agility and the proper alerting for your production systems.
Conclusion
For those of you who are just getting started with TICKscripts, I hope I’ve been able to point you in the right direction in terms of tools and development processes. If you’ve already got a large number of TICKscripts deployed, please let us know in the comments if you have some helpful tips and tricks for developing and maintaining scripts.
