TICKscript Templates
By
Dave Patton
Product
Use Cases
Developer
Nov 01, 2017
Navigate to:
Kapacitor is an integral piece of the InfluxData platform, and in fact as the platform continues to develop, we are looking to Kapacitor to do more and more in terms of data processing and workloads. At the core of these workloads are alerts and downsampling or aggregations. I am often asked by customers as to what is the best way to create TICKscripts for these two types of workloads. So I thought I would take a moment here and provide you with some TICKscript templates you can use as starting points for an alert and a downsample.
Alerts
Alerts are at the core of what Kapacitor does and is the most common type of workload for Kapacitor in the wild. I’m going to let you in on a secret for creating great alert scripts: Use Chronograf to stub them out. Chronograf has the ability to visually create alerts.
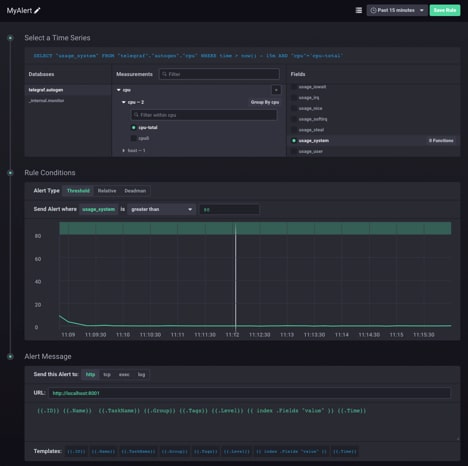 In the image above, I have created an alert on CPU usage and set a threshold of 80%. When the alert triggers, I want to it make an HTTP POST. Pretty simple alert.
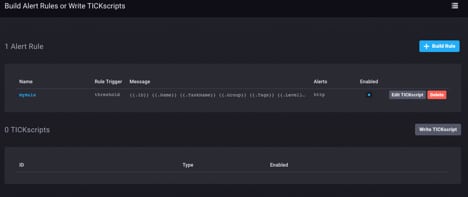 Once you have created your alert, you can view and copy the actual TICKscript. Go back to the Alert Rules page and select the “Edit TICKscript” button for your alert.
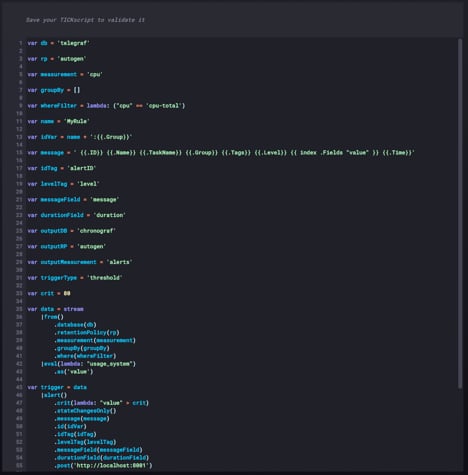 Prior versions will just show the script contents, but if you are using the latest version of Chronograf (at least 1.3.10) this will open up the new TICKscript editor, which you can use to start writing more TICK code.
Downsamples
The second most common workload for Kapacitor is using it to downsample or aggregate data. In the Kapacitor docs, there is a guide for using Kapacitor as a Continuous Query Engine, but it’s not exactly clear that this is the same thing as aggregation and downsampling. So let’s discuss it here as well. In general, our recommendation is to run aggregation or downsampling TICK scripts as BATCH scripts. The script snippet below will run the query every five minutes and grab the last 5 minutes worth of CPU data from our Telegraf database. It will then take the mean of that data and store it back into the DB. Assuming that Telegraf is reporting every 30 seconds, this basically says that we are going to downsample from 30 second resolution to 5 minute resolution data:
batch
   |query('SELECT mean(usage_idle) as usage_idle FROM "telegraf"."autogen".cpu')
      .period(5m)
      .every(5m)
      .groupBy(*)
   |influxDBOut()
      .database('telegraf')
      .retentionPolicy('autogen')
      .measurement('cpu_idle_5minute')
      .precision('s')
What if I wanted to downsample from 30 second to, say, an hour? In that case, your script should look like:
batch
   |query('SELECT mean(usage_idle) as usage_idle FROM "telegraf"."autogen".cpu')
      .period(1h)
      .every(1h)
      .groupBy(*)
   |influxDBOut()
      .database('telegraf')
      .retentionPolicy('autogen')
      .measurement('cpu_idle_1hour')
      .precision('s')
You can see that the general rule for downsampling is that the period() should equal every().
Conclusion
We have now given you some templates to use for creating TICKscripts for the two most common Kapacitor use cases: Alerts and Downsampling. Of course there is a lot more you can do with Kapacitor. As a best practice, when developing a lot of TICKscripts, I would highly recommend that you setup a Github repo and/or a Wiki for folks to use to get these templates and to use as a guide for different scripts. It’s also helpful for Dashboard definitions, but that is another article.
Now go write some code.
