TL;DR InfluxDB Tech Tips: Debugging and Monitoring Tasks with InfluxDB
By
Anais Dotis-Georgiou
updated December 14, 2025
Product
Use Cases
Developer
Navigate to:
With InfluxDB you can use Tasks to process data on a schedule. You can also use tasks to write custom alerts. However, sometimes your task will fail. In this TLDR, we’ll learn how to debug your task with the InfluxDB UI and the InfluxDB CLI.
Debugging tasks with the InfluxDB UI
The InfluxDB UI is full of information about your tasks to help you understand more about the tasks you’re running.
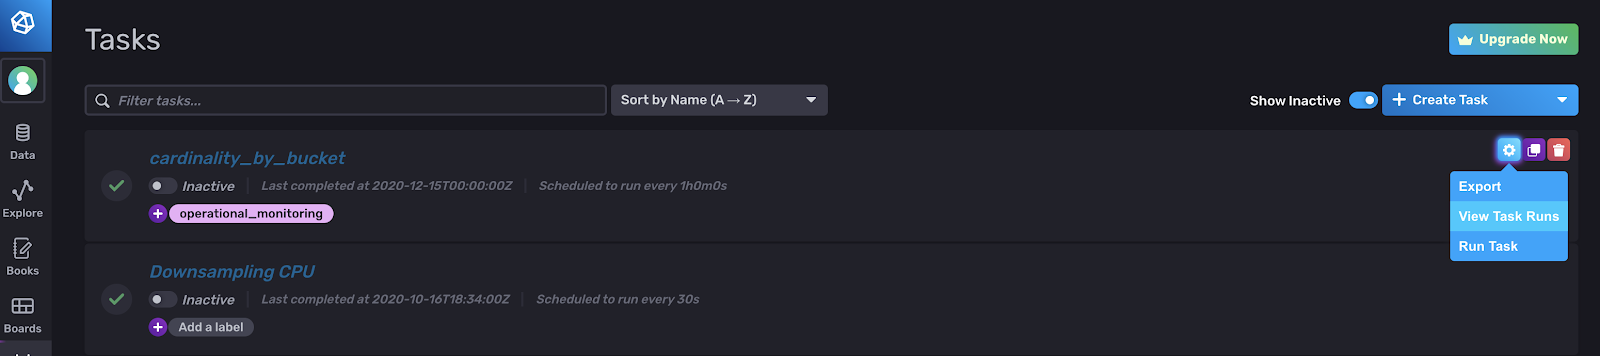 <figcaption> Screenshot of the Tasks page in the InfluxDB UI that allows you to view your list of tasks, their run status (active or inactive) and much more</figcaption>
Here are some of the UI features of the Task page you should familiarize yourself with:
- Task run status toggle: It enables you to toggle a Task on/off or active/inactive. I toggle my tasks to inactive when I am debugging a failing task. I also use this feature when I'm testing a new Task. Specifically, I'll temporarily set my task to run very frequently to make sure it can pass whatever tests I throw at it. Then I'll set the task to inactive while I make final changes to my task. Finally, I'll turn it back to active when I'm confident with how my final task looks.
- The gear icon: This is probably the most important UI feature for debugging your tasks. It allows you to Export your task, View Task Runs, and Run Task.
- Export button: The Export button in the dropdown under the gear icon allows you to export your task as JSON. Exporting your task is an easy way to share your task with colleagues or the community to get help debugging it. You can also get the task ID from looking at the json. You can also pull it from the URL as well. For example, https://us-west-2-1.aws.cloud2.influxdata.com/orgs/<org_id>/tasks/<task_id>. The task ID can be helpful for monitoring your tasks with InfluxDB and using the CLI to debug your tasks. Please refer to the last section in this blog for more details on how to monitor your tasks with InfluxDB.
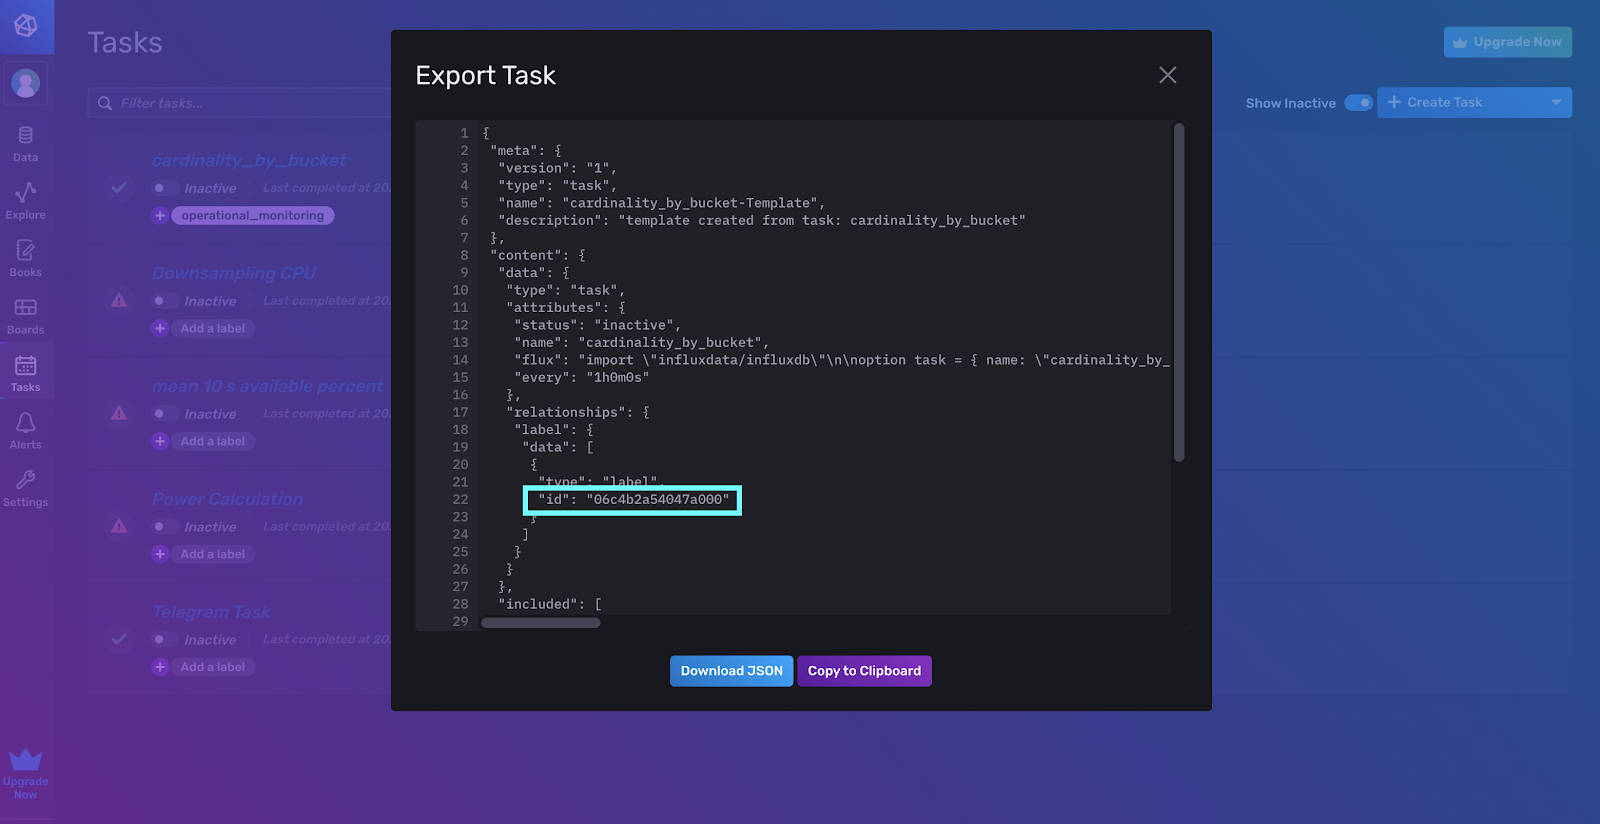 <figcaption> You can gather your Task ID from the Task JSON</figcaption>
- View Task Runs button: In my opinion, this is the most useful feature in the InfluxDB UI for debugging your tasks. Clicking on the View Task Runs button in the dropdown under the gear icon takes you to the following page in the UI:
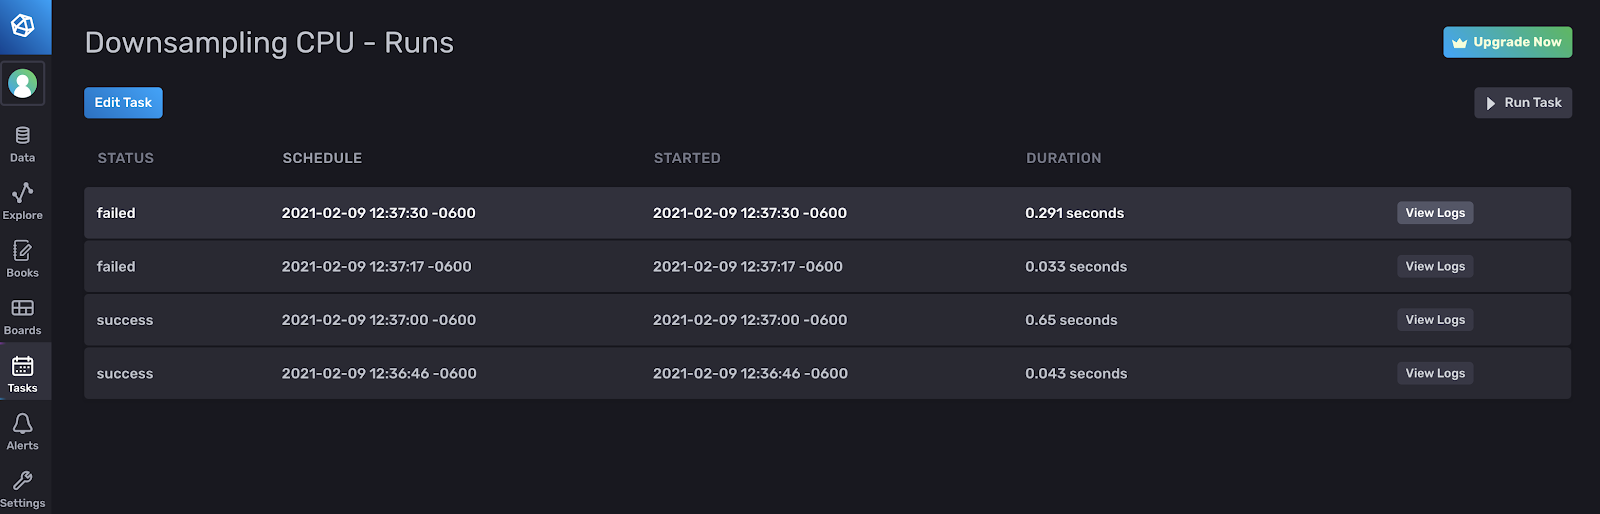
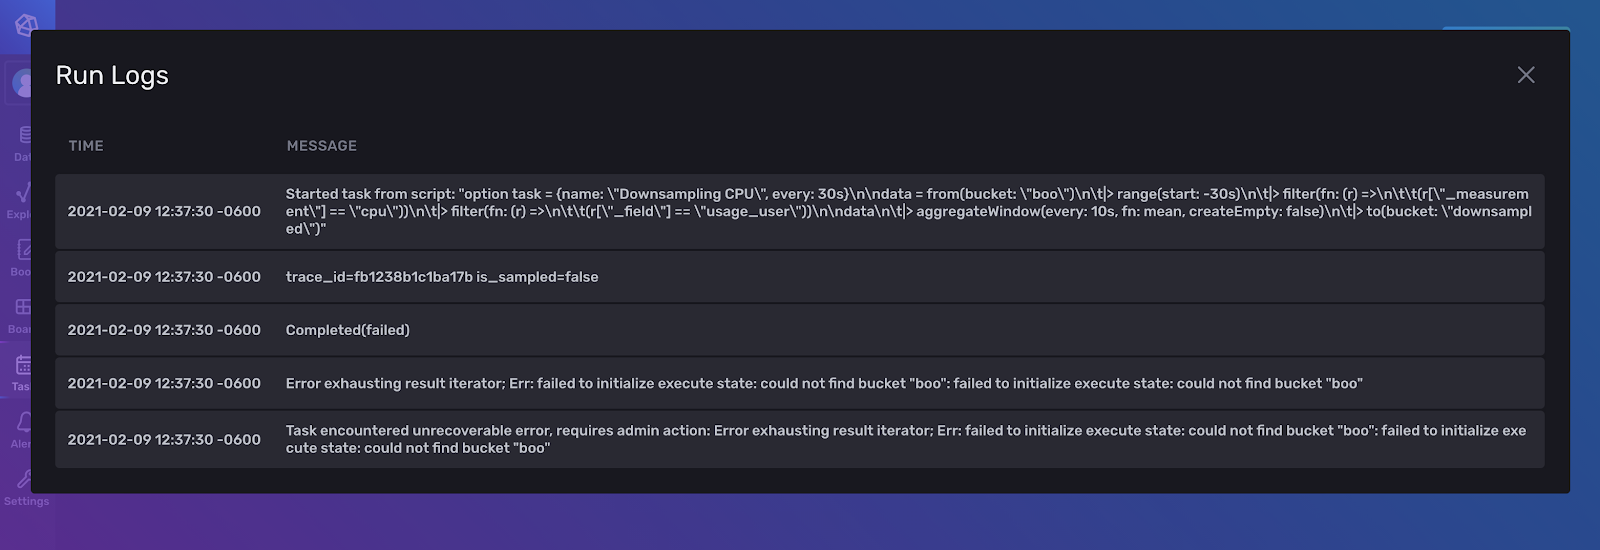
Here you can view a list of runs, when the task was scheduled to run, when it was executed, and the duration that it took the task to run. You can also view individual logs for each task run. Clicking on the View Logs button allows you to view the logs for each run. In the example below, I get the error “could not find bucket: “boo”: failed to initialize execute state”. This error helps me understand that I’m querying from a bucket that doesn’t exist in my InfluxDB Instance. I can now toggle my task to inactive, change the Flux script in my task to gather data from the correct bucket to address this issue, and finally toggle my task back to active.
- Run Task button: The Run Task button in the dropdown under the gear icon is also extremely useful. When testing a new task, I take one of two approaches. I either a) temporarily schedule the task to run very frequently to check the output or b) I simply click the Run Task button to run the task on demand instead.
Debugging tasks with the InfluxDB CLI
Many of the functionalities that exist in the UI also exist within the CLI. When using the InfluxDB CLI, it’s best to create a CLI configuration profile first, if you don’t already have one. If you need to create a CLI config for your InfluxDB Cloud account, then you’ll need to install the Influx CLI locally first.
Check out this TL;DR InfluxDB Tech Tips – How to Use the CLI Locally to Access the Flux REPL and Write a Regular CSV to InfluxDB Cloud for another example that demonstrates how to set up your configuration profile and highlights why CLI configurations are so useful.
Use the influx task retry-failed command to rerun a failed task with:
./influx influx task retry-failed --task-id <your task id>
Use the influx task run retry commands to rerun any task run with:
./influx task run retry --task-id <your task id> --run-id <your run id>
The easiest way to gather your Task ID is to find it underneath the Task name under the Tasks page in the UI.
 <figcaption> You can gather your Task ID from your lists of tasks</figcaption>
Finally, it’s worth knowing that CLI allows you to output the result as a JSON with the --json option. You can then pipe that JSON into jq, a lightweight command line JSON processor, to easily find failed runs. For example, you could find a failed task run ID’s with:
influx task run list --task-id <your task id> --json | jq -r '.[] | select(.status != "failed") | .idGeneral advice on tasks – use InfluxDB to monitor your tasks
InfluxDB is largely used for monitoring, so it’s a good idea to use InfluxDB to monitor your own tasks. Every time a check or task runs, the corresponding statuses, logs, runIDs, etc. are written to the _task system bucket. It’s a good idea to create an Alert to monitor mission-critical tasks and receive a notification with the task ID and run ID, so you can rerun the task. Here’s a task that looks for failed tasks. If you wanted to include the run ID as part of the task message, simply change line 37 to: ("The task: ${r.taskID} - ${r.name} - ${r.runID} - has a status of ${r.status}"). You can configure http and Slack notification endpoints through the UI. You can configure additional notification endpoints with custom Flux packages including Discord, Opsgenie, PagerDuty, Sensu, Telegram, and Microsoft Teams . Learn how to configure a custom notification endpoint with a Task and the Flux Telegram endpoint.
Final thoughts on task debugging and task monitoring
I hope this InfluxDB Tech Tips post inspires you to take advantage of InfluxDB to monitor and debug your own Tasks. If you are creating cool or unique Tasks, please ask us for help and share your story! Share your thoughts, concerns, or questions in the comments section, on our community site, or in our Slack channel. We’d love to get your feedback and help you with any problems you run into!
