TL;DR InfluxDB Tech Tips: Configuring Telegraf & Kapacitor When auth is Enabled on InfluxDB & Tips on Chronograf
By
Regan Kuchan
updated December 14, 2025
Product
Developer
Navigate to:
In this post, we recap some new material that you might have missed in the past week or so. Check in next week for the most interesting TICK stack related issues, workarounds, how-tos, and Q&A from GitHub, IRC, and the InfluxData Community.
Understanding Chronograf's status icon
Q: I’m using Chronograf to monitor my infrastructure and one of the status icons on the Host List page is red. What does this mean exactly?
My Host List page:
![]()
A: The status icon on Chronograf’s Host List page is a high-level measure of your hosts’ health. If Chronograf has not received data from a host’s Telegraf instance for the past minute, the status icon turns red. If Chronograf has received data from a host within the past minute, the status icon remains green.
On your Host List page, it looks like Chronograf hasn’t received Telegraf data from node-abode-02 for at least the past minute.
Configuring Telegraf and Kapacitor when authentication is enabled on InfluxDB
Q: I’m trying to connect a Telegraf instance and a Kapacitor instance to InfluxDB. I’ve enabled authentication on my InfluxDB instance and I get the following errors in the Telegraf and Kapacitor logs when I try to start those processes. How to I specify the authentication credentials in Telegraf and Kapacitor?
Log errors:
# Telegraf
InfluxDB Output Error: {"error":"unable to parse authentication credentials"}

# Kapacitor
run: open server: open service *influxdb.Service: failed to link subscription on startup: unable to parse authentication credentials
A: Specify your InfluxDB username and password in the Telegraf and Kapacitor configuration files. On most systems, Telegraf’s configuration file is located at /etc/telegraf/telegraf.conf and Kapacitor’s configuration file is located at /etc/kapacitor/kapacitor.conf. I’ve printed out the relevant configuration settings below. Once you’ve updated those files, just start the Telegraf and Kapacitor processes and you’re good to go!
Telegraf configuration file:
[[outputs.influxdb]]
  ## The full HTTP or UDP endpoint URL for your InfluxDB instance.

  [...]

  username = "administer" #????
  password = "supersupersecret" #????
Kapacitor configuration file:
[[influxdb]]
  # Connect to an InfluxDB cluster
  # Kapacitor can subscribe, query and write to

  [...]

  username = "administer" #????
  password = "supersupersecret" #????
Introducing Chronograf's visualization types
Q: I’m thinking about using Chronograf to create a dashboard; what visualization types do you support?
A: Currently, Chronograf supports five visualization types: line, stacked, step-plot, singleStat, and line+stat.
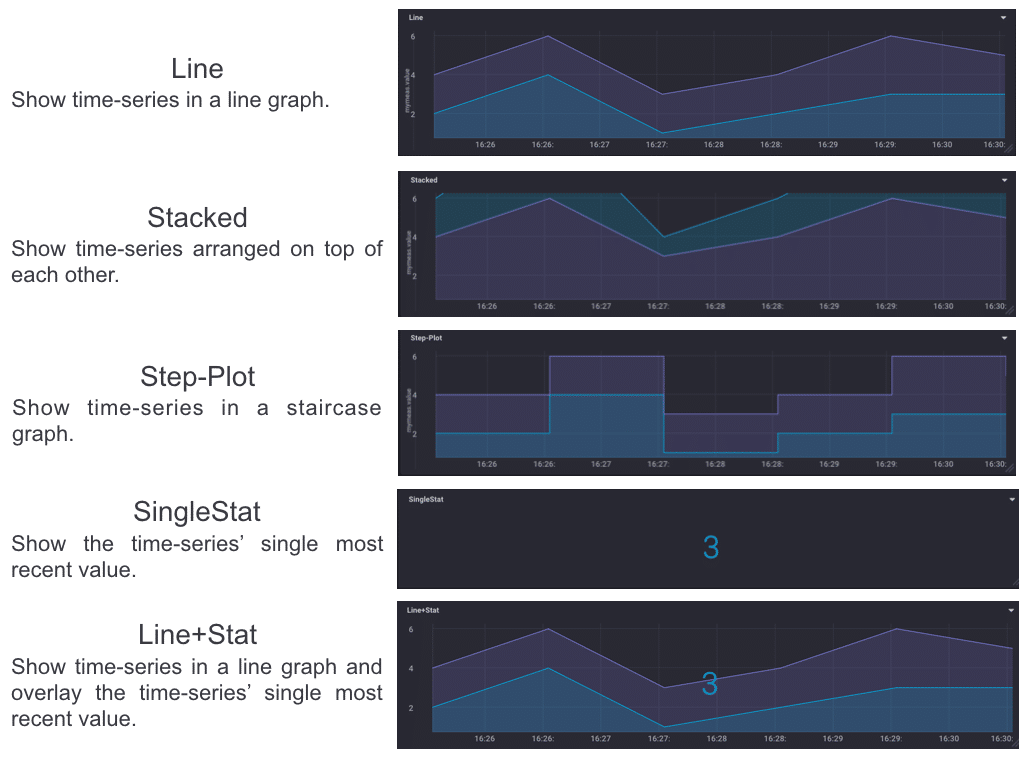
Check out Chronograf’s FAQ page for more information about our visualization types and the Create a Dashboard guide to get started with your customized dashboard!
What's next:
- Downloads for the TICK-stack are live on our "downloads" page.
- Deploy on the Cloud: Get started with a FREE trial of InfluxDB Cloud featuring fully-managed clusters, Kapacitor and Grafana.
- Deploy on Your Servers: Want to run InfluxDB clusters on your servers? Try a FREE 14-day trial of InfluxDB Enterprise featuring an intuitive UI for deploying, monitoring, and rebalancing clusters, plus managing backups and restores.
- Tell Your Story: Over 300 companies have shared their story on how InfluxDB is helping them succeed. Submit your testimonial and get a limited edition hoodie as a thank you.
