TL;DR InfluxDB Tech Tips — Time Series Forecasting with Telegraf
By
Anais Dotis-Georgiou
updated December 14, 2025
Use Cases
Product
Developer
Navigate to:
If you’re familiar with Telegraf, you know that you can easily configure this lightweight collection agent with a single TOML configuration file to gather metrics from over 180 inputs and write data to a wide variety of different outputs and/or platforms. You might also know that Telegraf can act as a processor, aggregator, parser, and serializer. For example, you might even be familiar with the Starlark Processor Plugin that gives you the ability to perform various mathematical operations in Telegraf.
Needless to say, Telegraf is pretty awesome. But did you know that you can also use Telegraf to perform forecasting on your time series data? The Telegraf Execd Processor Plugin is a processor plugin that makes Telegraf extensible in any language, allowing you to process your data however you need. In this blog post, we’ll learn how to use this plugin to continuously generate forecasts and perform anomaly detection. The repo that accompanies this tutorial can be found here. This blog is a recap of Anais’ (me) and Steven’s (a senior software engineer on the Telegraf team) November 2020 InfluxDays talk.
About the Telegraf Execd Processor Plugin
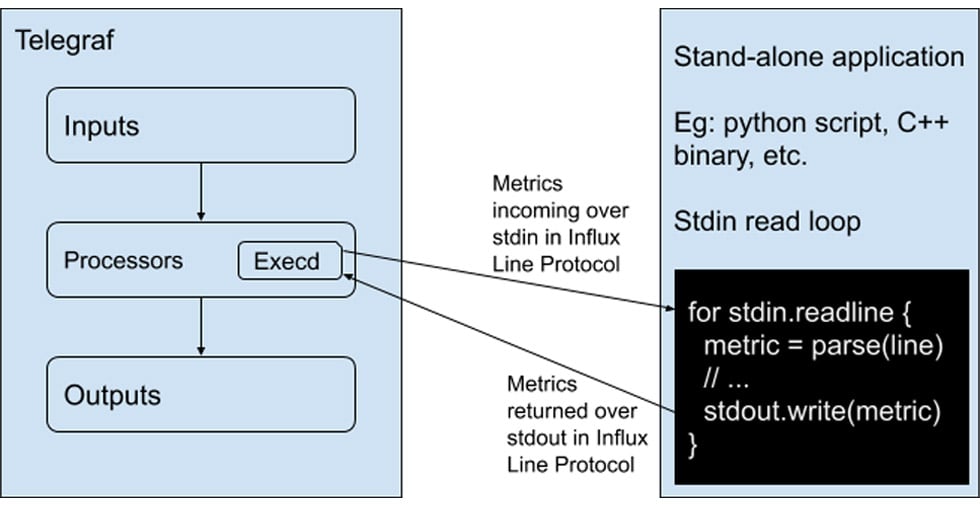
The Execd processor plugin runs an external program as a separate process, pipes metrics into the process’s STDIN, and reads processed metrics from its STDOUT. The programs must accept influx line protocol on standard in (STDIN) and output metrics in InfluxDB line protocol to standard output (STDOUT). You can use the Telegraf Execd Go Shim to build and contribute your own external input, processor, and output plugin. Take a look at the external Telegraf plugins for a list of the external plugins that are already available to you.
Program output on standard error is mirrored to the telegraf log.
The example.py script in the repo is a simple example of using the Execd processor plugin to read STDIN and print the metrics to STDOUT with Python.
It looks like this:
# A simple processor. It reads stdin and writes it to stdout.
import sys
def main():
   for line in sys.stdin:
       print(line.rstrip())
       sys.stdout.flush()

if __name__ == '__main__':
   main()
The telegraf configuration for the Execd Processor Plugin that executes the simple example.py script looks like this:
[[processors.execd]]
 command = ["python", "./processors/forecasting.py"]
Dataset and time series forecasting objective
The dataset for this tutorial comes from Luke, an InfluxData Engineer, who uses InfluxDB to monitor his beer brewing setup at home. The dataset contains temperature data for two beers, “haze_v5” and “bv_1”, early in their fermentation processes.
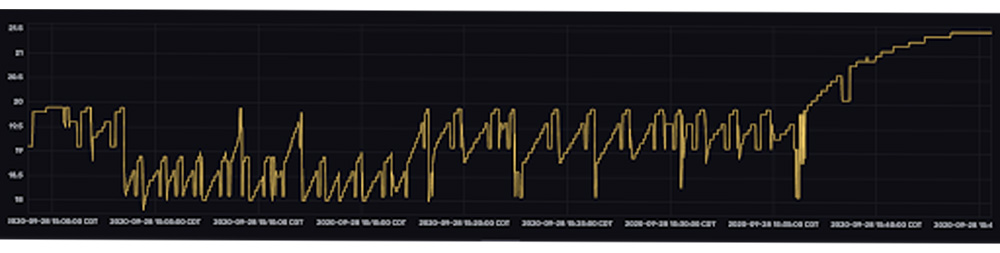
At this early point in fermentation it’s important that the temperature remain constant. However, you can see that temperature fluctuates frequently. While a variety of sources cause fluctuations in temperature, Luke can help minimize those fluctuations by adding ice to a bucket that supplies a cold water stream to his brewing setup. This cold water stream is the primary temperature regulator. With this in mind, the forecasting procedure was selected to help Luke maintain a constant fermentation temperature. A few considerations were kept in mind when making an algorithm selection that would help him do this:
- Temperature fluctuations appear almost immediately in the dataset. This means we have to use an algorithm that doesn't require a lot of data for training.
- Forecasts should be accurate for long enough in the future for Luke to respond to the fluctuations in temperature, giving him enough time to add or remove ice from his brewing setup (~10min into the future).
- We want to detect anomalous spikes in temperature that may indicate attention is needed or equipment failure.
With these considerations in mind, we chose to use double exponential smoothing. Exponential smoothing algorithms meet our requirements because:
- The algorithm can emit forecasts with as little as 10 points.
- The algorithm generates good predictions for short forecast periods.
- The algorithm doesn't require seasonality in the data – which the data is lacking.
- The algorithm is computationally efficient. We make forecasts every 10 seconds on a minibatch of data. We don't want the algorithm to cause a bottleneck.
We decided we’d also calculate the residuals and write those to InfluxDB as well with the Telegraf Execd Processor Plugin. This way, if Luke desires, he can monitor the residuals and set an alert for when the data deviates significantly from the forecast. The forecasts and residuals calculation are implemented in forecasting.py and forecasting2.py. The differences between those two scripts are slight adjustments in the implementation of double exponential smoothing, as described here. Specifically, forecasting.py implements the exponential trend (or multiplicative) version of double exponential smoothing while forecasting2.py implements the linear trend (or additive) version. Two forecasts with different versions of double exponential smoothing were used to compare the accuracy of each for the fun of experimentation.
Advantages of using the Telegraf Execd Processor Plugin for time series forecasting
Using the Telegraf Execd Processor Plugin for forecasting offers several advantages. The primary advantage is that this implementation is extremely responsive. A forecast is generated with every new point that is being written to InfluxDB.
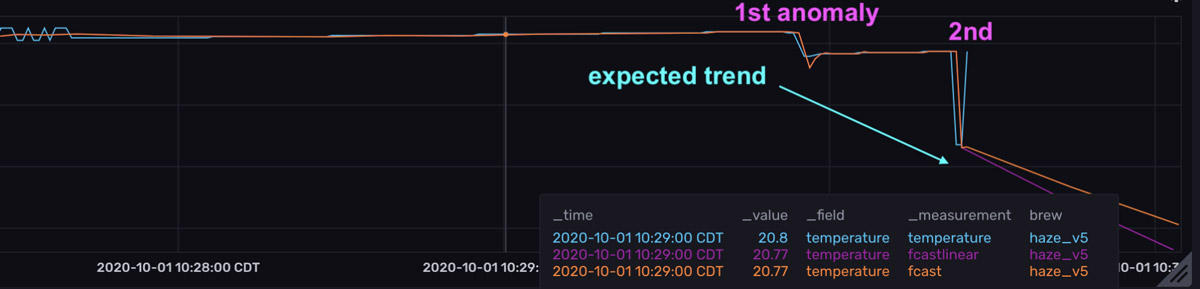
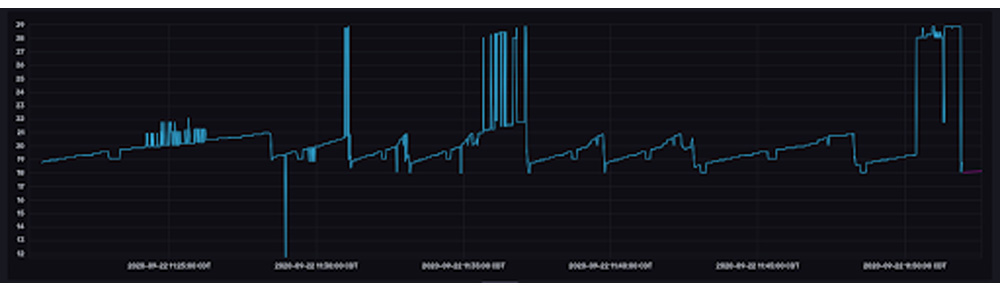
Because forecasts are made with every point that is written to InfluxDB, the forecasts appear to be copying the raw data. However, if you look at the last point in the top graph, you can see that the forecasts predict that the temperature will continue to decrease (the orange and pink lines take a sharp dive to the bottom right) – a prediction that is the result of a recent dip in temperature (marked by the 1st anomaly).
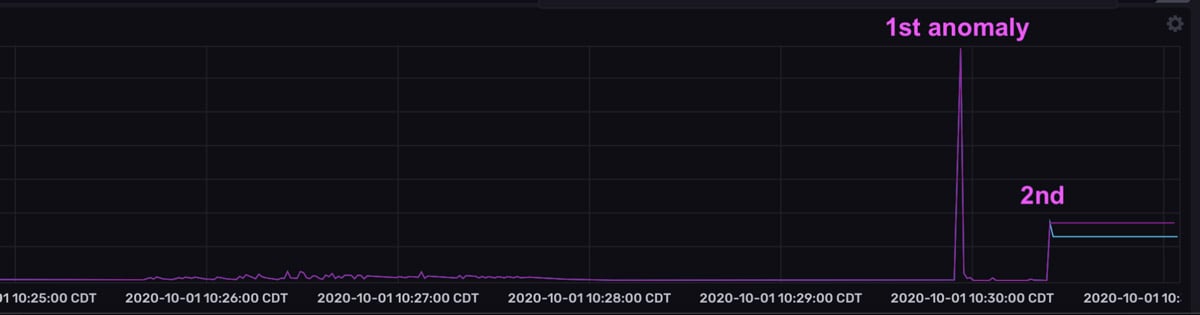
However, the actual temperature increases suddenly. The forecasts are wrong, and the residuals are high. It’s worth noting that although the second anomaly is a more drastic drop in temperature, this drop is contextualized by the 1st drop or temperature anomaly, which is why the residuals aren’t as large as they were for the first anomaly. Also notice that the 1st anomaly in the residuals graph exists for a short duration. The quick drop in the residuals is evidence that the forecasts are so responsive to new input data. It would be very unexpected to see a spike in residuals for an extended period of time.
In this way, continuously generating new forecasts and monitoring the residuals provides you more visibility into how the system is behaving in real time. In turn, it allows you to be more responsive to anomalies.
Secondly, you might be asking, “what’s the advantage of using the Execd processor plugin instead of running a cron job?” First it’s worth mentioning that you can use Telegraf to run a script like a cron job with the Telegraf exec input plugin. This plugin works great if you need to run an external process infrequently and can afford to restart an external process multiple times. However, if you need to process several thousand points of data frequently in a batch operation, then you want to use the Execd Processor Plugin because it runs an external process once, saving you startup costs.
Final thoughts about forecasting and anomaly detection with Telegraf
I hope this InfluxDB Tech Tips post inspires you to take advantage of the Telegraf Execd Processor Plugin to generate forecasts and perform anomaly detection. If you are using this plugin or are thinking of contributing your own external plugin, please ask us for help and share your story! If you are looking to contribute your own external plugin, open a pull request to add it to the External Telegraf Plugins. Share your thoughts, concerns, or questions in the comments section, on our community site, or in our Slack channel. We’d love to get your feedback and help you with any problems you run into! Finally, if you enjoyed this content, I encourage you to register for the next InfluxDays!
