TL;DR InfluxDB Tech Tips How to Extract Values, Visualize Scalars, and Perform Custom Aggregations with Flux and InfluxDB
By
Anais Dotis-Georgiou
updated December 14, 2025
Product
Use Cases
Developer
Navigate to:
In this post, we learn how to use the reduce(), findColumn(), and findRecord() Flux functions to perform custom aggregations with InfluxDB.
This TL;DR assumes that you have either registered for an InfluxDB Cloud account – registering for a free account is the easiest way to get started with InfluxDB – or installed InfluxDB 2.0 OSS.
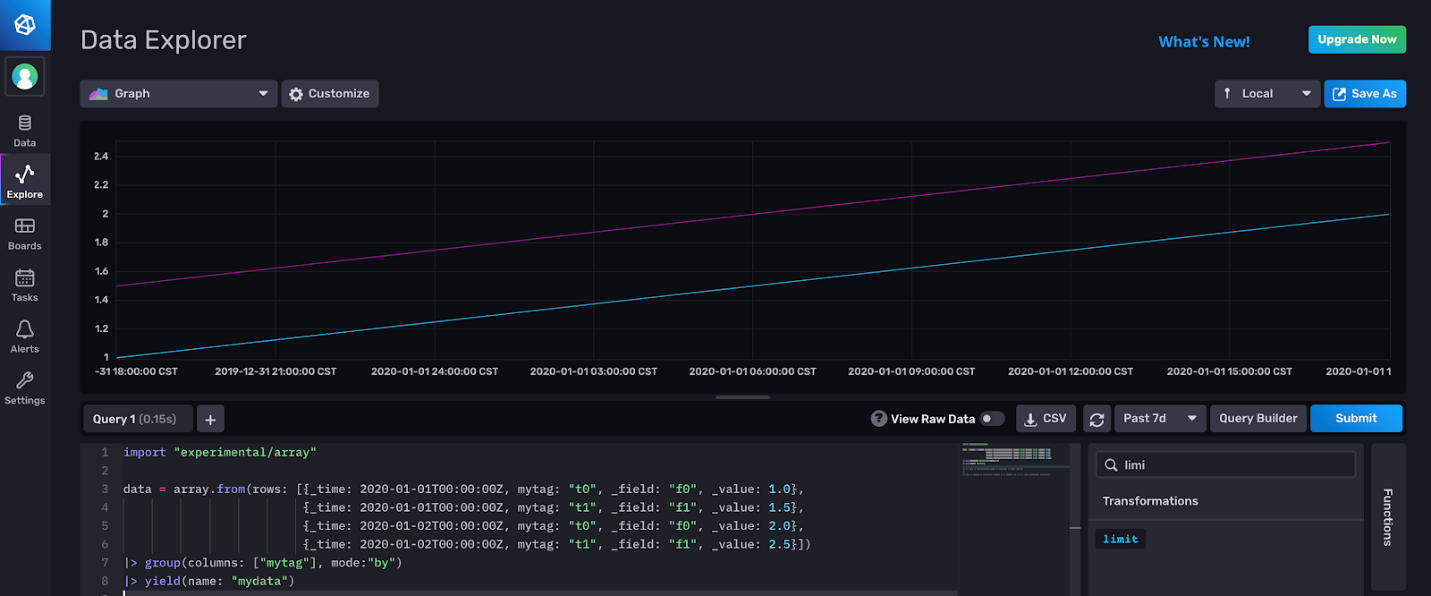
In order to easily demonstrate how these functions work, let’s use the array.from() function to build an ad hoc table to use in the query:
import "experimental/array"

data = array.from(rows: [{_time: 2020-01-01T00:00:00Z, mytag: "t0", _field: "f0", _value: "1.0"},
{_time: 2020-01-02T00:00:00Z, mytag: "t1", _field: "f1", _value: "1.5"},
{_time: 2020-01-02T00:00:00Z, mytag: "t0", _field: "f0", _value: "2.0"},
{_time: 2020-01-01T00:00:00Z, mytag: "t1", _field: "f1", _value: "2.5"}])
|> group(columns: ["mytag"], mode:"by")
|> yield(name: "mydata")
The array.from() function creates one table from a list of objects. Group by tag to split the table up into two tables to better represent what your data would look like if you were writing your data via line protocol or with Telegraf. Please read this TL;DR if you want to learn more about InfluxDB’s output format, Annotated CSV.
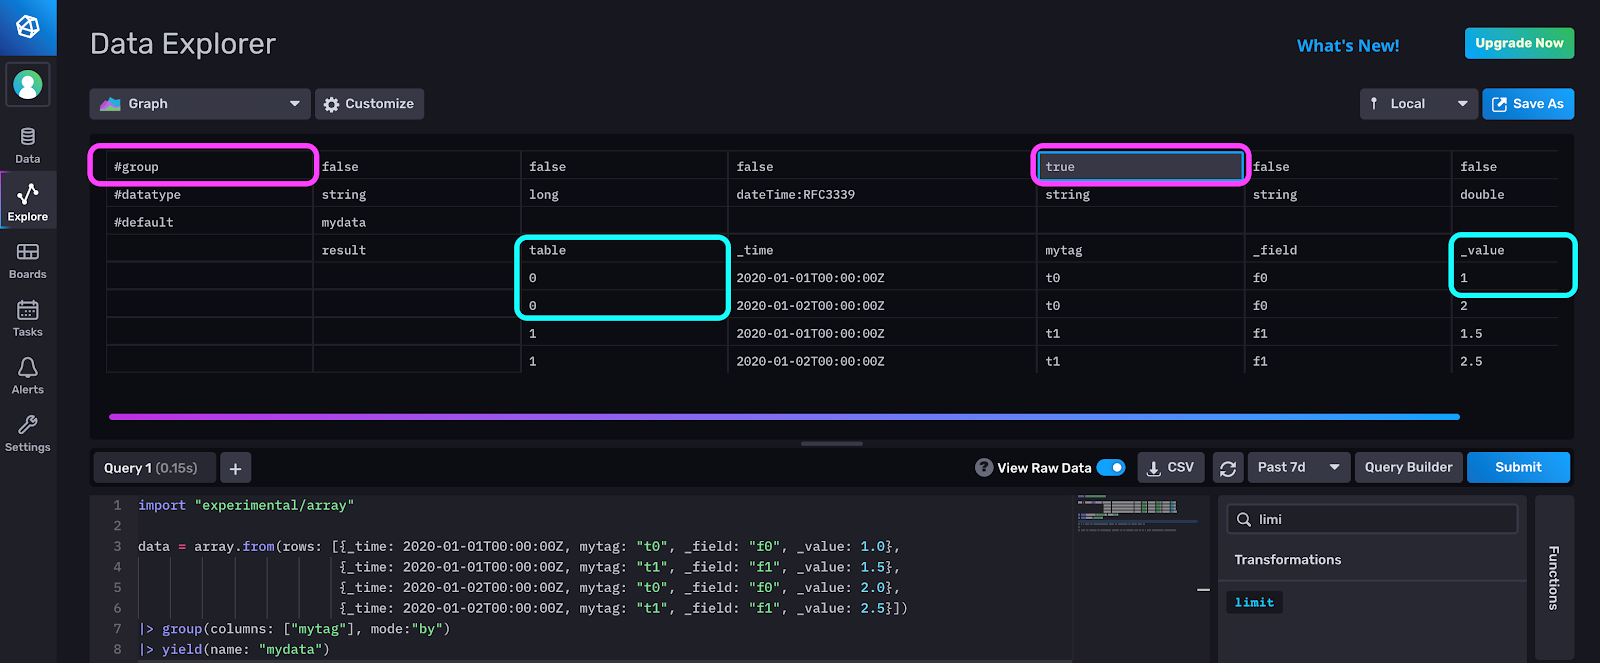
Q: What does findRecord() do? A: The findRecord() function returns a record at a specified index from the first table in a stream of tables. It expects a key argument that represents a group key in the input stream. For example, let’s take a close look at the output of the above Flux script in the raw data view. Notice that the group key is set to true for the “mytag” column. This is because we grouped by “mytag”, so it is part of the group key. We will use this key in our findRecord() function call. Also note that we have two tables. The value in the first row of table 0, our first table, in the “_value” column is equal to 1.0.
We use findRecord in the following script:
import "experimental/array"
data = array.from(rows: [{_time: 2020-01-01T00:00:00Z, mytag: "t0", _field: "f0", _value: 1.0},
{_time: 2020-01-01T00:00:00Z, mytag: "t1", _field: "f1", _value: 1.5},
{_time: 2020-01-02T00:00:00Z, mytag: "t0", _field: "f0", _value: 2.0},
{_time: 2020-01-02T00:00:00Z, mytag: "t1", _field: "f1", _value: 2.5}])
|> group(columns: ["mytag"], mode:"by")
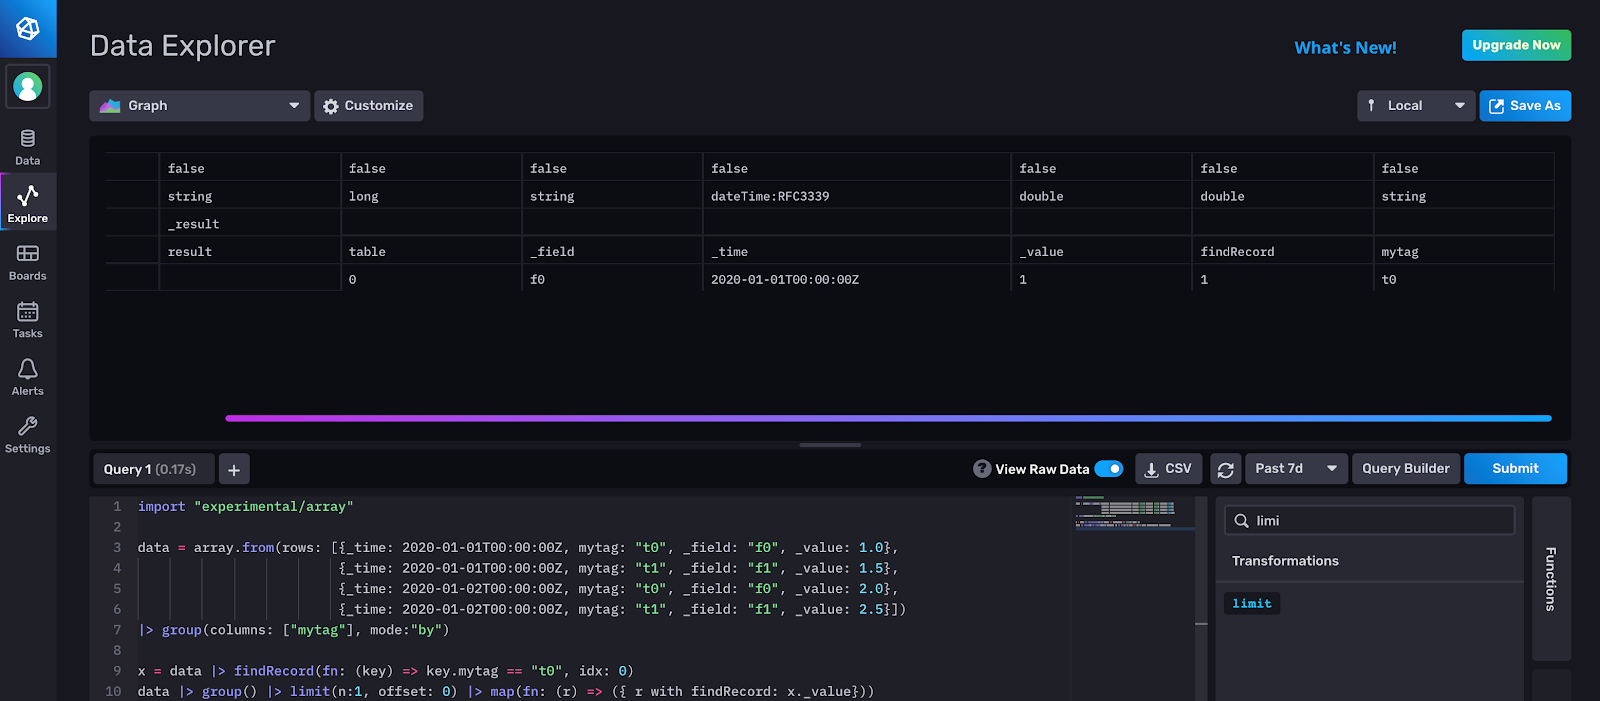
x = data |> findRecord(fn: (key) => key.mytag == "t0", idx: 0)
data |> group() |> limit(n:1, offset: 0) |> map(fn: (r) => ({ r with myRecord: x._value}))The variable x returns the first row, idx:0 of the first table, table 0, where the “mytag” column is part of the group key and key is equal to “t0”. In other words, x._value = 1.0.
The final line of this script is explained in the following section.
Q: How can I visualize scalars with InfluxDB? A: You can’t visualize scalars with InfluxDB UI. The InfluxDB UI only visualizes tables. However, you can write a line of Flux to append a new column to your table and include your scalar value to visualize it within the context of your data. The final line in the script enables you to visualize the output of findRecord, and verify that you returned the correct row. We group all the data together and limit our output to one row so we can map the scalar value from findRecord() in a new column labeled as “findRecord”. You can also use array.from() to construct a new table to visualize your scalar value.
While you can’t visualize scalars in the UI, you can take advantage of other tools to print scalars. I encourage you to try using the Flux REPL, where you can print scalars. Also if you’re a Visual Studio user, please check out the Visual Studio Flux extension where you can print scalars as well.
Note: If you have a strong need to visualize scalars in the UI out of the box, we want to know! Please provide product feedback as feature requests or share your thoughts in community.
Q: How can I use the findRecord() if I’ve already filtered for my data completely and returned the desired output? A: If you’ve already used Flux to prepare your data into your desired shape, set the key equal to true to obtain records like so:
import "experimental/array"

data = array.from(rows: [{_time: 2020-01-01T00:00:00Z, mytag: "t0", _field: "f0", _value: 1.0},
{_time: 2020-01-01T00:00:00Z, mytag: "t1", _field: "f1", _value: 1.5},
{_time: 2020-01-02T00:00:00Z, mytag: "t0", _field: "f0", _value: 2.0},
{_time: 2020-01-02T00:00:00Z, mytag: "t1", _field: "f1", _value: 2.5}])
|> group(columns: ["mytag"], mode:"by")
|> filter(fn: (r) => r.mytag == "t0")


x = data |> findRecord(fn: (key) => true, idx: 0)
data |> group() |> limit(n:1, offset: 0) |> map(fn: (r) => ({ r with myRecord: x._value}))
Notice that in this example we filter for the “t0” tag before applying the findRecord() function instead of applying this filter within the findRecord() function.
Q: Can you share a practical example of using findRecord? A: To answer this question, imagine that you’re working with geotemporal data. Specifically, you’re analyzing earthquakes globally. First you want to find the largest earthquake on the last day. Utilizing the Flux Geo package allows you to find the coordinates of the largest earthquake in the past 24 hours:
import "experimental/geo"
max_earthquake =
from(bucket:"Earthquake")
|> range(start: -24h)
|> filter(fn: (r) => r._measurement == "geo")
|> geo.toRows()
|> group()
|> max(column: "mag")
|> findRecord(fn: (key) => true, idx: 0)
Notice that we’ve already filtered our data down to a single value by using the max() function. We don’t want to perform additional grouping or filtering, so we set the findRecord() key argument to true to easily return the coordinates of the largest earthquake as a scalar. Now that we have isolated the coordinates of the largest earthquake location, we can look at all the seismic activity in a 200km region surrounding the largest earthquake to gain more insights into the incident by passing in those coordinates into the following query:
from(bucket:"Earthquake")
|> range(start: -7d)
|> geo.filterRows(region: {lat: max_eq.lat, lon: max_eq.lon, radius: 200.0}, strict: false)
|> group()
|> count(column: "mag")
This query gives us a count of the total amount of earthquakes within a 200km radius of the largest earthquake.
Q: What does findColumn() do? A: The findColumn() function is similar to the findRecord() function except that it returns an array of values in a specified column from the first table in a stream of tables where the group key values match the specified predicate. The following Flux script would generate the same results as above, but uses findColumn() instead:
import "experimental/array"

data = array.from(rows: [{_time: 2020-01-01T00:00:00Z, mytag: "t0", _field: "f0", _value: 1.0},
{_time: 2020-01-01T00:00:00Z, mytag: "t1", _field: "f1", _value: 1.5},
{_time: 2020-01-02T00:00:00Z, mytag: "t0", _field: "f0", _value: 2.0},
{_time: 2020-01-02T00:00:00Z, mytag: "t1", _field: "f1", _value: 2.5}])
|> group(columns: ["mytag"], mode:"by")

x = data |> findColumn(fn: (key) => key.mytag == "t0", column: "_value")
data |> group() |> limit(n:1, offset: 0) |> map(fn: (r) => ({ r with myRecord: x[0]}))
Q: What does reduce() do? A: The reduce() function aggregates records in each table according to the reducer, fn, providing a way to create custom aggregations. The output for each table is the group key of the table with columns corresponding to each field in the reducer record. Here’s an example that calculates the sum of all the values in the “_value” column.
import "experimental/array"
data = array.from(rows: [{_time: 2020-01-01T00:00:00Z, mytag: "t0", _field: "f0", _value: 1.0},
{_time: 2020-01-01T00:00:00Z, mytag: "t1", _field: "f1", _value: 1.5},
{_time: 2020-01-02T00:00:00Z, mytag: "t0", _field: "f0", _value: 2.0},
{_time: 2020-01-02T00:00:00Z, mytag: "t1", _field: "f1", _value: 2.5}])
|> group(columns: ["mytag"], mode:"by")
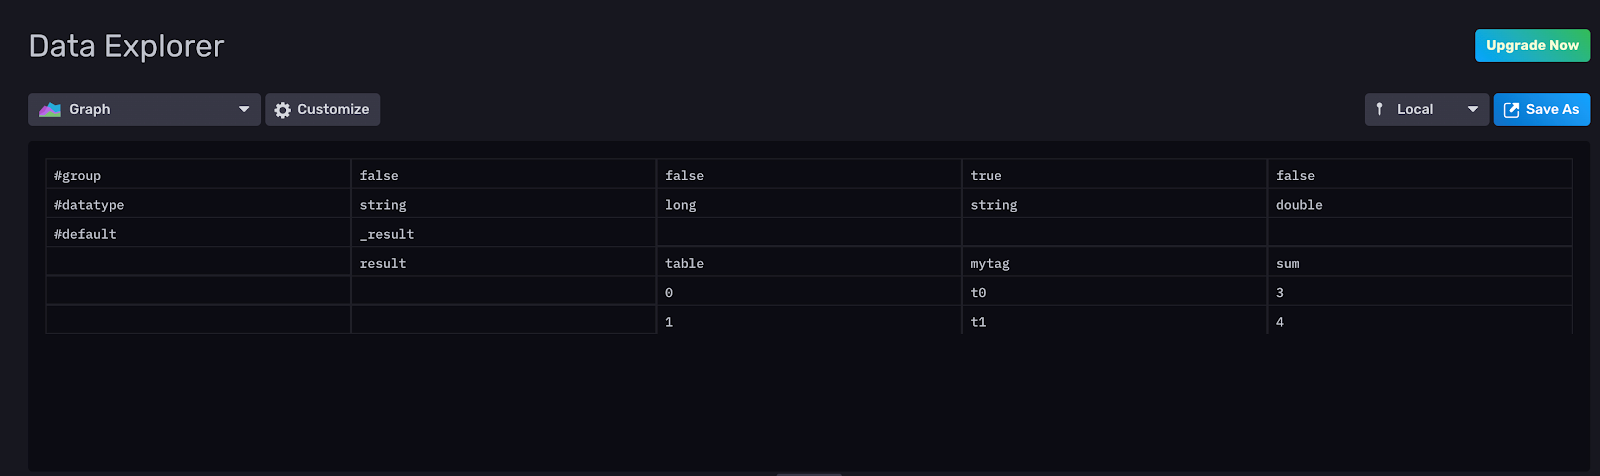
data
|> reduce(fn: (r, accumulator) => ({ sum: r._value + accumulator.sum }), identity: {sum: 0.0})Here’s the output:
Q: How can I use reduce() and findRecord() or findColumn together? A: The findRecord() and reduce() functions are frequently used together to perform custom aggregations. Let’s walk through an example of how to use the two functions together. We use the reduce() function to find the sum of the values in the “_value” column of each table and then we use findRecord() to extract the first sum. Now we can use this sum with a map() function to do additional calculations.
import "experimental/array"
data = array.from(rows: [{_time: 2020-01-01T00:00:00Z, mytag: "t0", _field: "f0", _value: 1.0},
{_time: 2020-01-01T00:00:00Z, mytag: "t1", _field: "f1", _value: 1.5},
{_time: 2020-01-02T00:00:00Z, mytag: "t0", _field: "f0", _value: 2.0},
{_time: 2020-01-02T00:00:00Z, mytag: "t1", _field: "f1", _value: 2.5}])
|> group(columns: ["mytag"], mode:"by")
x = data
|> reduce(fn: (r, accumulator) => ({ sum: r._value + accumulator.sum }), identity: {sum: 0.0})
|> findRecord(fn: (key) => key.mytag == "t0", idx: 0)
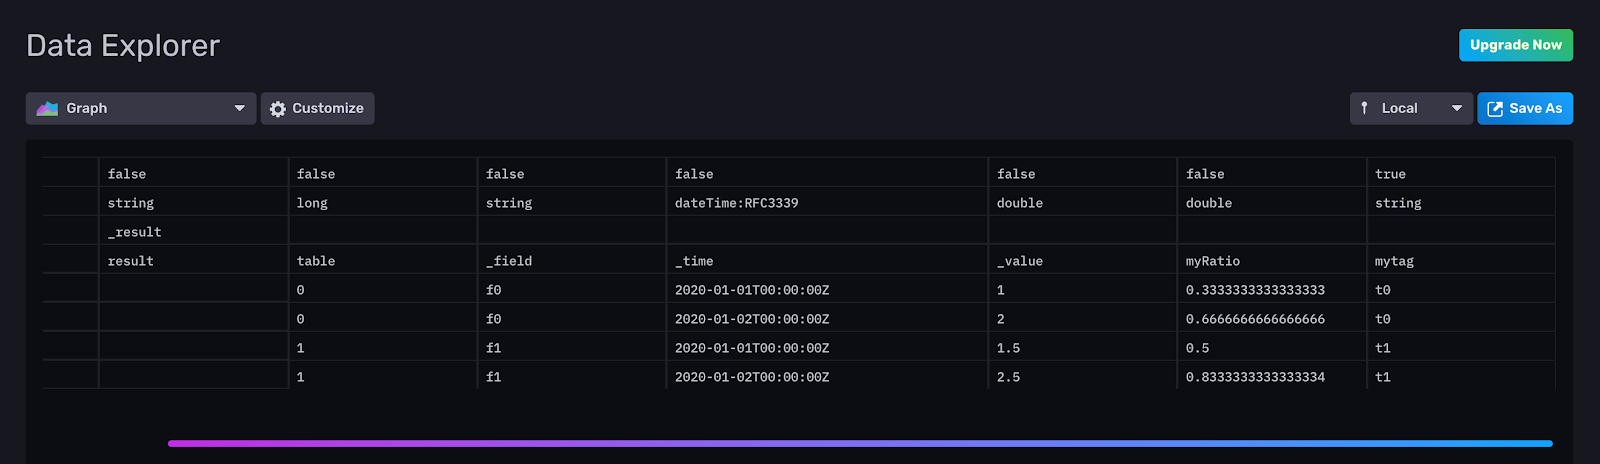
data
|> map(fn: (r) => ({ r with myRatio: r._value/x.sum}))The sum of the values in the first column is equal to 3. The “myRatio” column describes the ratio between each value in the “_value” column and the sum, where x.sum=3. Here is the corresponding output:
I hope this tutorial helps you understand how to use the findRecord, findColumn, and reduce() functions better. As always, if you run into hurdles, please share them on our community site or Slack channel. We’d love to get your feedback and help you with any problems you run into.
