TL;DR InfluxDB Tech Tips — Using Tasks and Checks for Monitoring with InfluxDB
By
Anais Dotis-Georgiou
updated December 14, 2025
Product
Use Cases
Developer
Navigate to:
In this post, we learn how to use tasks in combination with checks for monitoring with InfluxDB.
Q: What is the monitoring workflow for InfluxDB? A: According to the documentation, the monitoring workflow involves the following steps:
- A check in InfluxDB queries data and assigns a status with a
_levelbased on specific conditions. - InfluxDB stores the output of a check in the
statusesmeasurement in the_monitoringsystem bucket. - Notification rules check data in the
statusesmeasurement, and based on conditions set in the notification rule, send a message to a notification endpoint. - InfluxDB stores notifications in the
notificationsmeasurement in the_monitoringsystem bucket.
Q: What resources are available to me for monitoring with Flux and InfluxDB? A: Here is a list of resources that might be useful to you if you’re looking to monitor your data with InfluxDB:
- Monitor data and send alerts: contains general information for how to monitor your time series with Flux.
- Monitor states: contains general information on how to monitor states.
- Flux InfluxDB Monitor Package: details the functions of Flux Package for monitoring which includes a function for sending notifications to an endpoint. If you're interested in learning more about notifications and alerting, please check out this Flux Discord Package as well.
Q: What is the difference between a check and an alert? A: A check queries your data in InfluxDB and applies a status to it. An alert is the notification that gets sent to your notification endpoint, based on your notification rules.
Q: How do you create a check? A: You can create a check through the UI. Let’s create a check on the percentage of mem available for our system. Here are the steps for creating a check.
-
-
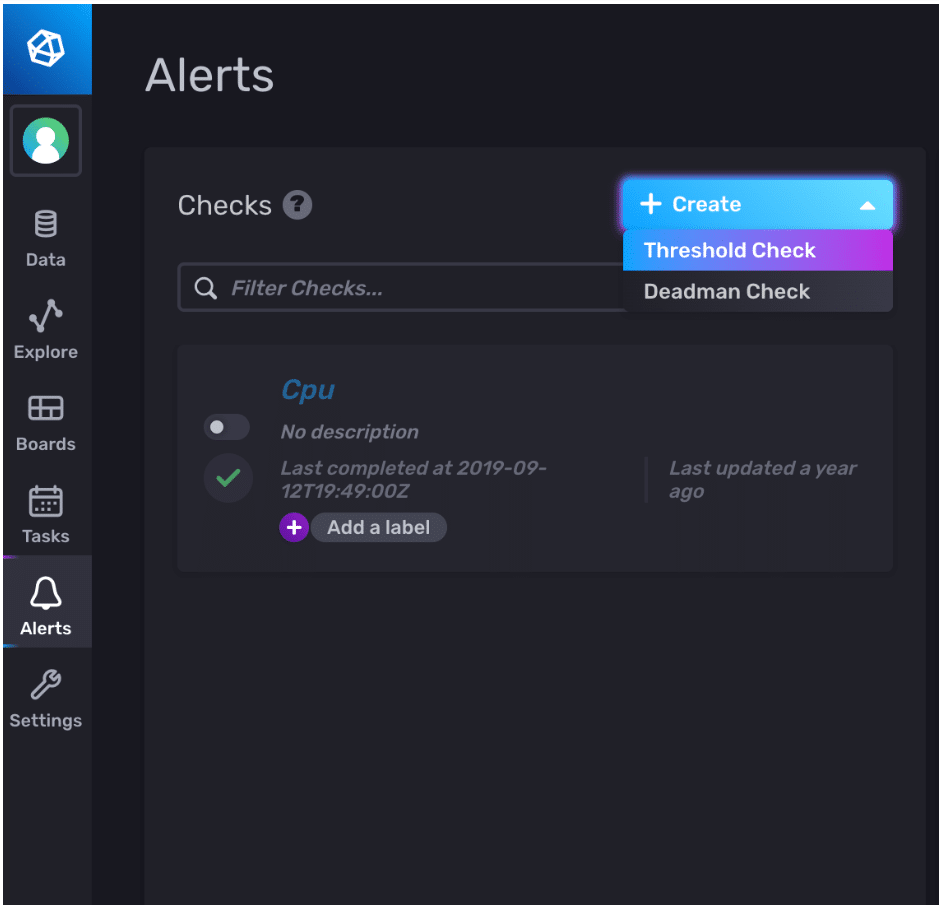
- Navigate to the Alerts tab in the UI and create a new check. In this example, we'll be creating a Threshold check. However, you also have the option to create a Deadman check as well.
 2. Name your check, "mem available percentage". Use the Data Explorer to select the fields you want to create a check on. Apply an aggregation function to the data. Here we're monitoring the max value of the percentage of mem available every 15s.

Step 1 for creating a check. Defining a query and applying an aggregation to it. 3. Configure your thresholds. Since we're monitoring the available percentage, I set my check status to "CRIT" when my system has less than 20% mem available. I set my check status to "WARN" when my system has between 20%-30% mem available (if you look closely, you'll see I defined the "WARN" status when the mem available is between 20.5% and 29.5% to allow you to easily visualize the thresholds). Although the configuration is not pictured here, I set my check status to "OK" when my system has more than 30% mem available. Finally, I can click the green check in the upper right corner to create my check.-
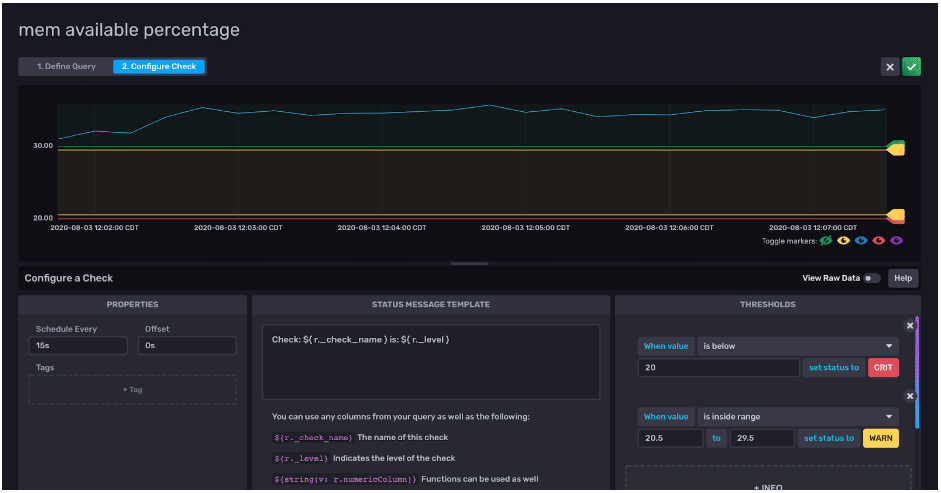
Step 2 for creating a check. Configuring the check. "CRIT" (red line), "WARN" (yellow line), and "OK" (green line) statuses configured for mem percent available.
-
- Navigate to the Alerts tab in the UI and create a new check. In this example, we'll be creating a Threshold check. However, you also have the option to create a Deadman check as well.
_levelcolumn? A: Navigate to the default_monitoringbucket in your InfluxDB instance and filter for your check ID or check name to view the results.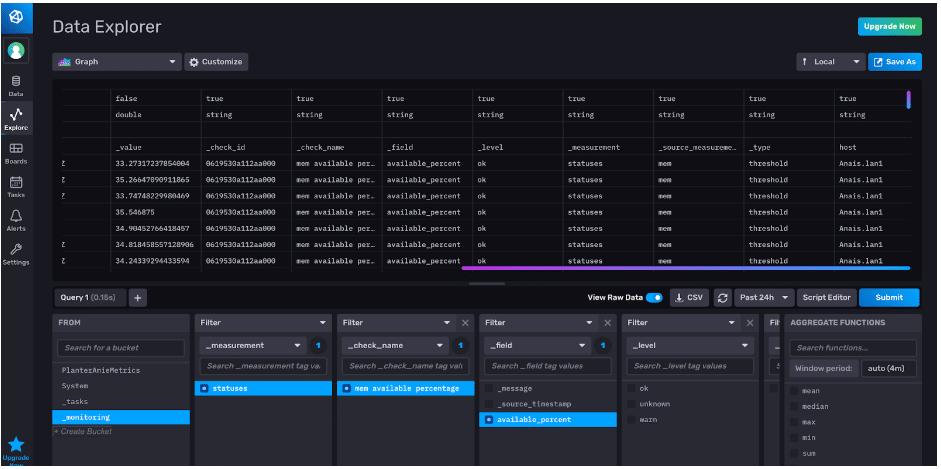
Viewing the output of the check Q: A threshold check or deadman check isn't useful to me at the moment. I need to perform data transformation first in order to be able to take advantage of this. What do I do? A: You can create a task to transform your data first and write the output to a new bucket or measurement. Then you can create a check on your transformed data. For example, let's say you want to alert on power levels that exceed a certain value, but you only have current and voltage data. In order to create a check on power, you first need to run a task to calculate the power from the voltage and current. Create a task with these steps:-
- Navigate to the task tab.
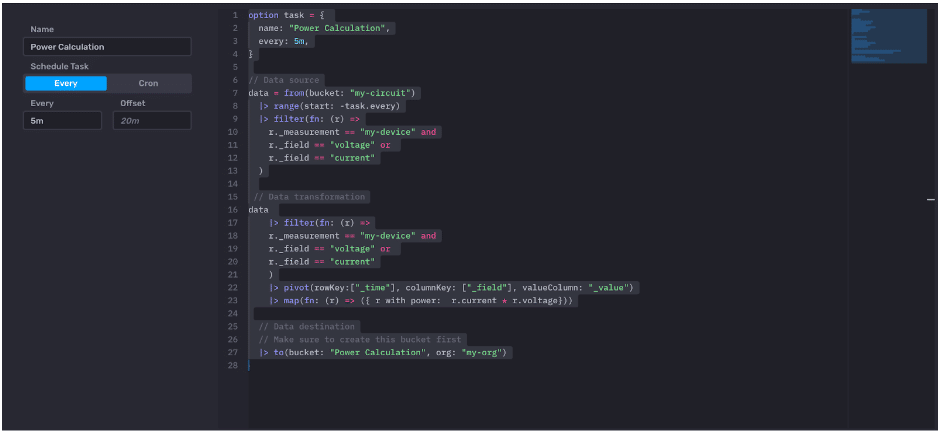
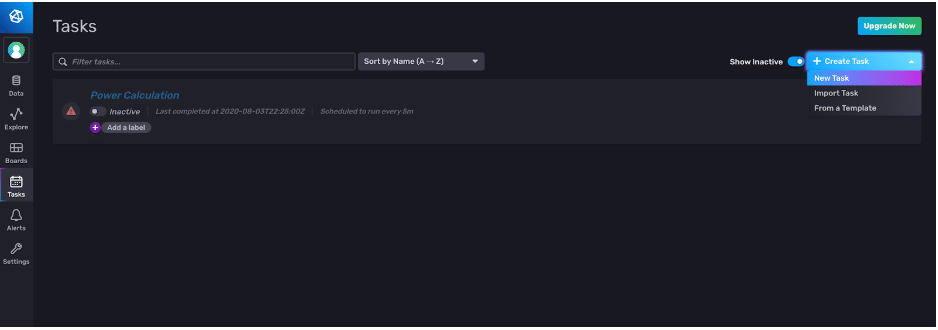 2. Write your task. Include the task configuration options, the data source, and the destination. Make sure you have created a destination bucket prior to writing a task. The to() function doesn't generate new buckets. In this example, we're creating a task to calculate the power from the current and voltage. Now that we have created this task, we create a check to alert us when the power level is too high or too low.
- Navigate to the task tab.
Now if you need to alert on when the battery is discharging, you can create a check that filters your data for whenfrom(bucket: "solar") |> range(start: -task.every) |> filter(fn: ® => r["_measurement"] == "battery") |> filter(fn: ® => r["_field"] == "kWh") |> derivative(unit: 3s, nonNegative: false, columns: ["_value"], timeColumn: "_time") |> map(fn: ® => ({ r with _battery_level: if r._value > 0.0 then "CH" else "DH" }))|> filter(fn: ® => r["_level"] == "DH")and when the value is less than 0. Correlate the check status with your custom status by creating the following message:Check: ${ r._check_name } is:${string(v: r._battery_level)}The use of Flux String Interpolation here is redundant because our_battery_levelis already a string. However, I included it to demonstrate how you can convert a field type to include the value in your message if you need. Important Note: If you use this workflow for custom statuses, please make sure not to label your custom status column with_levelas that is reserved for check statuses. Q: I need to add more than 4 statuses for my check. What do I do? A: Unfortunately, you can't add more than 4 statuses in one check. However, you can always create a new check to include more statuses. For example, you can separate the checks with informative names that distinguish statuses based off of tags or threshold levels. Again, I encourage you to take advantage of notification messages to bring clarity to your alerts. Note: If this approach feels cumbersome and you're interested in a feature enhancement that allows you to add more than 4 statuses for one check, please comment on this issue #19208. -