Adding Support for Zipkin and Tracing to Telegraf and InfluxDB
By
Ayrdrie Palmer
updated December 14, 2025
Product
Developer
Navigate to:
Why Tracing?
Everyone seems to be adopting a microservice architecture to support their continuous delivery initiatives. Compared to traditional monolithic architectures, a microservice architecture allows you to build your application from a suite of small, modular services which run as unique processes, allowing you to make changes without compromising the entire application. This is exciting as it allows for faster and better delivery of code, but it also increases in complexity, since several unique and diverse services could be the cause of failure and it may not be clear what is the root cause. What is needed is a way to visualize production systems at the microservice level to understand how and why a system misbehaves.
To accomplish this, developers need to see the errors that happen in each service and between the services, and one new way to do this is with tracing. Tracing allows you to detect the whole path of how these services interact. Without tracing, developers had to review per process metrics and logs to detect bugs in their code, then try to figure out the relationships between things to determine the root case. And the more advanced the services become, those formerly simple strategies become complex and tedious. InfluxData recognized a need to simplify troubleshooting in microservice platforms and decided to add tracing functionality into the Zipkin Telegraf plugin.
What Is Tracing ?
Before we get into our plugin, we need to review what Tracing is. Tracing, or a trace, tells the journey of a transaction as it propagates through a distributed system. It is a directed acyclic graph (DAG) of “spans.” Within these spans are identifiers that provide information about a specific span. Such identifiers are things like ID, name, type, and duration that help identify the relationships between each span, thus creating a trace. A trace can be used in many cases. Often a process will slow down during the day and it can be hard to detect why there was a sudden change in duration. Tracing is a perfect solution to track latency, analysis, communication, and other errors by identifying the root cause. Here is a diagram showing the relationship between spans within a trace:

Zipkin
Zipkin is a distributed tracing system. It helps gather timing data needed to troubleshoot latency problems in microservice architectures. It manages both the collection and lookup of this data. Zipkin’s design is based on the Google Dapper paper. Zipkin uses Cassandra, MySQL, or Elasticsearch as a backend and we wanted to see if we could store the data in InfluxDB.
How We Implemented Tracing: as a Zipkin Telegraf Plugin
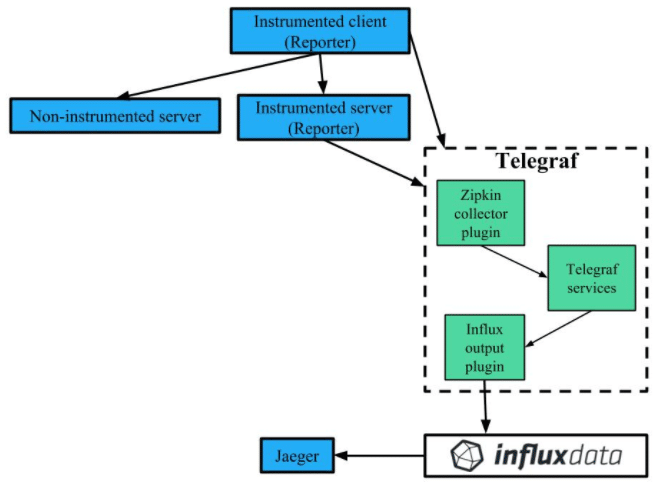
We took the data structure from Zipkin and implemented it into a new InfluxData Telegraf plugin. Telegraf plugins are built for collecting, processing, and writing metrics. This plugin gathers traces and time-stamped data needed to troubleshoot latency problems in microservice architectures. As such, the Zipkin plugin is a contained unit of code which runs a Zipkin http server in the background. It collects spans sent by tracing clients at regular intervals in the Zipkin data format, and converts them to Telegraf’s internal data format.
The plugin then writes the collected data to an InfluxDB database. InfluxDB receives the line protocol write requests from the Telegraf plugin, and stores them. We can then visualize the collected data using Jaeger’s UI.
Here's a diagram illustrating this process:
Configuration
The plugin accepts spans in JSON or thrift if the Content-Type is application/json or application/x-thrift, respectively. If Content-Type is not set, then the plugin assumes it is JSON format.
Tracing
This plugin uses Annotations tags and fields to track data from spans:
- TRACE: is a set of spans that share a single root span. Traces are built by collecting all Spans that share a traceId.
- SPAN: is a set of Annotations and BinaryAnnotations that correspond to a particular RPC.
- Annotations: for each annotation & binary annotation of a span a metric is output. Records an occurrence in time at the beginning and end of a request.
Tags:
- "id": The 64 bit ID of the span.
- "parent_id": An ID associated with a particular child span. If there is no child span, the parent ID is set to ID.
- "trace_id": The 64 or 128-bit ID of a particular trace. Every span in a trace shares this ID. Concatenation of high and low and converted to hexadecimal.
- "name": Defines a span
Fields:
- "duration_ns": The time in nanoseconds between the end and beginning of a span.
Example of a Query:
Get All Span Names for Service my_web_server
SHOW TAG VALUES FROM "zipkin" with key="name" WHERE "service_name" = 'my_web_server'This query returns a list containing the names of the spans which have annotations with the given service_name of my_web_server.
Future Plans
The plugin currently collects data through Telegraf and stores it in InfluxDB where queries can be run against it. This data then can be displayed with Jaeger, an OpenTracing compatible distributed tracing system inspired by Dapper and used for monitoring microservice-based architectures. InfluxData will be working to allow for trace visualizations with our own Chronograf visualization tool.
Benefits of InfluxData
Other distributed tracing systems combine both collection and user interface which is a nice feature until more than one system needs to be run. This causes extreme cardinality and makes the data very difficult to interpret. InfluxData addresses this problem by separating the collection and visualization into Telegraf and Chronograf, respectively. Both are simple to setup, and maintenance is almost nonexistent.
Next Steps
See these benefits for yourself by setting up InfluxData for free by downloading our open source software. We have detailed getting started steps available to help you setup this new plugin and will keep you posted on what new features we release in regard to this plugin.
