Tracking Real-Time Weather Updates
By
David G. Simmons
Product
Developer
Oct 13, 2017
Navigate to:
Not long ago I started wondering if I could use InfluxDB to track weather events in real-time. We’ve had more than a few significant weather events recentlynotably named Harvey, Irma and Maria and I wanted to see if I could do some tracking, and possibly alerting, of new tropical storm and hurricane events. It turns out that the National Hurricane Center provides live RSS/XML feeds of all the Atlantic Basin Tropical Cyclones (they have feeds of other areas as well). Perfect! Just what I’m looking for. I’ll walk you through how I set up the RSS Feed Reader, parsed the XML feed, and inserted the data into my InfluxDB instance. I’ll even show some of the dashboards I created to track these storms. I even decided to see if I could set up some Grafana dashboards so I’ll show you how to do that as well.
Getting the XML RSS Feed
The RSS Feeds are all listed on the National Hurricane Center’s page, so finding it was easy. Parsing it was a bit more challenging. I chose to use Node-Red again since it has some easy to use built-in data sources, one of which is an RSS Feed Reader. Here’s the entirety of my Node-Red flow:
![]()
Really simple, at least in terms of the flow. It turns out that the NOAA XML feed is fairly noisy, with some updates that are not really relevant, and don’t actually contain storm data. After looking at some of the feed results, I settled on the ‘Summary’ feed item as the best one to use in order to get useful storm data. I run the raw feed through a Switch node to grab just the ‘Summary’ updates, which is simple to set up.
Then comes the fun part. Parsing the actual XML from the feed. And it’s some busy XML!
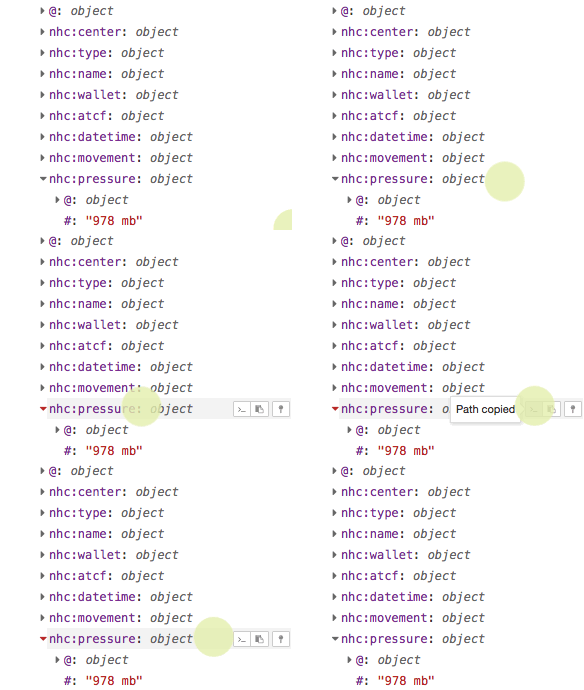
object
Yikes! Lots of nested objects, etc. In all of this though, I learned a nifty new Node-Red trick which I’ll share with you. In the ‘Debug’ portion of the window, if you drill down into the JSON object, and click on the little button tooltips would have been nice you can copy the entire path to that element.

I made heavy use of that feature to come up with the Parsing routine:
var myMsg = {};
    myMsg.payload = [];
    myMsg.payload[0] = {};
    myMsg.payload[1] = {};
    myMsg.payload[1].name = msg.article["nhc:cyclone"]["nhc:name"]["#"];
    myMsg.payload[1].type = msg.article["nhc:cyclone"]["nhc:type"]["#"];
    const center = msg.article["nhc:cyclone"]["nhc:center"]["#"].split(",");
    myMsg.payload[0].lat=parseFloat(center[0]);
    myMsg.payload[0].lng=parseFloat(center[1].trim());
    myMsg.payload[0].pressure=parseInt(msg.article["nhc:cyclone"]["nhc:pressure"]["#"].split(" ")[0]);
    myMsg.payload[0].move_dir=msg.article["nhc:cyclone"]["nhc:movement"]["#"].split(" ")[0];
    if(isNaN(parseInt(msg.article["nhc:cyclone"]["nhc:movement"]["#"].split(" ")[2]))) {
        myMsg.payload[0].move_speed=0;
    } else {
        myMsg.payload[0].move_speed=parseInt(msg.article["nhc:cyclone"]["nhc:movement"]["#"].split(" ")[2]);
    }
    myMsg.payload[0].wind_speed=parseInt(msg.article["nhc:cyclone"]["nhc:wind"]["#"].split(" ")[0]);
    return myMsg;
It’s actually important to check that the storm’s movement is really a number, because when a storm stalls, it is reported as “Stationary” for both the direction and the speed of movement, which won’t parse as an Integer.
I formatted the ‘payload’ as an array containing 2 objects because I’m going to let the Node-Red InfluxDB node insert the tags and values into the database for me. In order for that to work, the Payload has to contain this array of objects. The first object is the key-value pairs and the second object is the tags. My Object then looks like this:
Sending that to the InfluxDB Node causes those values and tags to be written to the database.
My New Storm Dashboards
Now that I’ve got the data streaming in, I decided to set up a Dashboard to see my data.

The graphs are not smooth due to the fact that the NHC only updates the data fairly infrequently, so for the vast majority of the time, the values don’t change much (I added fill(previous) to the query so that the displayed value would always be there. I can see at a glance that it’s not currently moving, has a sustained wind speed of 100 mph and a pressure of 973mbars.
You’ll notice from the data above that I’m also storing the Latitude and Longitude of the storm. I’m currently looking for a way to show that on a dashboard as well, possibly in a map.
Which Leads Me to Grafana
I decided to try out Grafana as a front-end to my data because a lot of our customers use it, and I’ve seen some pretty nice-looking dashboards made with it. Installing it was dead-simple:
$ brew install grafana
$ brew service start grafana
I had to set up my InfluxDB instance as a datasource, and then I could start building my dashboards. I didn’t find it quite as intuitive as Chronograf for Dashboards, frankly. But I did find a plugin for gauge-style elements, so I installed that. It’s called a D3Gauge, and it looks pretty neat for displaying windspeed:

What I found, however, is that if you have more than one of them, you’d better hope that they have the same scale of measurement:

I did try adjusting the scale of the second gauge, but apparently gauge-scale is system-wide, so changing it on one changed it for all, leaving me with a not-so-pretty dashboard after all.

Looking Ahead
I’m looking for other freely accessible real-time datasets that I can start pulling in to my InfluxDB instance to keep track of stuff, so if you have any suggestions, please do reach out to me either here, or on twitter @TechEvangelist1
