Tutorial: Modifying Grafana's Source Code
By
Jay Clifford
Aug 25, 2023
Developer
Navigate to:
This article was originally published on dev.to and is reposted here with permission.
A story of exploration and guesswork
So this blog is a little different from my usual tutorials…
A little background: I have been working with Jacob Marble to test and “demo-fy” his work with InfluxDB 3.0 and the OpenTelemetry ecosystem (If you would like to learn more, I highly recommend checking out this blog).
During the project, we identified a need to enable specific Grafana features for InfluxDB data sources, particularly the trace to logs functionality. Grafana is an open source platform, and one of its major advantages is the ability to modify its source code to suit our unique requirements. However, diving into the codebase of such a robust tool can be overwhelming, even for the most seasoned developers.
Despite the complexity, we embraced the challenge and dove headfirst into Grafana’s source code. We tumbled, we stumbled, and we learned a great deal along the way. And now, having successfully modified Grafana to meet our specific project needs, I believe it’s time to share this acquired knowledge with you all.
The purpose of this blog is not just to provide you with a step-by-step guide for tweaking Grafana’s source code, but also to inspire you to explore and adapt open source projects to your needs. It’s about imparting a method and a mindset, cultivating a culture of curiosity, and encouraging more hands-on learning and problem-solving.
I hope that this guide inspires you to modify Grafana’s source code for your projects, thereby expanding the horizons of what’s possible with open source platforms. It’s time to roll up your sleeves and venture into the depths of Grafana’s code.
The problem
So our problem lies within the Trace visualization of Grafana.
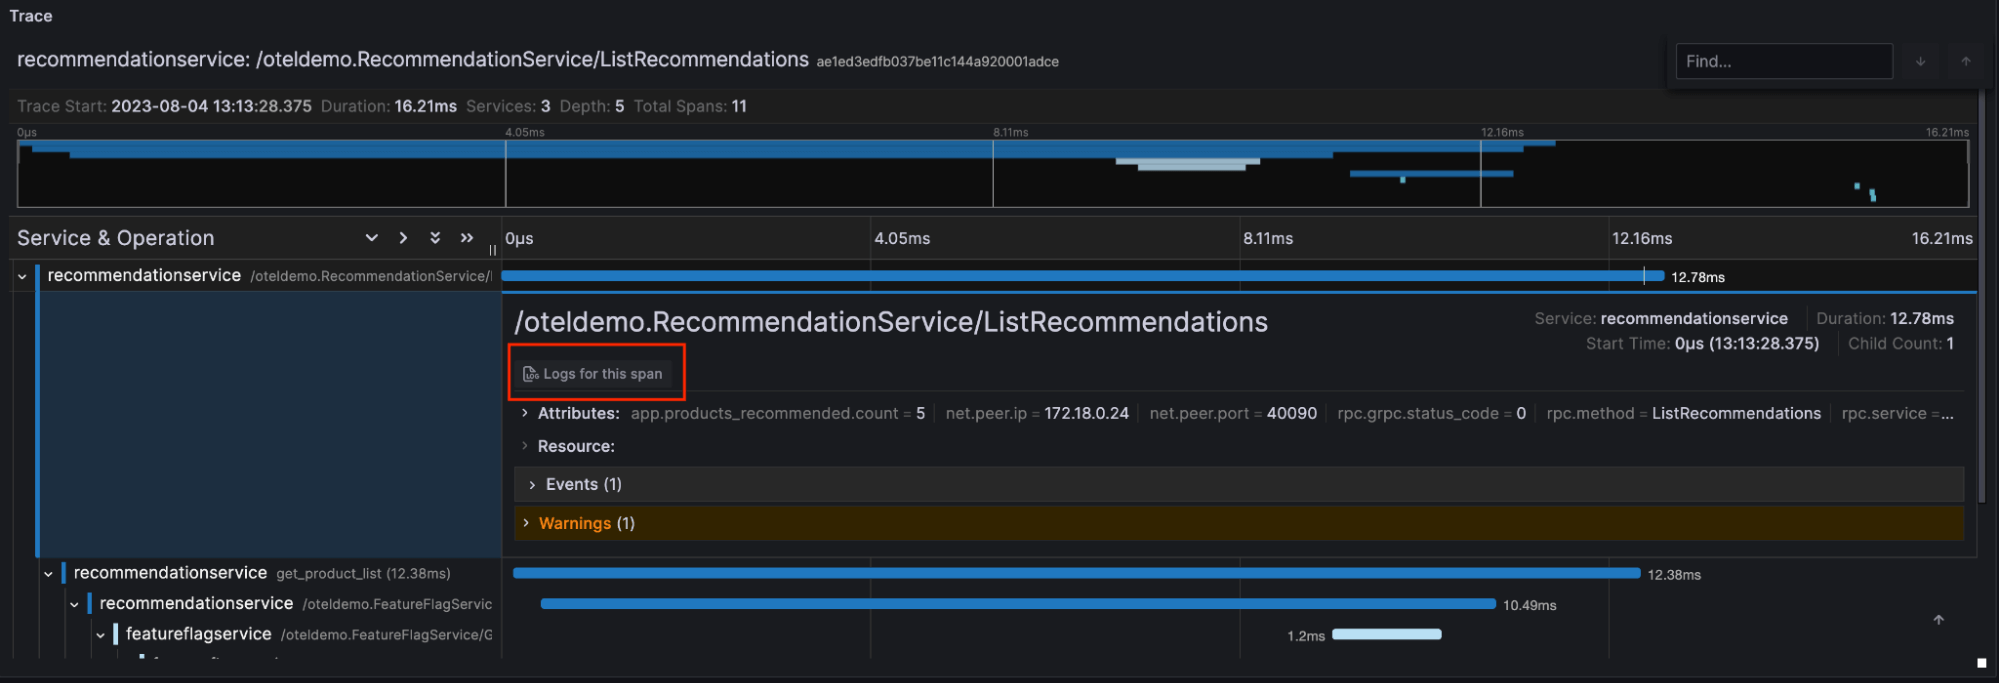
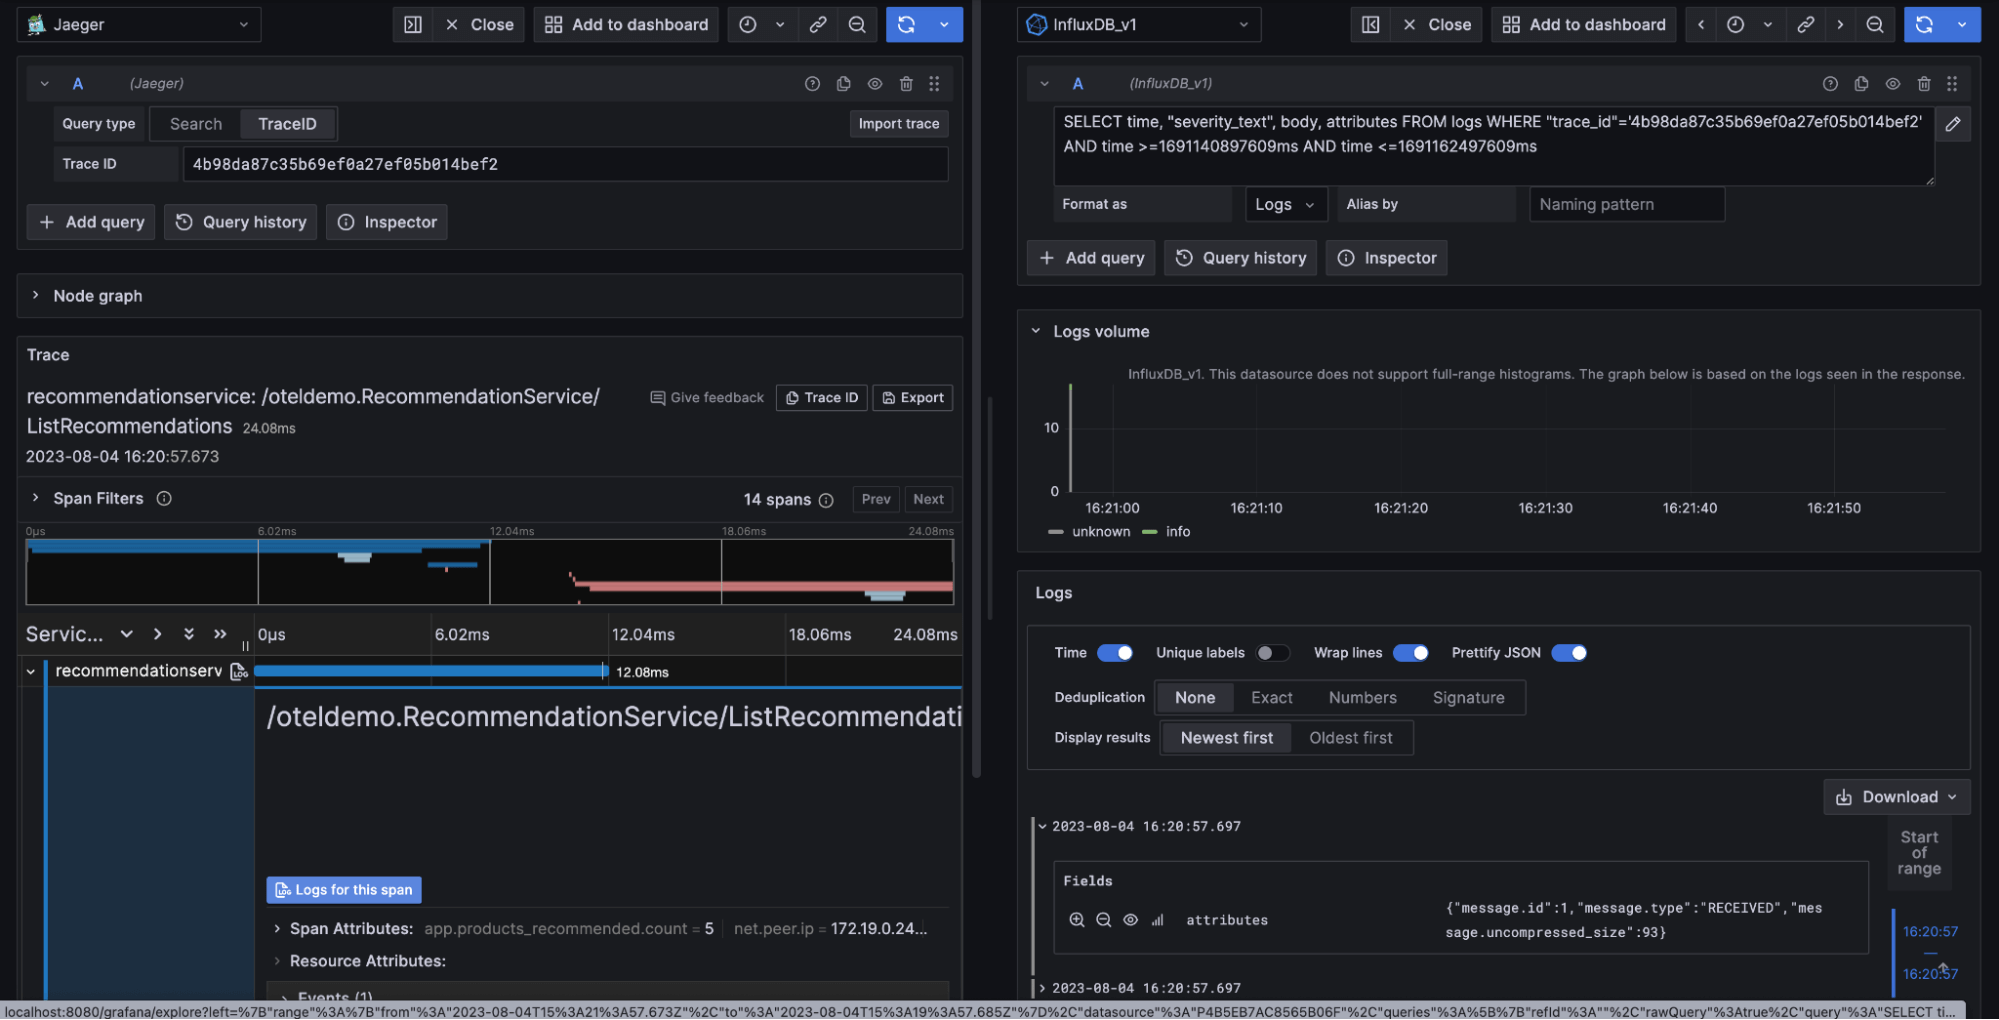
As you can see the visualization performs rather well with InfluxDB except for one disabled button: Logs for this span. If we don’t configure a log data source with our trace data source (in this case, Jaeger with InfluxDB 3.0 acting as the gRPC storage engine), then Grafana automatically disables this button. Grafana usually represents a log data source by default using the log explorer interface. Common log data sources include Loki, OpenSearch, and Elasticsearch. So let’s head across to the Jaeger data source and configure that…
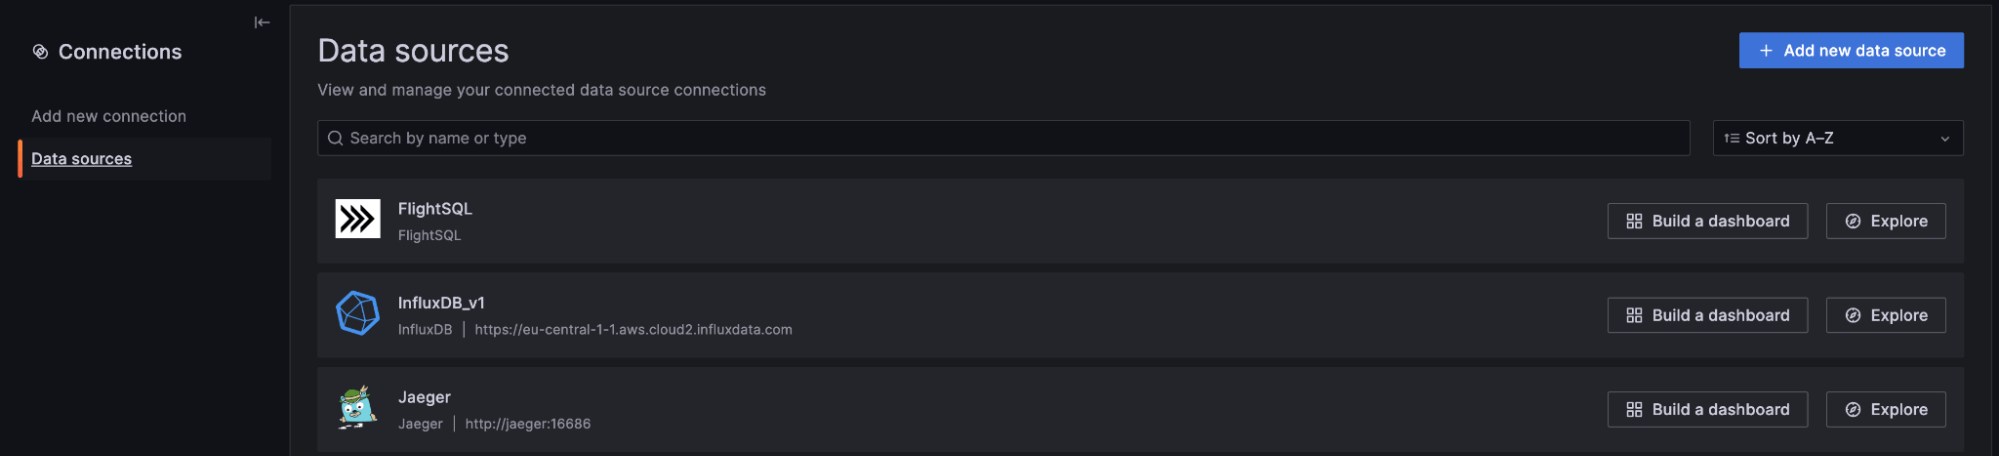
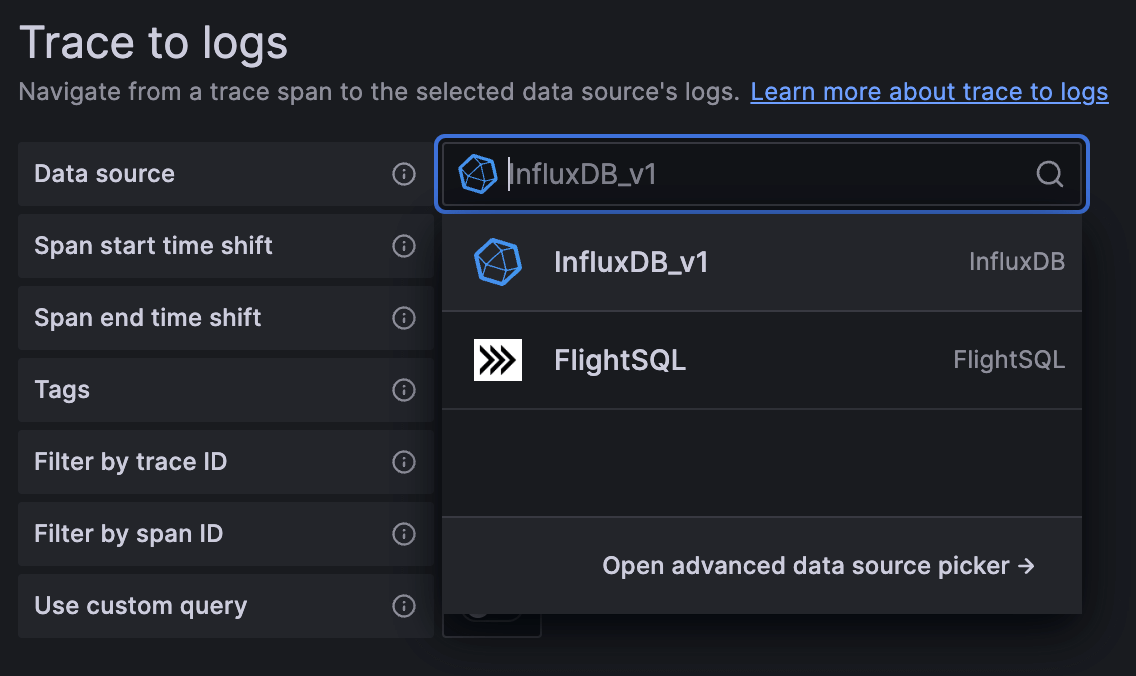
You can navigate data sources via Connections -> Data Sources. We currently have three data sources configured: FlightSQL, InfluxDB, and Jaeger. If we open the Jaeger configuration and navigate to the Trace to Logs section we want to be able to select either InfluxDB or FlightSQL as our Data source.
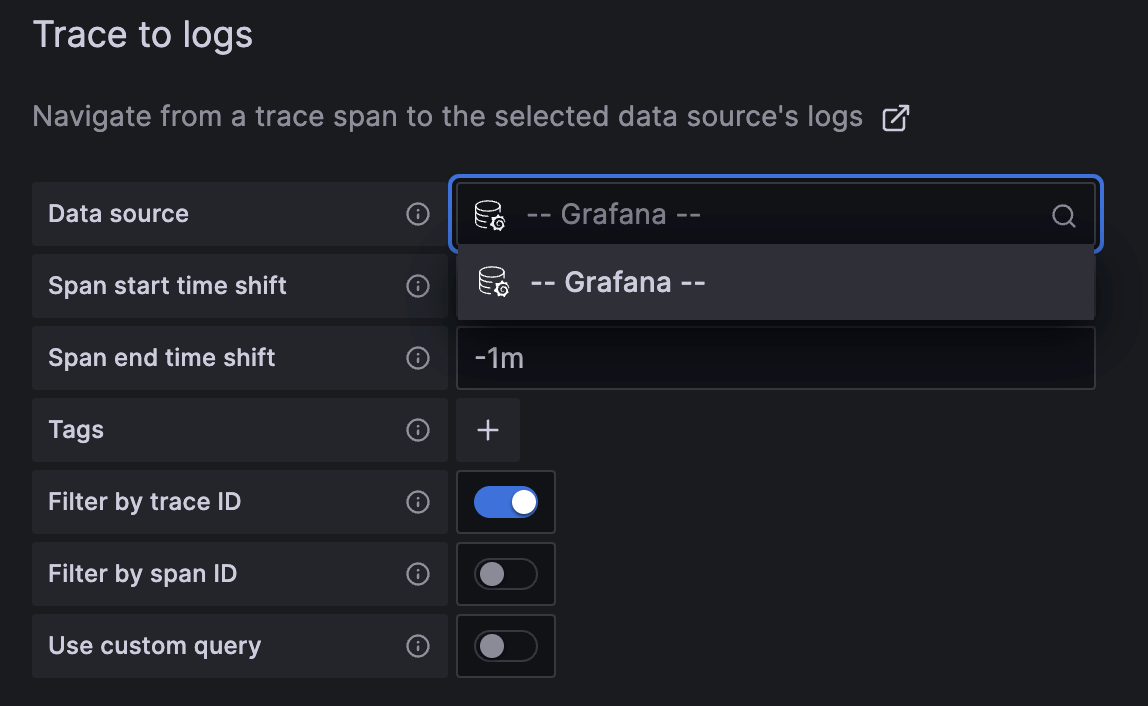
Houston, we have a problem. It appears Grafana doesn’t recognize InfluxDB as a log data source. Fair enough. InfluxDB only recently became a viable option for logs. So, what are our options?
- We lie down, accept the issue, and hope that in the future this feature becomes generic enough to support more data sources.
- Take action and make the change ourselves.
Well, by now you know what option we chose.
The solution
This section summarizes the steps I took to discover the changes I needed to make, how to implement the changes for your own data source, and, finally, how to build your own custom build of Grafana OSS.
Discovery
So the first step is to understand where to even begin. Grafana is a huge open source platform with many components so I needed to narrow down the search. So the first thing I did was search the Grafana repository for signs of life.
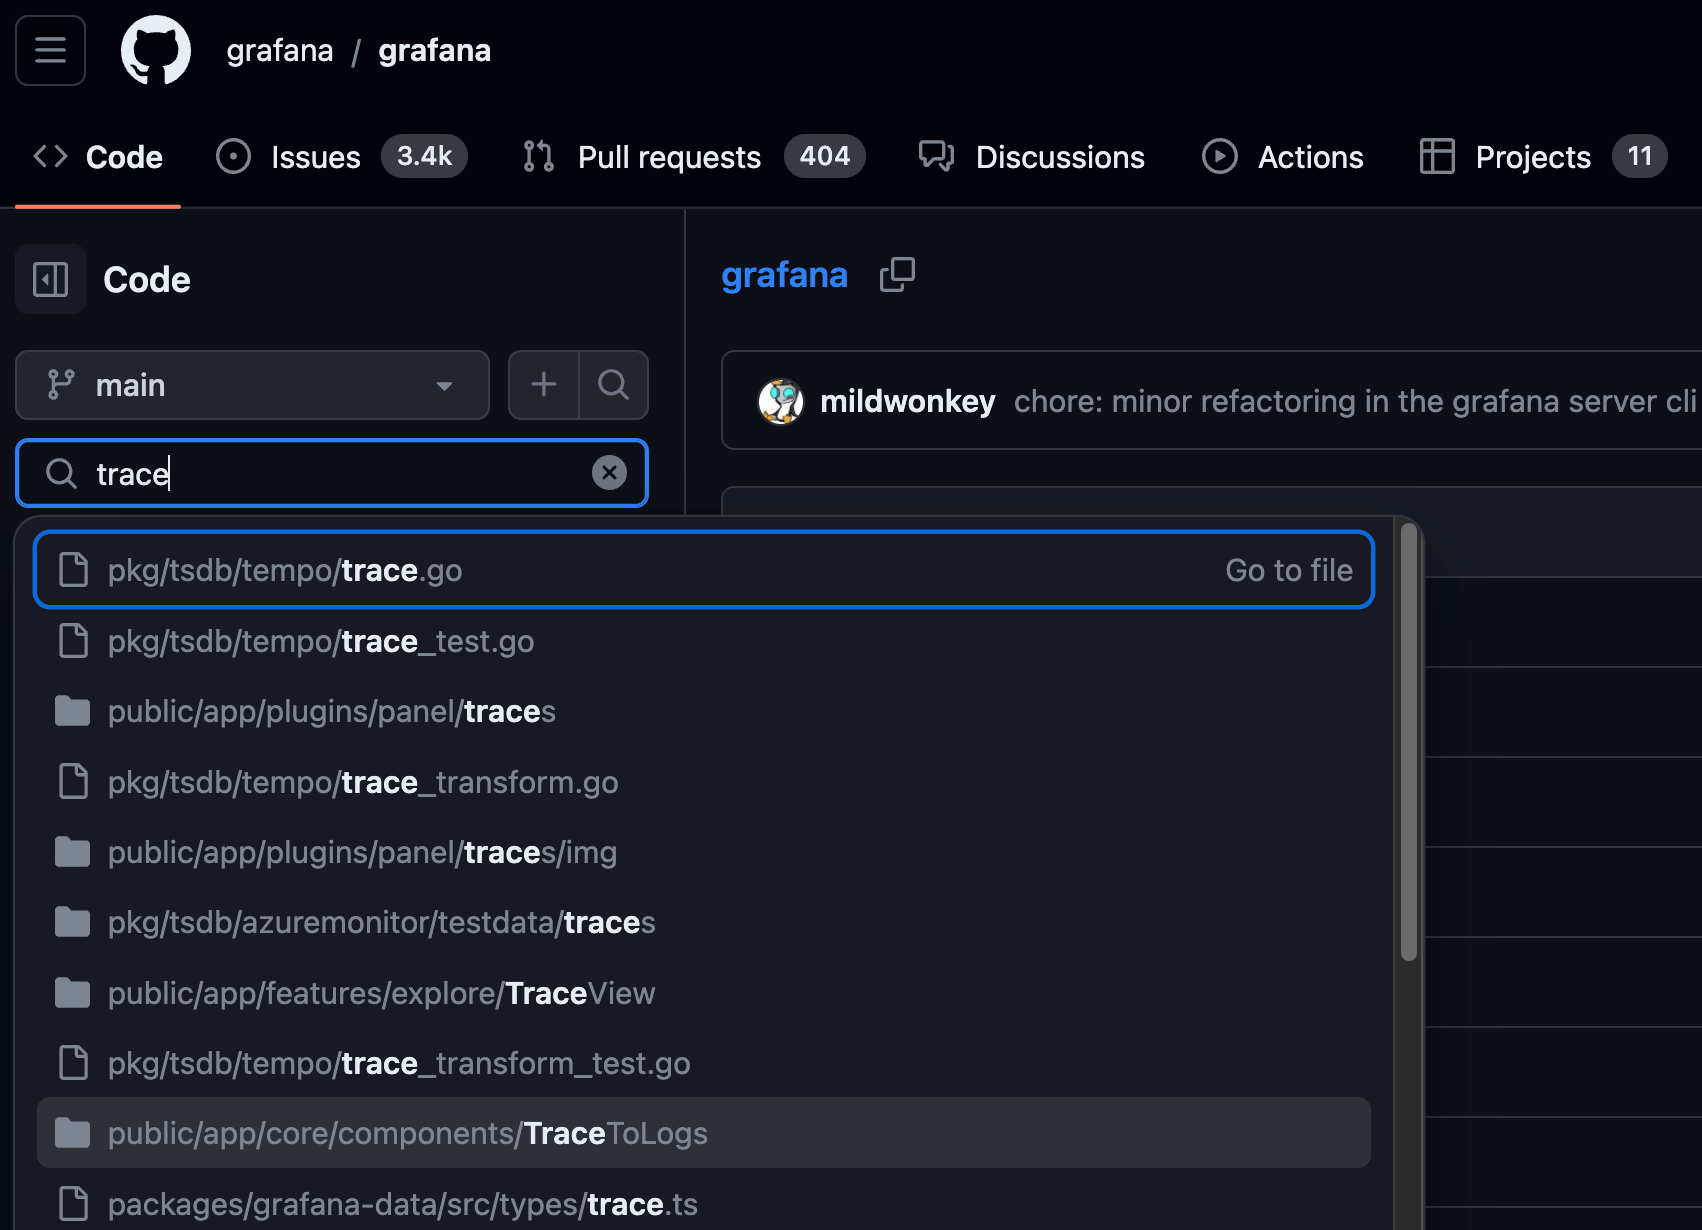
As you can see I made this little discovery by using the keyword trace, which led me to the directory TraceToLogs. This led me to this section of code within TraceToLogsSettings.tsx:
export function TraceToLogsSettings({ options, onOptionsChange }: Props) {
  const supportedDataSourceTypes = [
    'loki',
    'elasticsearch',
    'grafana-splunk-datasource', // external
    'grafana-opensearch-datasource', // external
    'grafana-falconlogscale-datasource', // external
    'googlecloud-logging-datasource', // external
  ];
This section of code seems to create a static list of data sources supported by the Trace to Logs feature. We can confirm this by some of the common suspects within the list (Loki, Elasticsearch, etc.). Based on this finding, our first alteration to the Grafana source code is to add our data sources to this list.
Now, as the coding pessimist that I am, I knew this probably wouldn’t be the only change we needed to make but it’s a good place to start. So, I did the following:
- I forked the Grafana repo
- Cloned the repo:
git clone https://github.com/InfluxCommunity/grafanaBefore I made those modifications I wanted to do some more searching to see if there were any other changes I should make. One line stood out to me in TraceToLogsSettings file:
const updateTracesToLogs = useCallback(
(value: Partial<TraceToLogsOptionsV2>) => {
// Cannot use updateDatasourcePluginJsonDataOption here as we need to update 2 keys, and they would overwrite each
// other as updateDatasourcePluginJsonDataOption isn't synchronized
onOptionsChange({
...options,
jsonData: {
...options.jsonData,
tracesToLogsV2: {
...traceToLogs,
...value,
},
tracesToLogs: undefined,
},
});
},
[onOptionsChange, options, traceToLogs]
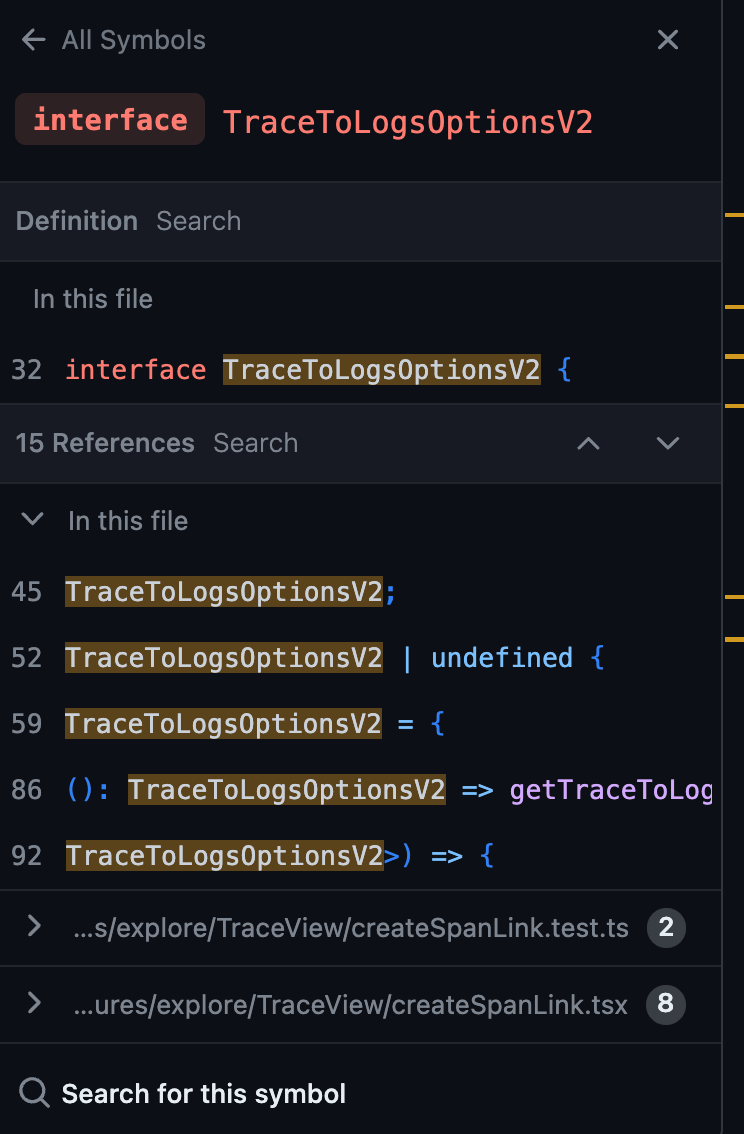
);It was TraceToLogsOptionsV2. When I searched for places where Grafana used this interface, I found the following entry.
It appears we might also have work to do in the createSpanLink.tsx file. Within this section I found the following piece of code. At this point, my question was “what exactly is this code doing?”
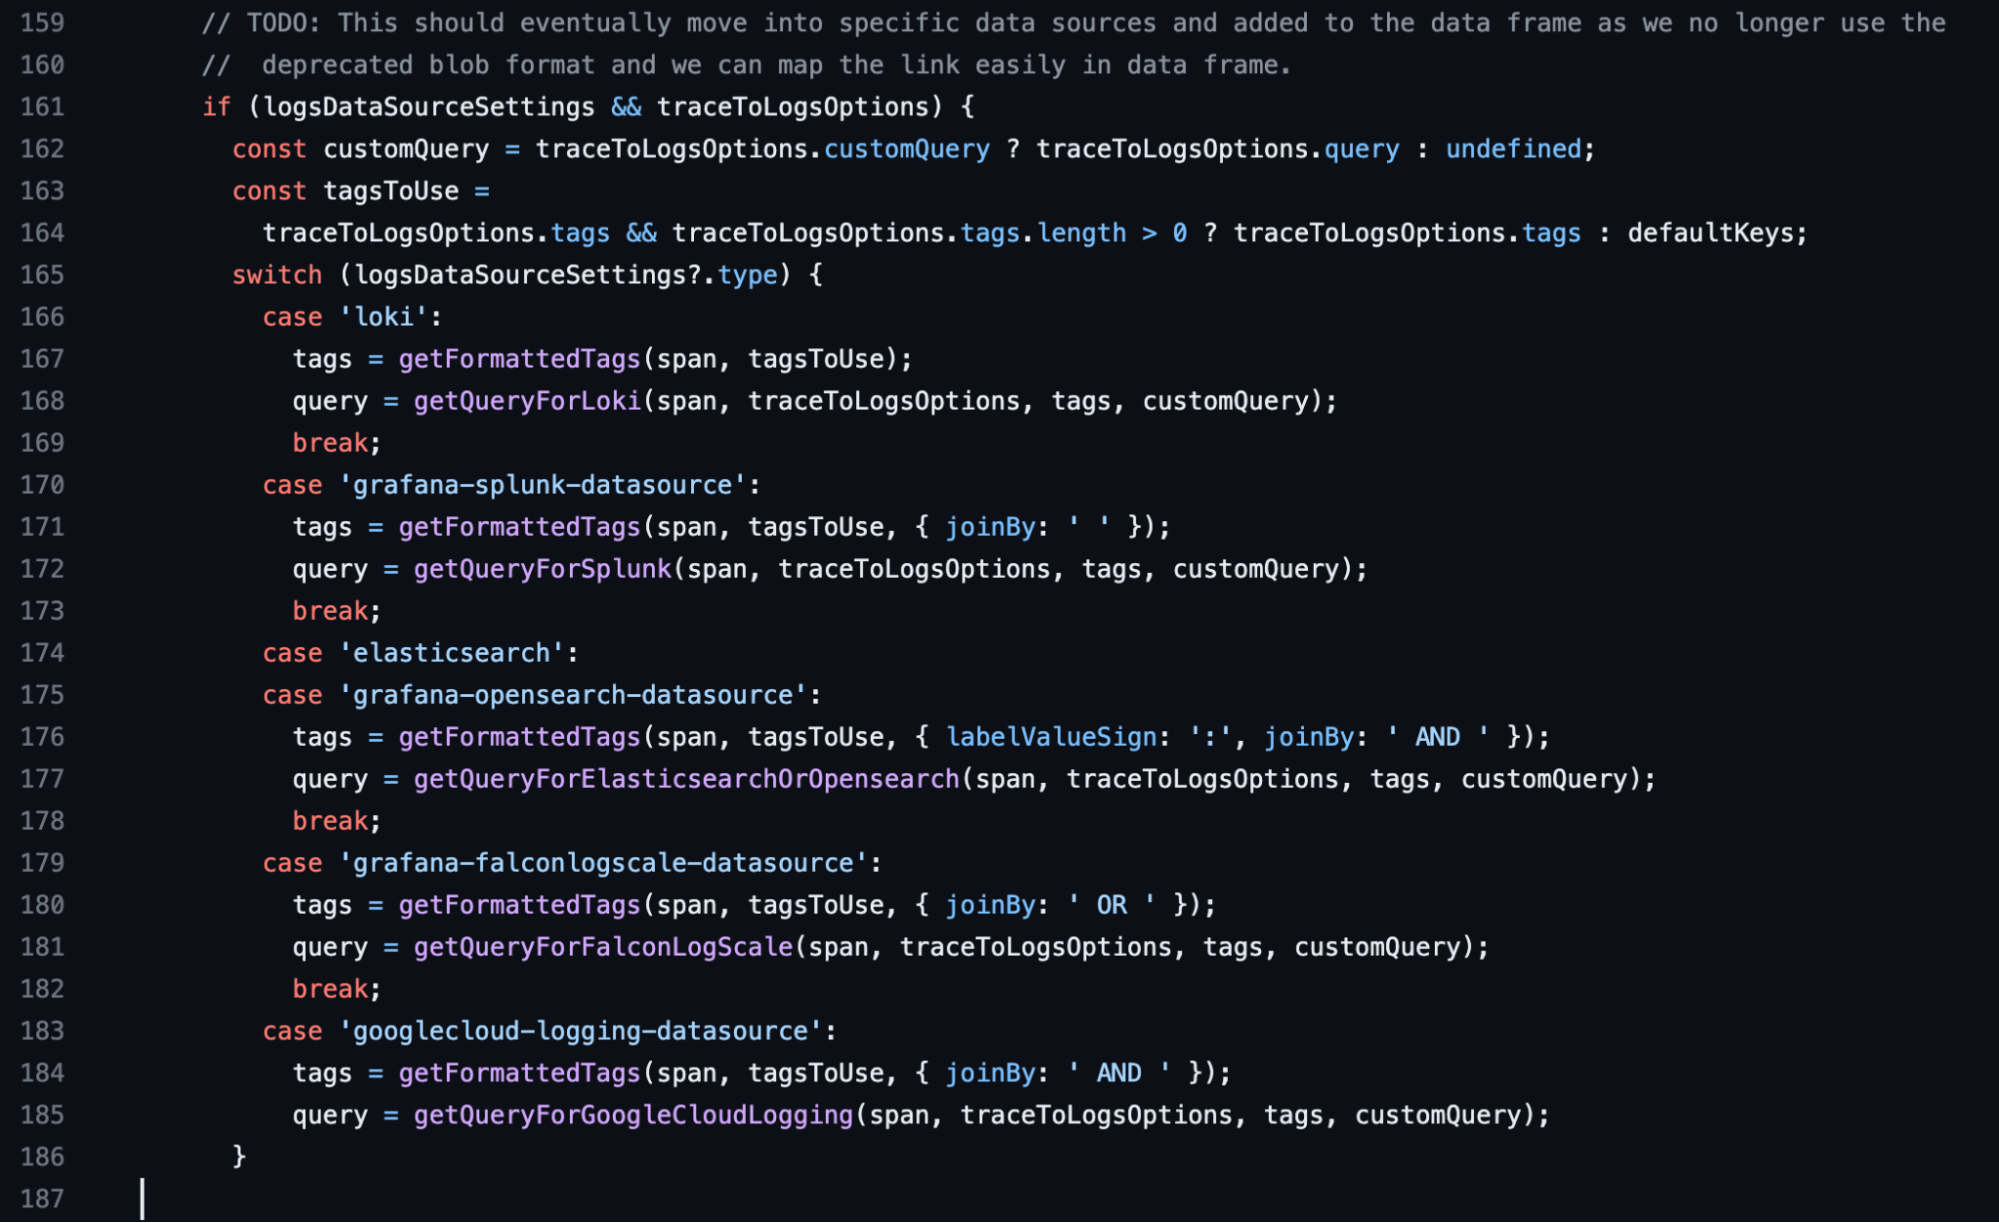
To cut a long story short, the case statement essentially tells the trace visualization to check the defined log data source (if any) and to define a query interface relevant to that data source. If the specified data source is not found within this case statement, then Grafana simply disables the button. This meant that changing the original file won’t be enough as we suspected.
Okay, with our investigation complete, let’s move on to the code changes.
Modification
We have two files to modify:
Let’s start with the simplest to tackle and go from there.
TraceToLogsSettings
This file was relatively simple to change. All we needed to do was modify the static list of supported log input sources like so:
export function TraceToLogsSettings({ options, onOptionsChange }: Props) {
  const supportedDataSourceTypes = [
    'loki',
    'elasticsearch',
    'grafana-splunk-datasource', // external
    'grafana-opensearch-datasource', // external
    'grafana-falconlogscale-datasource', // external
    'googlecloud-logging-datasource', // external
    'influxdata-flightsql-datasource', // external
    'influxdb', // external
  ];
As you can see, I added two data sources. I ran a quick build of the Grafana project to see how this affected our data source configuration (we will discuss how to build at the end).
Hey presto! We have a result. Now, this still didn’t enable the button within our Trace View but we already knew this would require more work.
createSpanLink
Now, let’s move on to the meat of our modification. For the record, I am not a TypeScript developer. What I do know is that the file has a whole bunch of examples we can use to attempt a blind copy-and-paste job with a few modifications. I ended up doing this for both plugins but to keep the blog short we will focus on the InfluxDB official plugin.
My hypothesis was to use the Grafana Loki interface as the basis for the InfluxDB interface. The first included adding data source types:
import { LokiQuery } from '../../../plugins/datasource/loki/types';
import { InfluxQuery } from '../../../plugins/datasource/influxdb/types';
These are easy to locate when Grafana has an official plugin for your data source since it’s embedded within the official repository. For our community plugin I had two options: define a static interface within the file or provide more query parameters. I chose the latter.
The next step was to modify the case statement:
// TODO: This should eventually move into specific data sources and added to the data frame as we no longer use the
    //  deprecated blob format and we can map the link easily in data frame.
    if (logsDataSourceSettings && traceToLogsOptions) {
      const customQuery = traceToLogsOptions.customQuery ? traceToLogsOptions.query : undefined;
      const tagsToUse =
        traceToLogsOptions.tags && traceToLogsOptions.tags.length > 0 ? traceToLogsOptions.tags : defaultKeys;
      switch (logsDataSourceSettings?.type) {
        case 'loki':
          tags = getFormattedTags(span, tagsToUse);
          query = getQueryForLoki(span, traceToLogsOptions, tags, customQuery);
          break;
        case 'grafana-splunk-datasource':
          tags = getFormattedTags(span, tagsToUse, { joinBy: ' ' });
          query = getQueryForSplunk(span, traceToLogsOptions, tags, customQuery);
          break;
        case 'influxdata-flightsql-datasource':
            tags = getFormattedTags(span, tagsToUse, { joinBy: ' OR ' });
            query = getQueryFlightSQL(span, traceToLogsOptions, tags, customQuery);
          break;
        case 'influxdb':
            tags = getFormattedTags(span, tagsToUse, { joinBy: ' OR ' });
            query = getQueryForInfluxQL(span, traceToLogsOptions, tags, customQuery);
          break;
        case 'elasticsearch':
        case 'grafana-opensearch-datasource':
          tags = getFormattedTags(span, tagsToUse, { labelValueSign: ':', joinBy: ' AND ' });
          query = getQueryForElasticsearchOrOpensearch(span, traceToLogsOptions, tags, customQuery);
          break;
        case 'grafana-falconlogscale-datasource':
          tags = getFormattedTags(span, tagsToUse, { joinBy: ' OR ' });
          query = getQueryForFalconLogScale(span, traceToLogsOptions, tags, customQuery);
          break;
        case 'googlecloud-logging-datasource':
          tags = getFormattedTags(span, tagsToUse, { joinBy: ' AND ' });
          query = getQueryForGoogleCloudLogging(span, traceToLogsOptions, tags, customQuery);
      }
As you can see I added two new cases: influxdata-flightsql-datasource and influxdb. Then, I copied the two function calls within the case from Loki: getFormattedTags and getQueryFor. I determined that I could leave getFormattedTags alone because it appeared to be the same for the majority of the cases. However, I still needed to define my own getQueryFor function.
Let’s take a look at the new getQueryForInfluxQL function that’s called in the influxdb case statement:
function getQueryForInfluxQL(
  span: TraceSpan,
  options: TraceToLogsOptionsV2,
  tags: string,
  customQuery?: string
): InfluxQuery | undefined {
  const { filterByTraceID, filterBySpanID } = options;

  if (customQuery) {
    return {
      refId: '',
      rawQuery: true,
      query: customQuery,
      resultFormat: 'logs',
    };
  }

  let query = 'SELECT time, "severity_text", body, attributes FROM logs WHERE time >=${__from}ms AND time <=${__to}ms';

  if (filterByTraceID && span.traceID && filterBySpanID && span.spanID) {
            query = 'SELECT time, "severity_text", body, attributes FROM logs WHERE "trace_id"=\'${__span.traceId}\' AND "span_id"=\'${__span.spanId}\' AND time >=${__from}ms AND time <=${__to}ms';
    } else if (filterByTraceID && span.traceID) {
            query = 'SELECT time, "severity_text", body, attributes FROM logs WHERE "trace_id"=\'${__span.traceId}\' AND time >=${__from}ms AND time <=${__to}ms';
    } else if (filterBySpanID && span.spanID) {
            query = 'SELECT time, "severity_text", body, attributes FROM logs WHERE "span_id"=\'${__span.spanId}\' AND time >=${__from}ms AND time <=${__to}ms';
  }

  return {
    refId: '',
    rawQuery: true,
    query: query,
    resultFormat: 'logs',
  };
}
There is quite a lot here, but let me highlight the important parts. First of all, I started with an exact copy of the Loki function. Then, I made the following changes:
- I changed the return interface from
LokiQuery | undefinedtoInfluxQuery | undefined. This is the data source type we imported earlier. - Next, I focused on the return payload. After some digging in the InfluxQuery type file, I came up with this:
The InfluxDB data source had a resultFormat parameter which allowed me to define the result format (usually metrics). This also informed me that the data source expected a raw query rather than an expression.return { refId: '', rawQuery: true, query: query, resultFormat: 'logs', }; - Lastly, I defined the queries that would run when the user clicked the button. These depended on what filter features the user toggled within the data source settings (filter by traceID, spanID or both). I modified the
ifstatement defined within the Loki function and constructed static InfluxQL queries. From there, I used the Grafana placeholder variables found within other data sources to make the queries dynamic. Here is an example:
Full disclosure, it took me a good minute to find out about theif (filterByTraceID && span.traceID && filterBySpanID && span.spanID) { query = 'SELECT time, "severity_text", body, attributes FROM logs WHERE "trace_id"=\'${__span.traceId}\' AND "span_id"=\'${__span.spanId}\' AND time >=${__from}ms AND time <=${__to}ms';>=${__from}msand<=${__to}ms. This ended up being a brute force build and error case.
Building
Phew! We’re past the hard bit. Now onto the build process. I have quite a few years of experience with Docker, so this part was stress-free for me, but I imagine it could be daunting for new Docker users. Luckily, Grafana has some easy-to-follow documentation for the task. To paraphrase, these are the steps:
- Run the following build command (this can take a while and make sure your docker VM has enough memory if using macOS or Windows)
make build-docker-full - The build process produces a Docker image called: grafana/grafana-oss:dev. We could just use this image, but as a formality, I like to retag the image and push it to my Docker registry.
This way I have checkpoints when I am brute forcing changes.docker tag grafana/grafana-oss:dev jaymand13/grafana-oss:dev2 docker push jaymand13/grafana-oss:dev2
There we have it! A fully baked Grafana dev image to try out with our changes.
The results and conclusion
So after investigating, making the changes, and building our new Grafana container, let’s take a look at our results:
With our changes, the Logs for this span button is now active. We also have this neat little Log button that appears next to each span. A confession: the blue Logs for this span button currently only works within the Grafana Explorer tab, but the new Log link works within our dashboard.
To quickly explain the differences, users build custom Grafana Dashboards and can include 1 or many data sources with a variety of different visualizations. Data Explorers, on the other hand, provide an interface for drill-down and investigation activities like you see in the screenshot above. Still, it’s not a huge problem compared to how little we needed to change to get here.
And so, we’ve reached the end of our dive into the intricacies of modifying Grafana’s source code. Over the course of this tutorial, I hope you’ve not only gained a practical understanding of how to customize Grafana for your specific requirements, but also an appreciation for the flexibility and potential of open source platforms in general.
Remember, in the realm of open source, there’s no limit to how much we can tweak, adjust, and reimagine to suit our needs. I hope this guide serves you well as you delve deeper into your own projects, and that it brings you one step closer to mastering the powerful tool that is Grafana. For me, my journey continues as I now plan to add exemplar support to this OSS build. If you would like to try this out yourself you can find the OpenTelemetry example here.
