Using InfluxDB Cloud to Monitor GitHub Repos
By
Rick Spencer
updated December 14, 2025
Use Cases
Product
Developer
Navigate to:
In this blog post, I will show you an easy way to use your InfluxDB Cloud account plus a Docker container from my Docker Hub account to easily keep an eye on a set of GitHub repositories using the Template feature built into the new version of InfluxDB Cloud.
Summary
The way the system works is that there are some templates for dashboards along with their related queries, variables and settings available for use. The only thing missing is actually collecting the data. Data collection with InfluxDB is typically done using Telegraf. I have created a docker image with Telegraf and all the configuration already set up. So, all you need to do is:
- Instantiate the GitHub template.
- Create a bucket and token for that bucket.
- Get a Github access token.
- Run the container with the necessary environment variables. In my case, I use docker-compose to run it.
After that, your GitHub dashboard will work like magic.
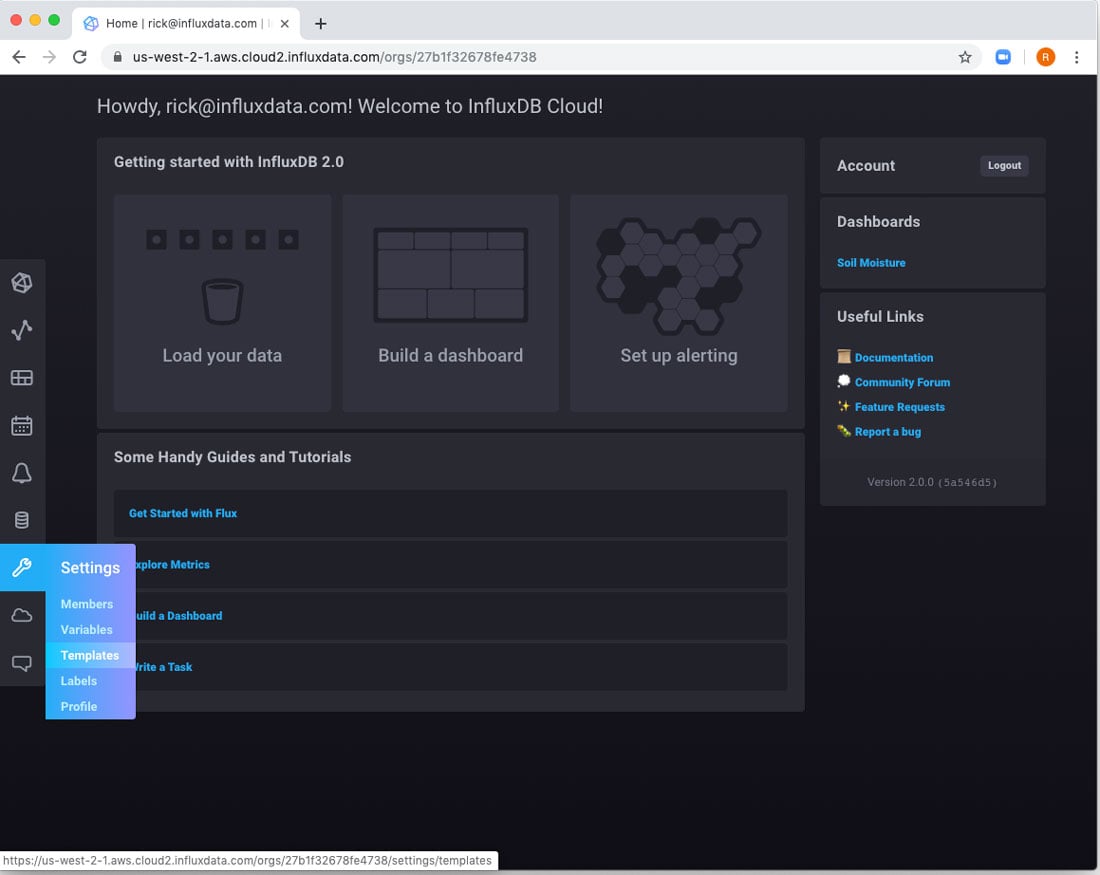
Instantiate the template
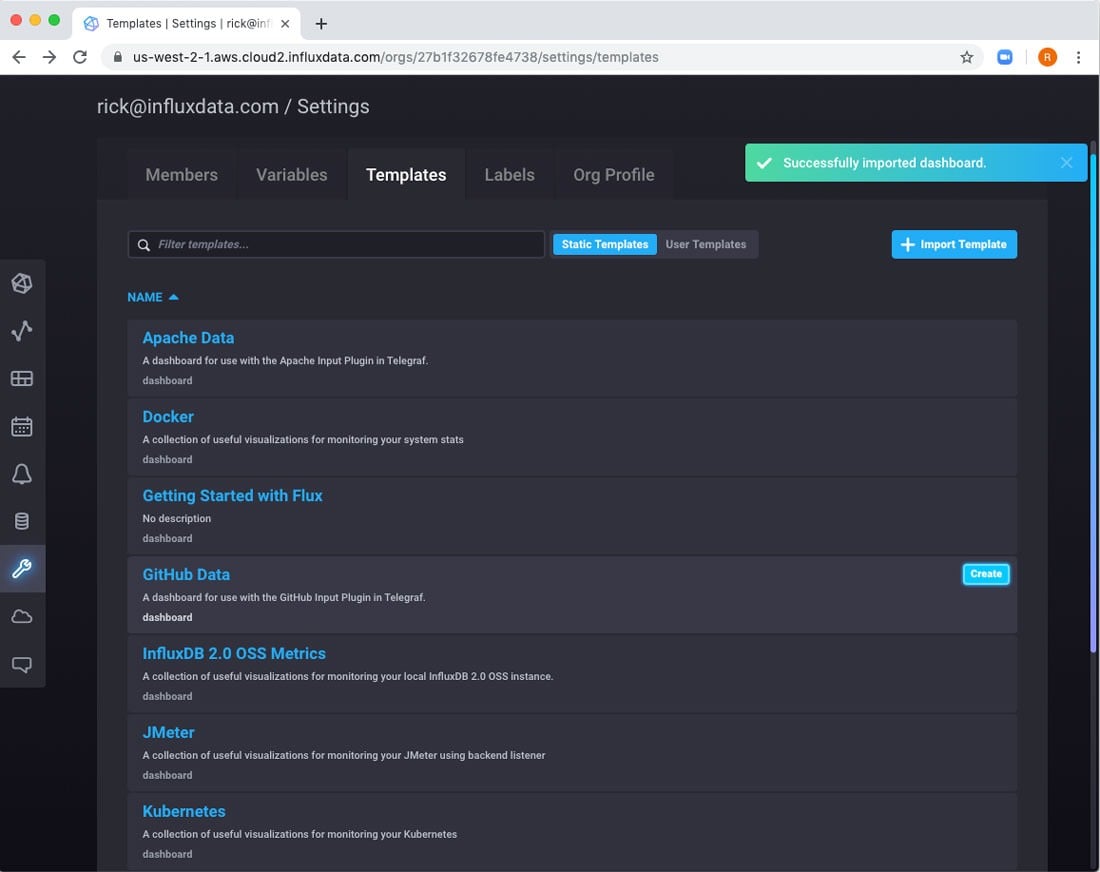
Start by using the left-hand nav to navigate to the Templates page.
Here you will notice a long list of templates, each geared to accelerate using InfluxDB Cloud for a different scenario. For now, I am interested in GitHub Data.
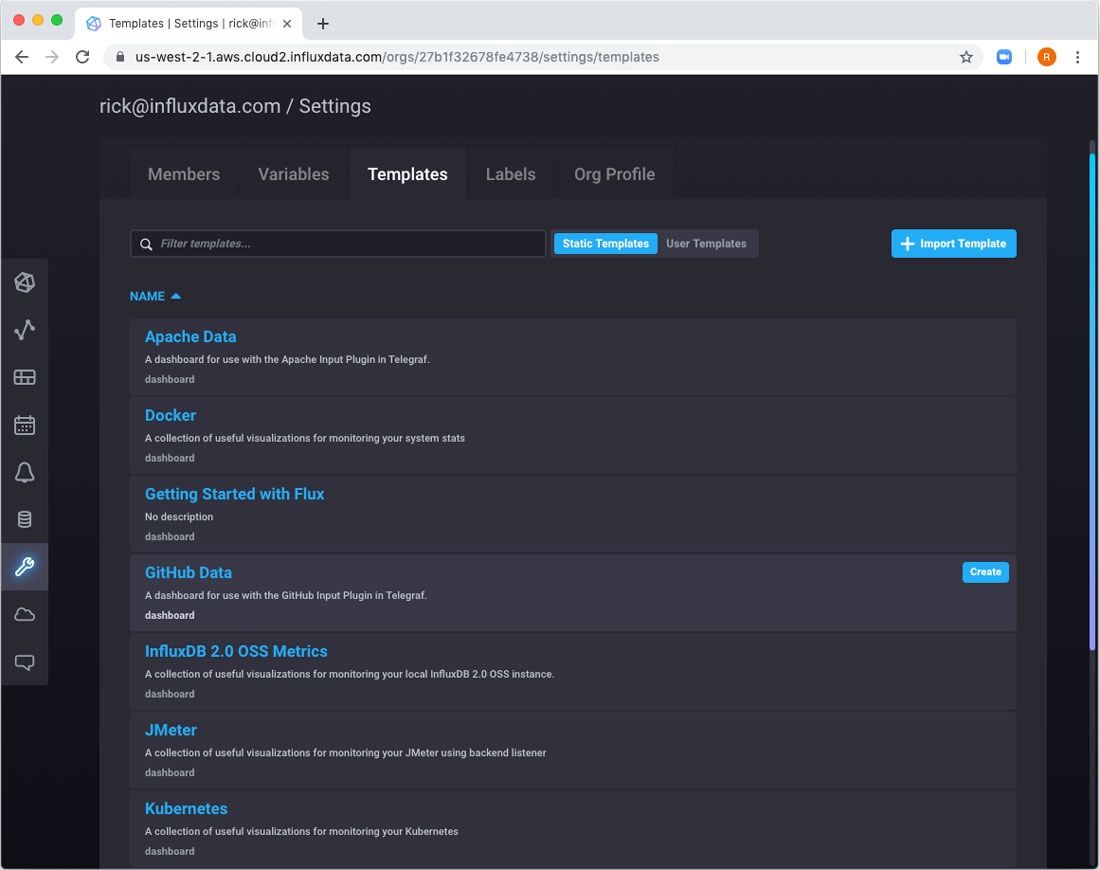
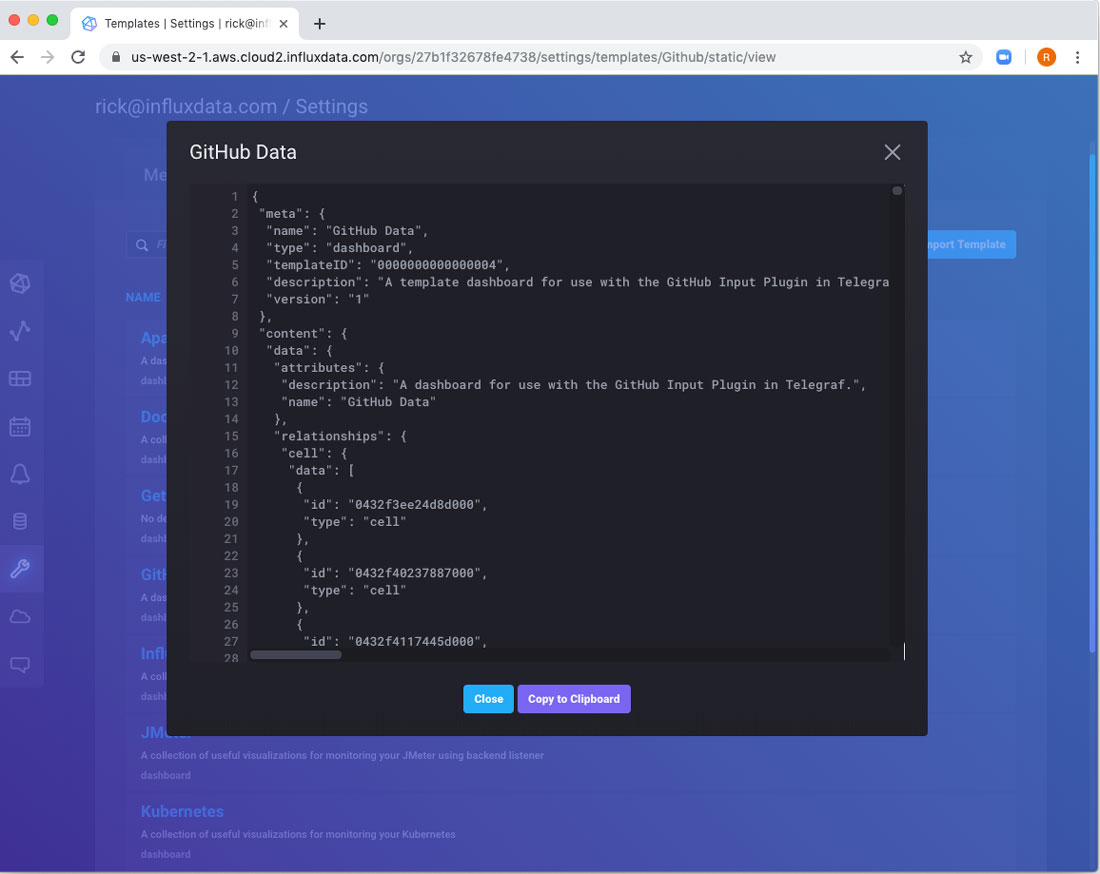
If you want to take a look at the template itself, you can click on the title, and see the JSON that is used to describe the dashboard. It’s pretty feature-rich, and understanding it is not required to use it. However, it may be useful if you want to create your own templates. You can save off the JSON, modify and share it or use later in other accounts or in InfluxDB 2.0 Open Source. For now, though, I am just going to click the Create button to actually apply the template.
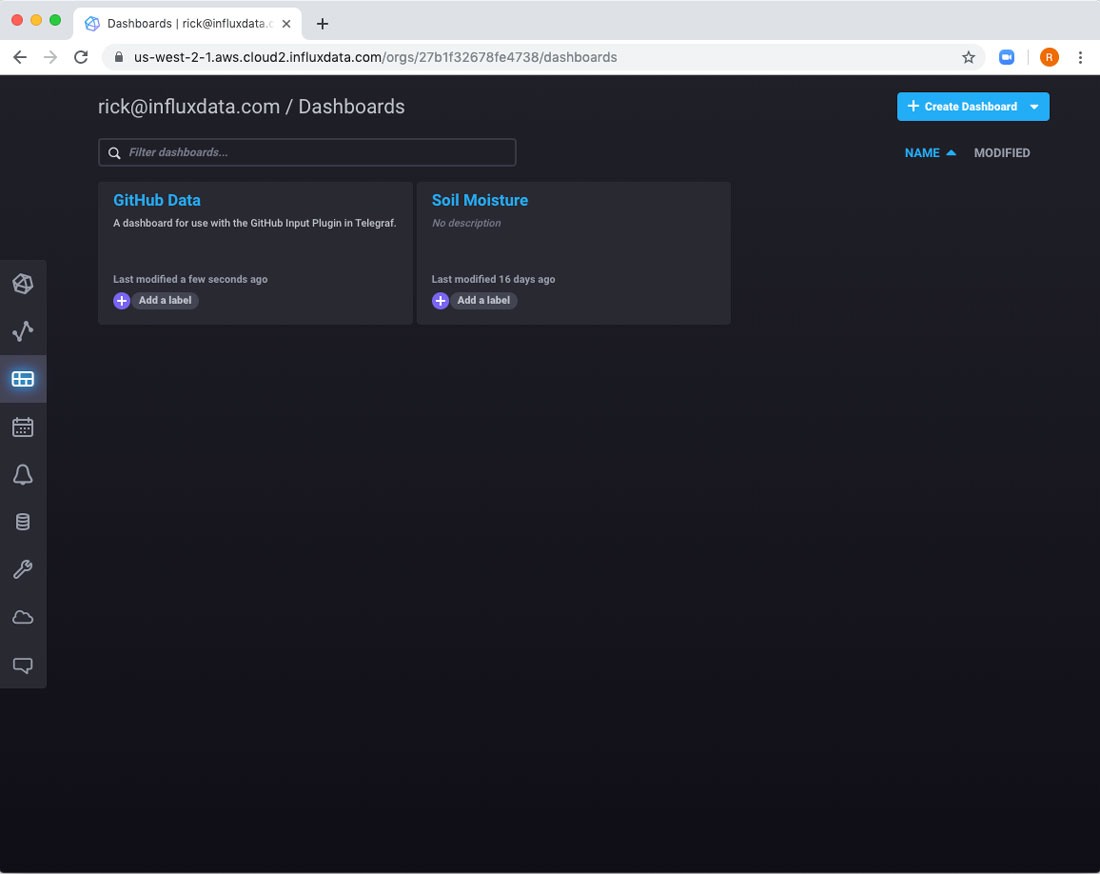
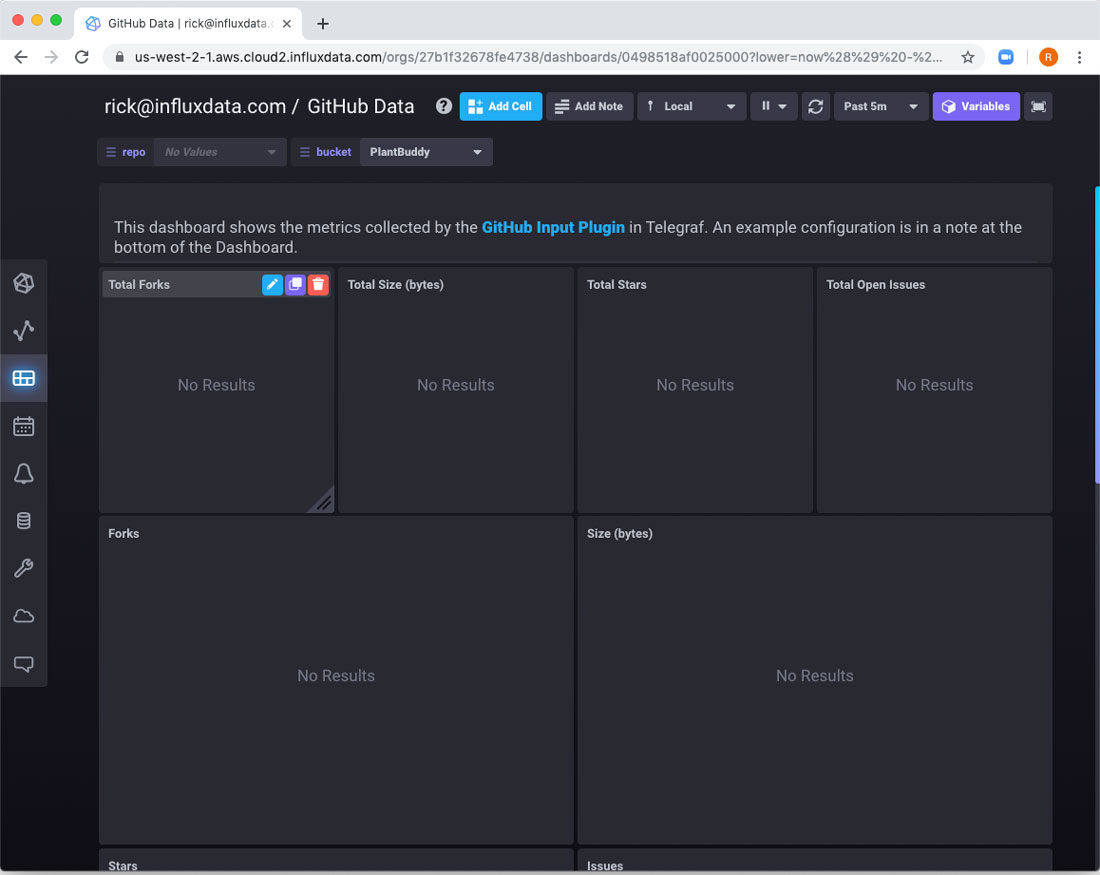
After creating the template, if you navigate to the Dashboards page, you will see that a new Dashboard has been added called “Github Data.” But clicking on the title, you end up with a dashboard with “No Results.” That’s expected because we have not configured anything to actually input GitHub data.
Create the bucket
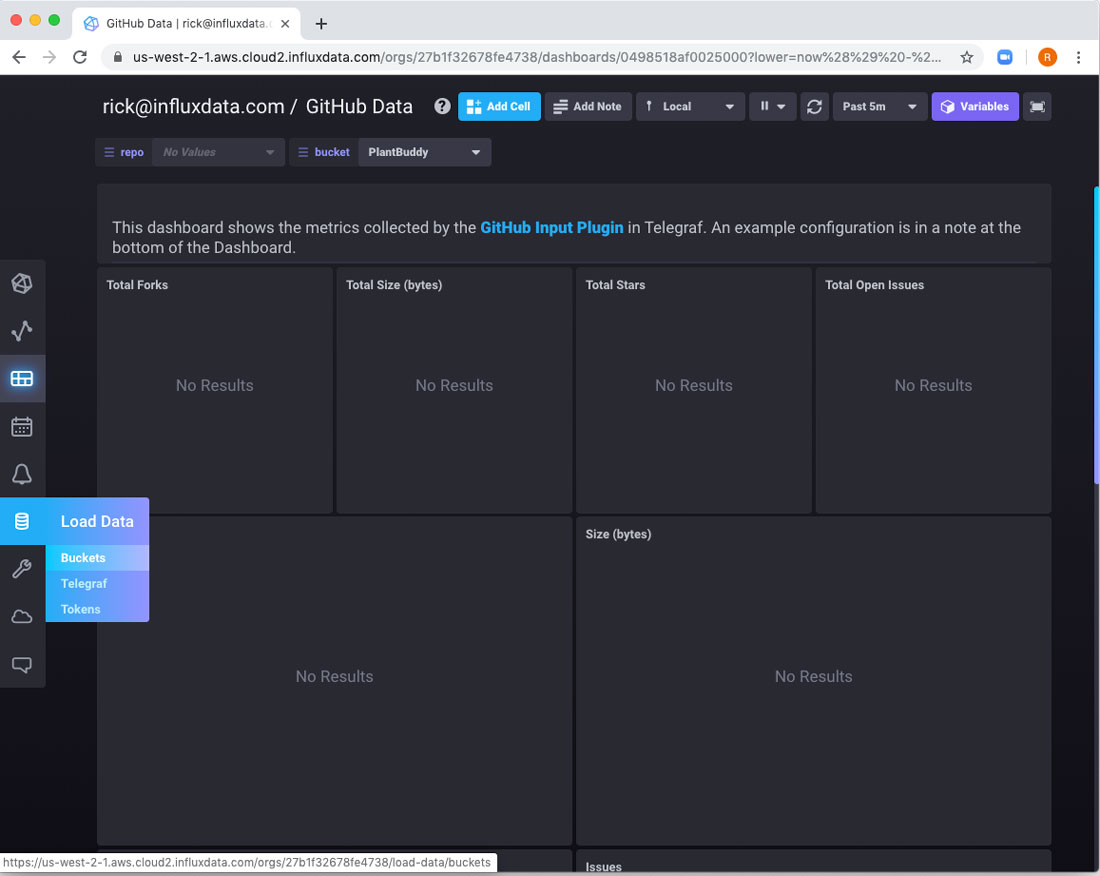
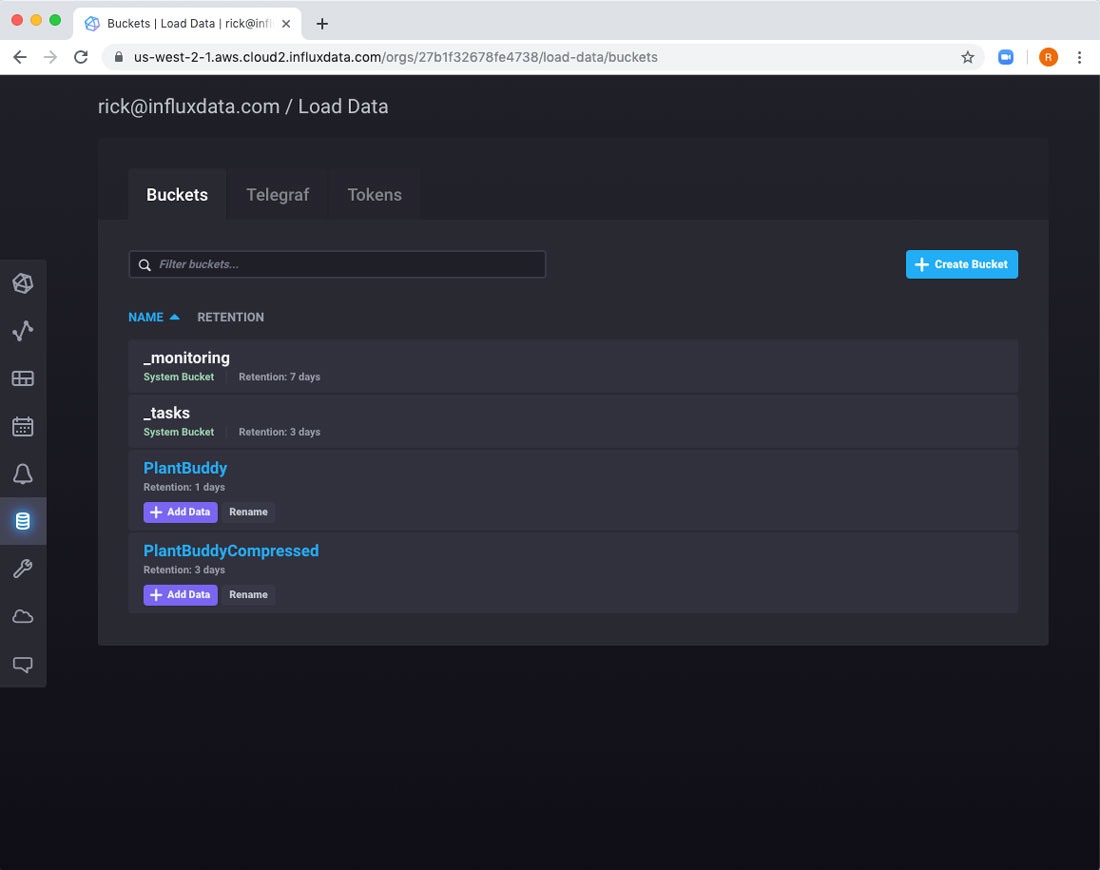
Before we start sending data from GitHub, we need to create a bucket to contain that data. Start by using the left-hand nav to navigate to the buckets page.
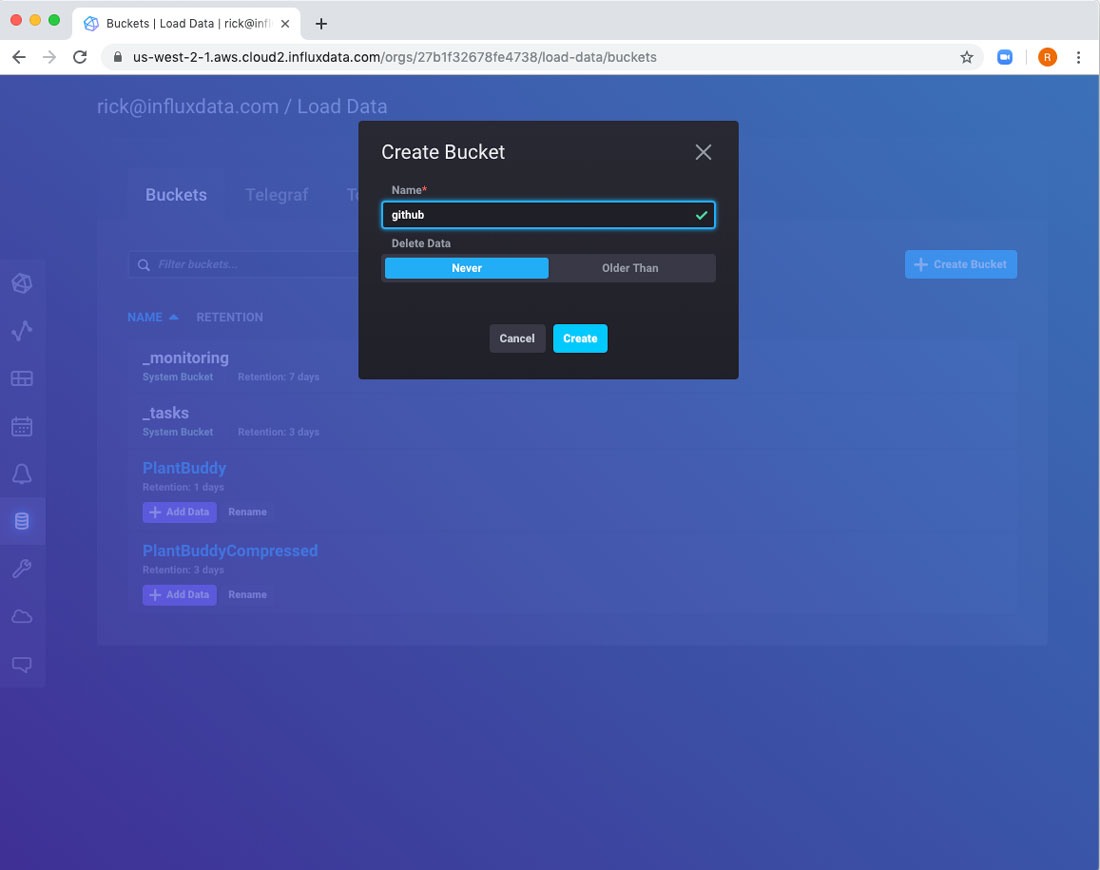
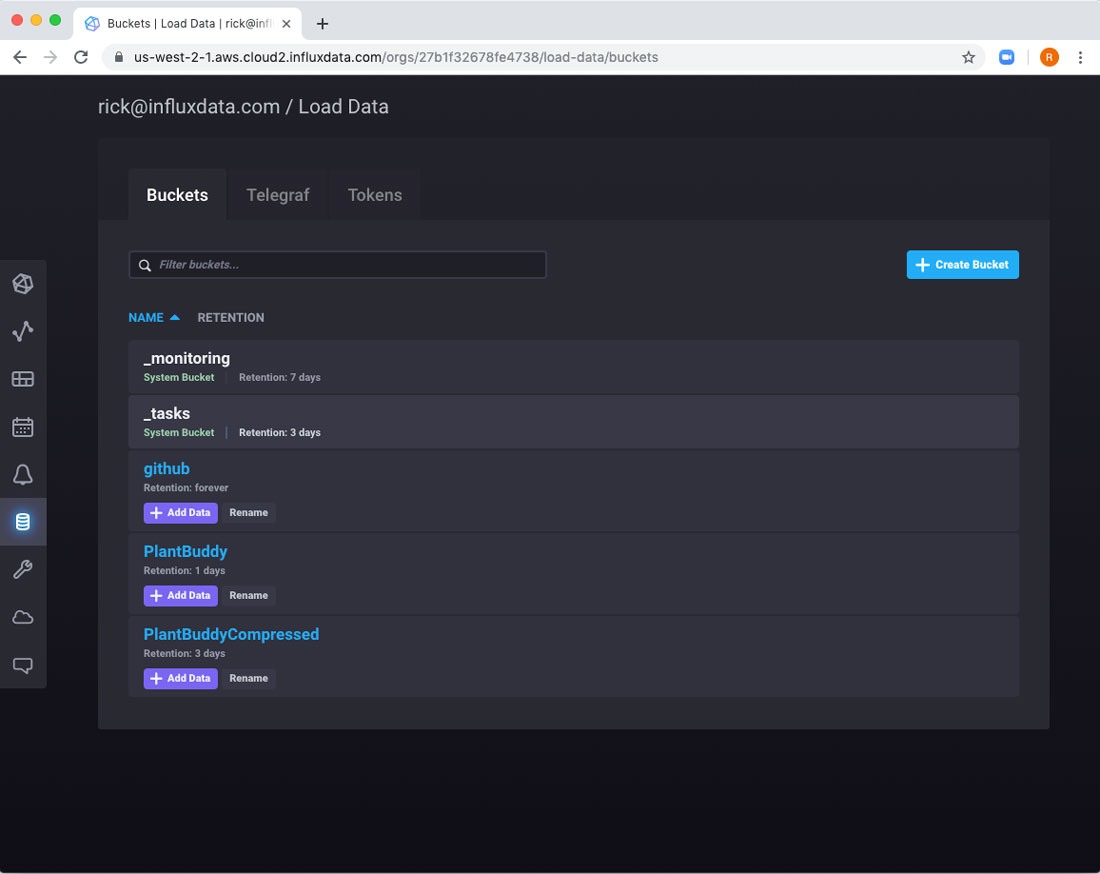
Create a new bucket. I named the bucket “github”, but you can name it whatever you want.
Create access tokens
The Telegraf plugin will require an influx token with write access to the bucket we just created and a GitHub personal access token to access your GitHub account.
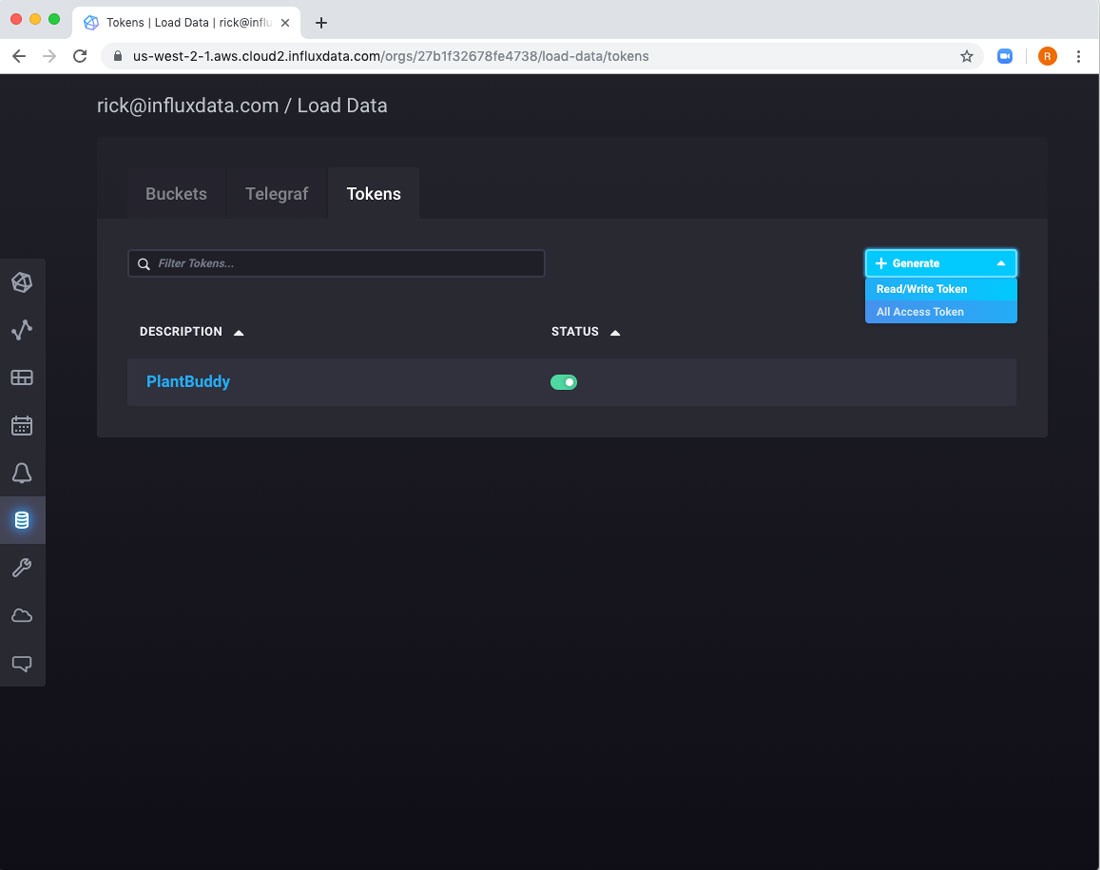
First, switch to the Tokens tab.
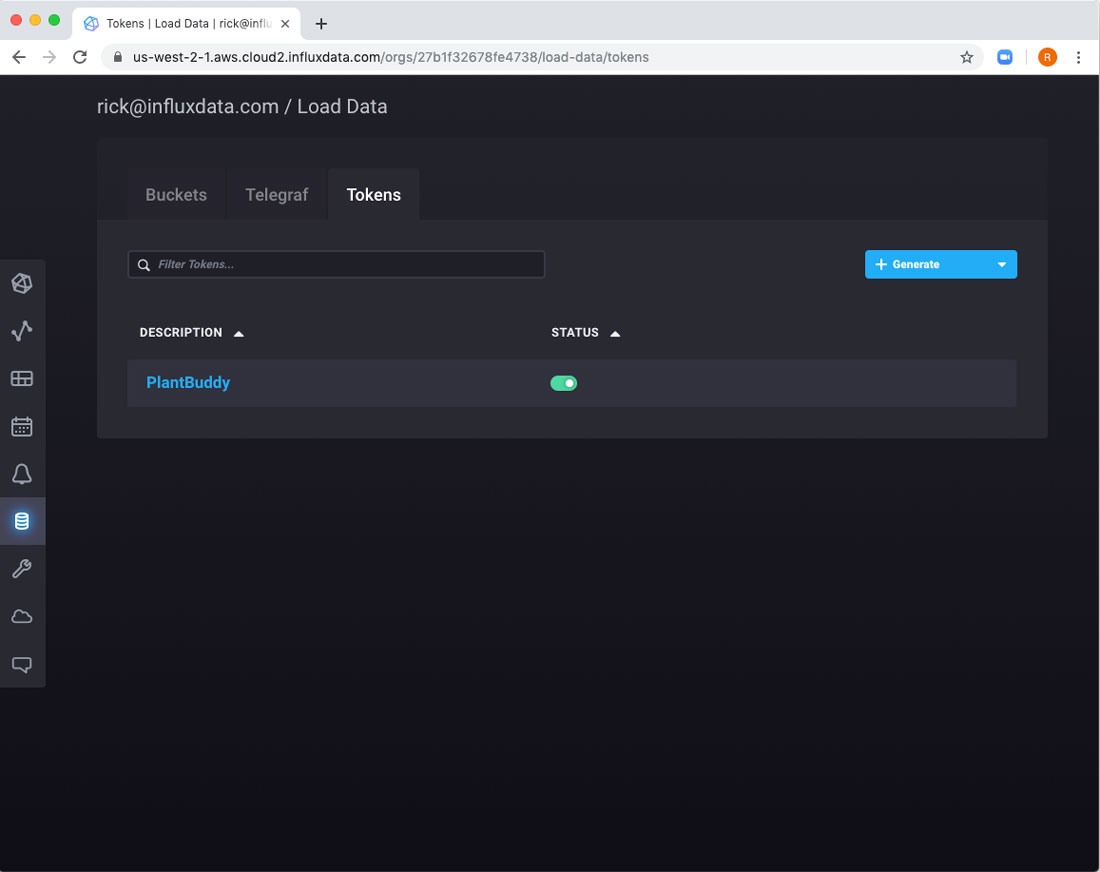
Then use the Generate dropdown and choose a Read/Write Token.
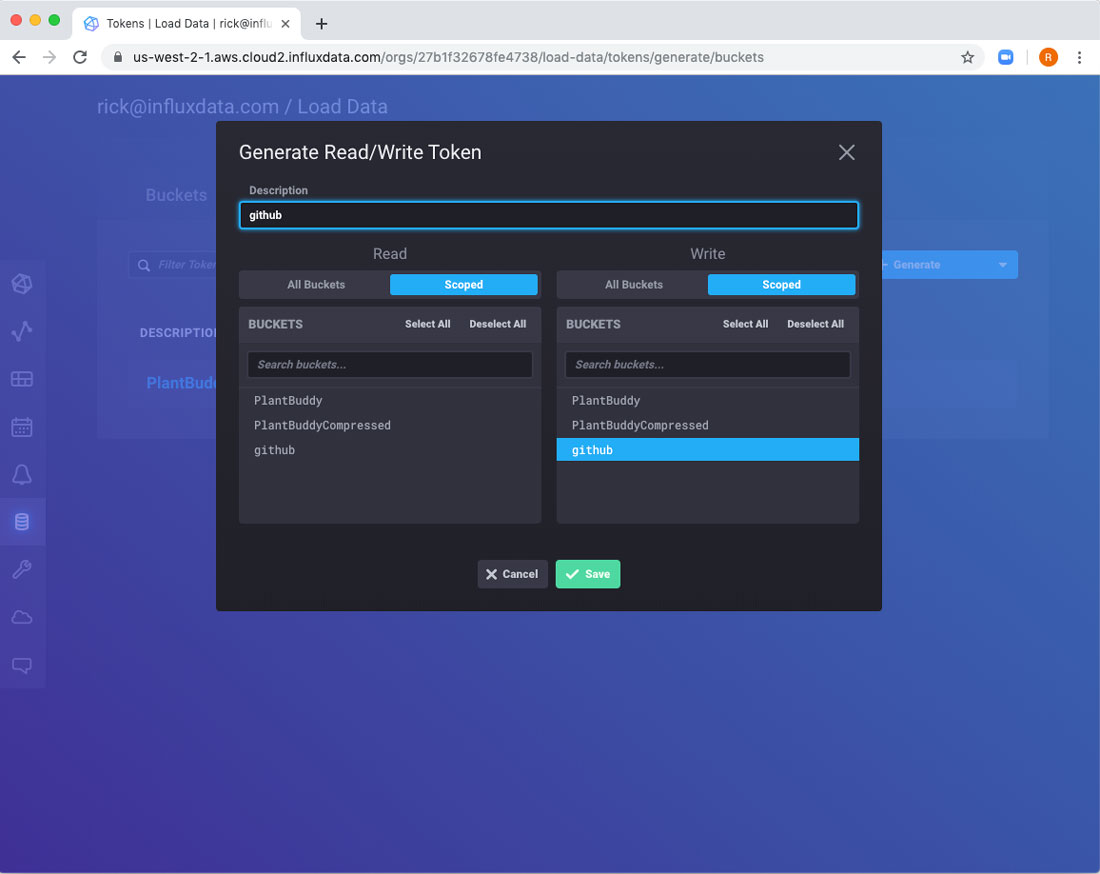
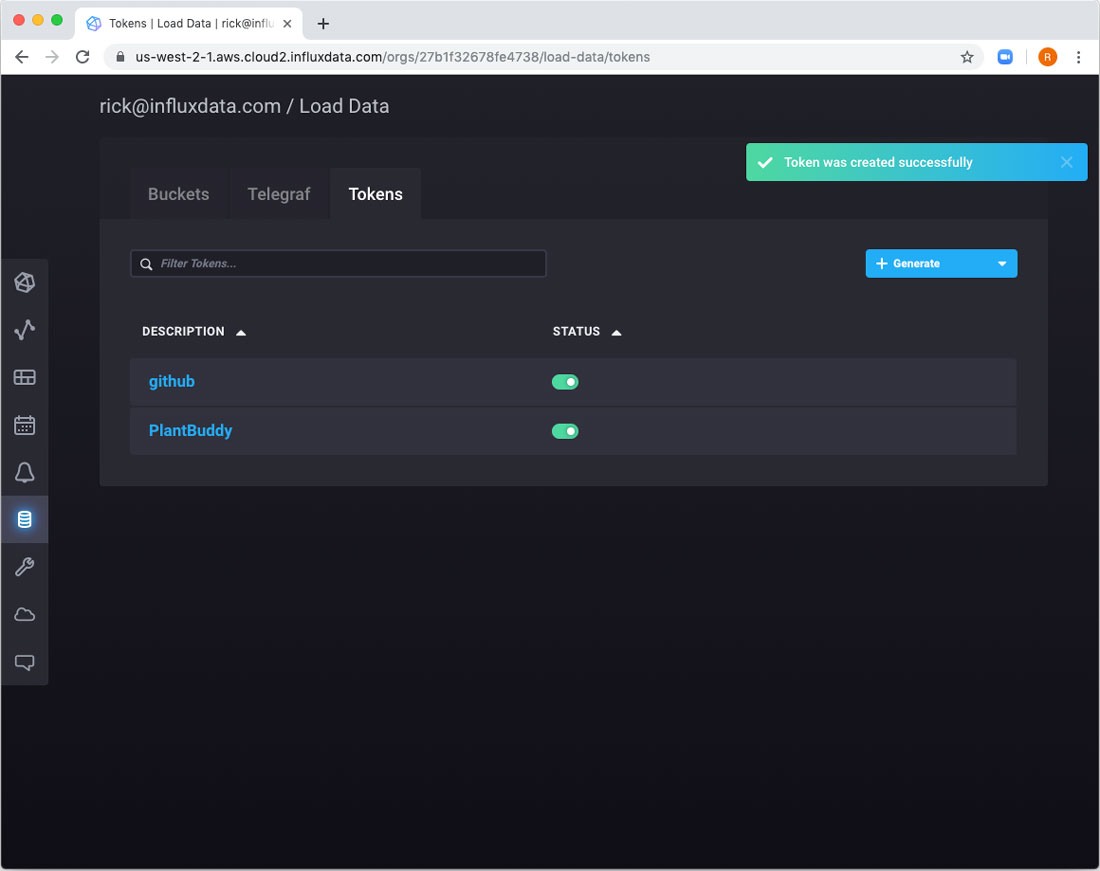
Give it write access to the bucket we just created.
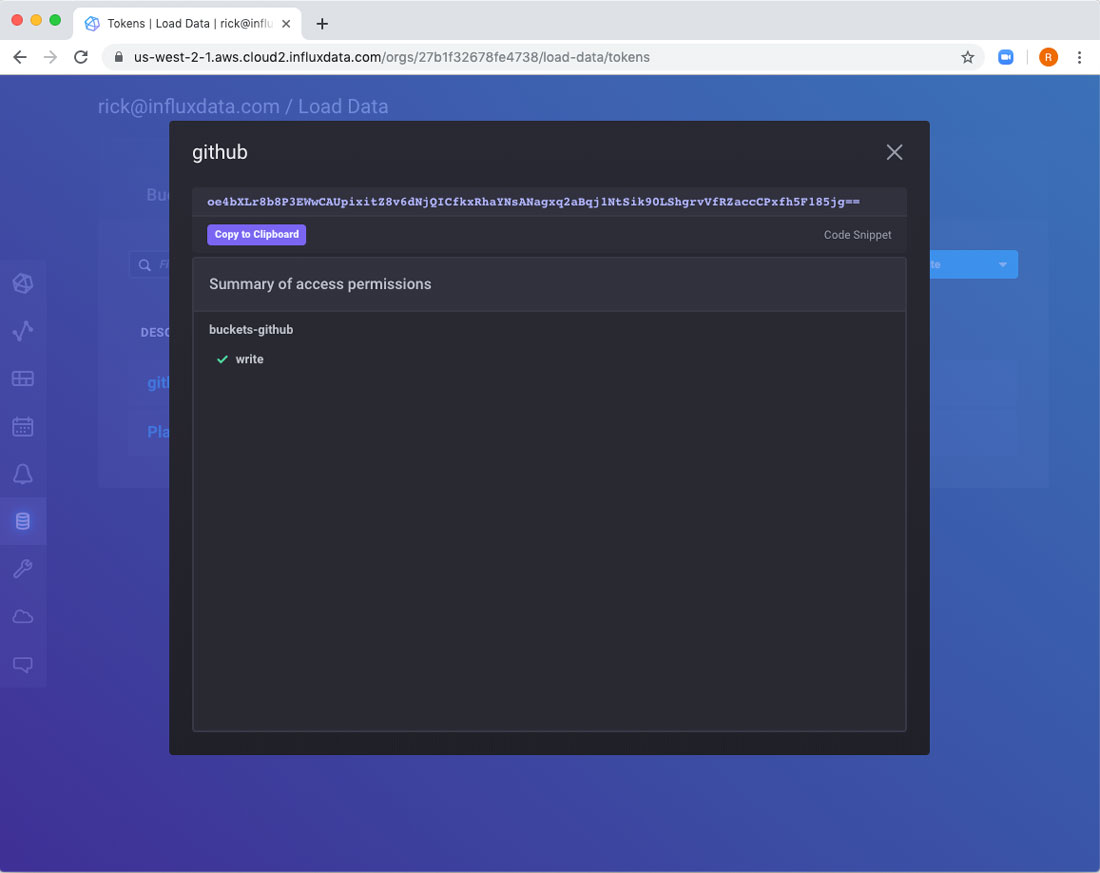
After it is created, you can click on it to view the token itself, which we will need in a bit.
You will also need a GitHub token to access your GitHub account. As a reminder, you create these in GitHub under Settings -> Developer Settings -> Personal access tokens. Then use the “Generate new token” button.
Fill in the docker-compose File and Run
Now we have everything we need to run Telegraf. Everything that you need is in rickspencer3/github-telegraf. All you have to do is pass configuration along via environment variables.
I will use docker-compose and run it on my desktop for now. However, it should be trivial to run it in your docker platform of choice. I’ve truncated the tokens for readability below. To start, I will look at just two repositories, but you can list here as many as you wish.
version: "3.7"

services:
  telegraf:
    image: rickspencer3/github-telegraf
    environment:
      - INFLUX_URL=https://us-west-2-1.aws.cloud2.influxdata.com
      - INFLUX_TOKEN=...
      - [email protected]
      - INFLUX_BUCKET=github
      - GITHUB_TOKEN=1...
      - GITHUB_REPOS=influxdata/influxdb,influxdata/flux
After filling in the docker-compose file and saving it as docker-compose.yaml, I can run it with the docker-compose up command:
$ docker-compose up
Creating network "github-integration_default" with the default driver
Creating github-integration_telegraf_1 ... done
Attaching to github-integration_telegraf_1
telegraf_1  | CONFIGURING REPOSITORIES:
telegraf_1  | > [influxdata/influxdb]
telegraf_1  | > [influxdata/flux]
telegraf_1  | > [influxdata/idpe]
telegraf_1  | 2019-10-09T17:20:00Z I! Starting Telegraf 1.12.2
telegraf_1  | 2019-10-09T17:20:00Z I! Using config file: /etc/telegraf/telegraf.conf
telegraf_1  | 2019-10-09T17:20:00Z I! Loaded inputs: github
telegraf_1  | 2019-10-09T17:20:00Z I! Loaded aggregators:
telegraf_1  | 2019-10-09T17:20:00Z I! Loaded processors:
telegraf_1  | 2019-10-09T17:20:00Z I! Loaded outputs: influxdb_v2
telegraf_1  | 2019-10-09T17:20:00Z I! Tags enabled: host=772e3e34b0e5
telegraf_1  | 2019-10-09T17:20:00Z I! [agent] Config: Interval:10s, Quiet:false, Hostname:"772e3e34b0e5", Flush Interval:10
That means that Telegraf is collecting data from GitHub every 10 seconds.
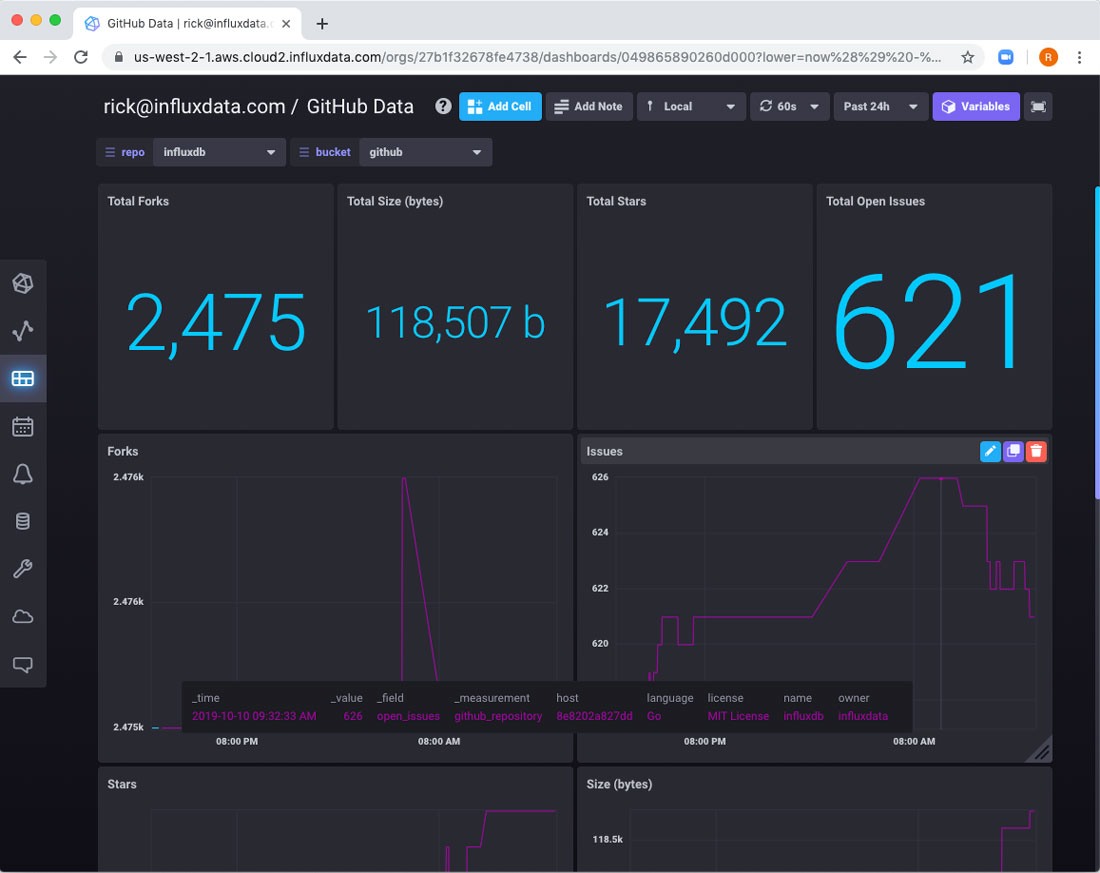
View the dashboard
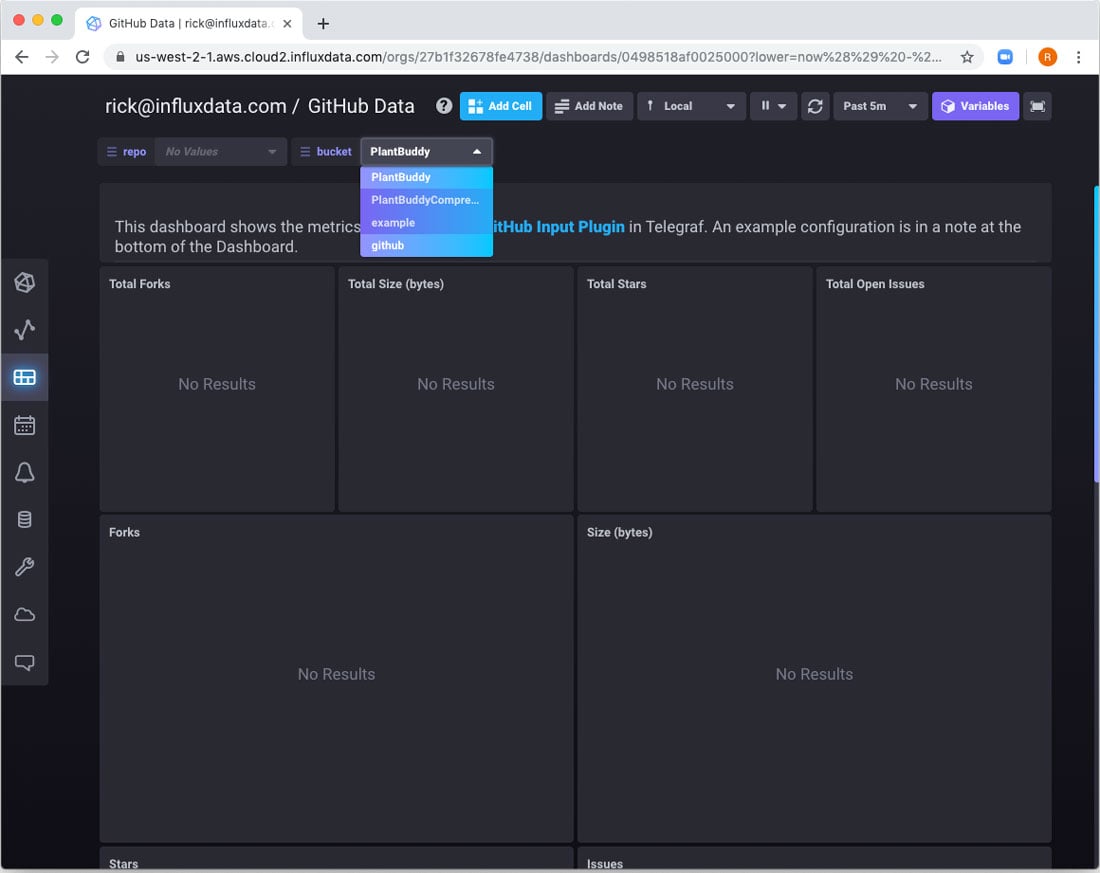
If I navigate back to the dashboard, there are still no results. That’s because I have to tell the dashboard which bucket to use. This implies that I could run different containers that point to different buckets if I want to keep the data separated for some reason. So, I should use the dropdown to choose the correct bucket. If you don’t see the dropdown, you probably need to click the Variables button in the upper right.
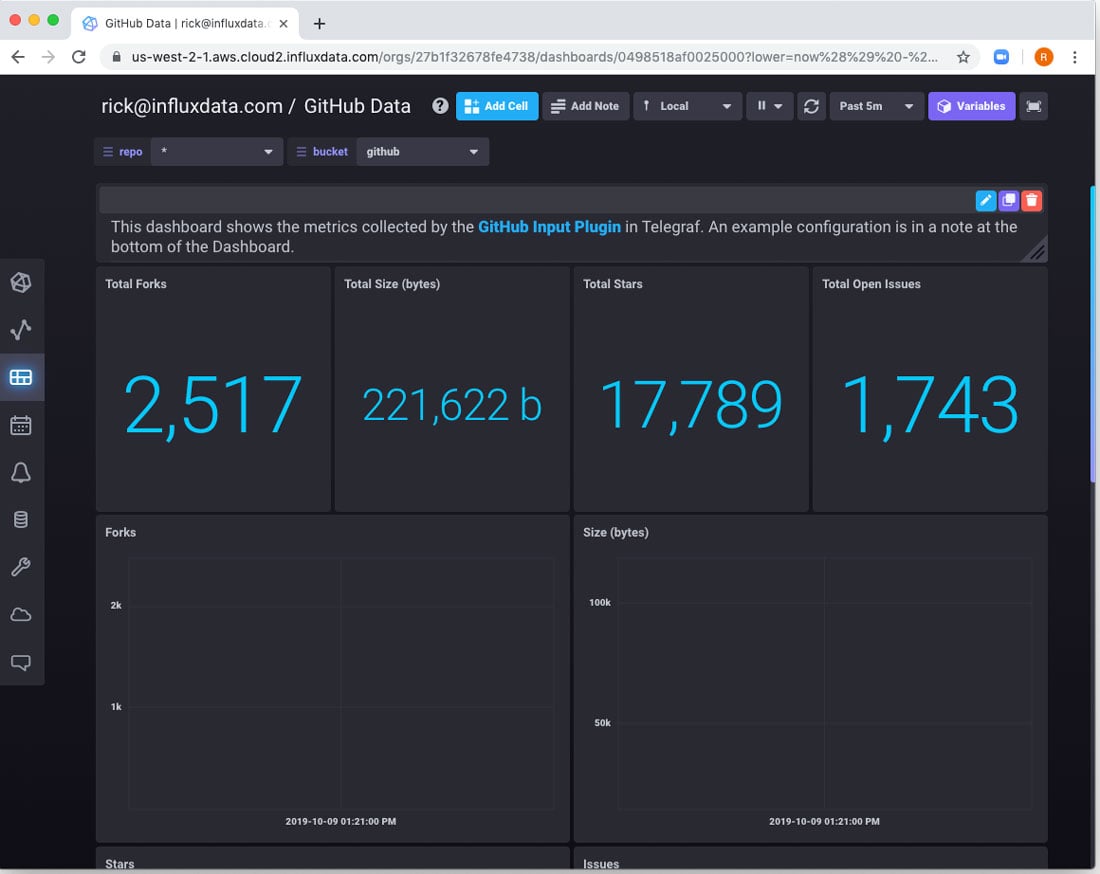
At that point, you can see that some data has been collected.
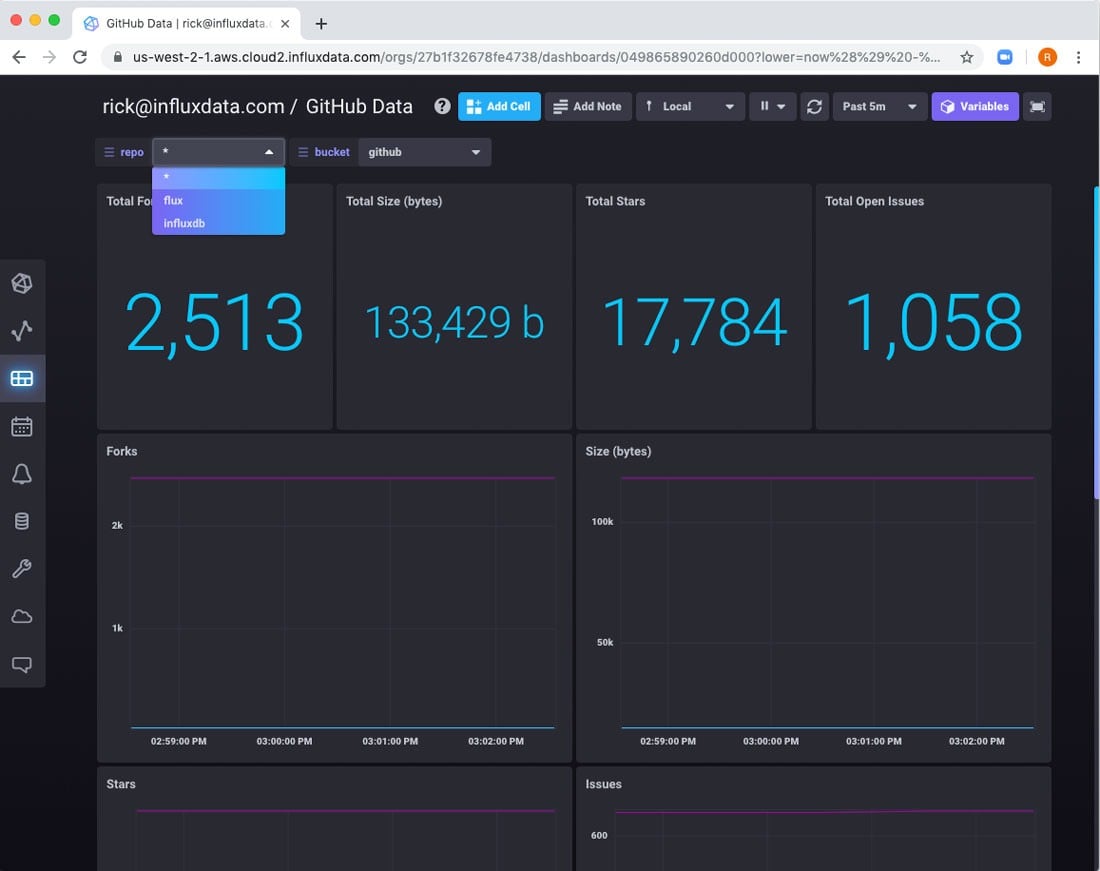
If I wanted to look at a specific repo, I can use the repo dropdown for that.
Finally
If you want to look at how the container is built, fix it or improve it, please take a look at the repo.
