Using Serverless Flux to Monitor Website Response Times
By
Nate Isley
updated December 14, 2025
Use Cases
Developer
Product
Navigate to:
My holiday challenge to explain serverless InfluxDB to my family produced a useful Flux script anyone can put to work today. Before we dive into the code, let me outline the high-level approach to gathering and visualizing how long it takes a website to respond to an HTTP request:
- Create a Flux script to measure a website's performance.
- Decide on the URL to monitor and assign it to
theURLtoMonitorvariable. - Record the current time.
- Make an HTTP call to the website.
- Record the new current time.
- Calculate the website response time by subtracting b. from d.
- Save the URL monitored, the response time, and the HTTP status code into an InfluxDB bucket.
- Decide on the URL to monitor and assign it to
- Create a task to run this Flux script every 5 minutes.
- Build a dashboard to visualize the performance of the website.
The Flux script
import "strings"
import "csv"
import "experimental/http"
import "system"

differenceInNanosec = (earlierTime, laterTime) => {
	return uint(v: laterTime) - uint(v: earlierTime)
}

theURLtoMonitor = "https://v2.docs.influxdata.com/v2.0/"

timeBeforeCall = system.time()
response = http.get(url: theURLtoMonitor)
timeAfterCall = system.time()

responseTime = differenceInNanosec(earlierTime: timeBeforeCall, laterTime: timeAfterCall)

data = "#group,false,false,true,true
#datatype,string,long,string,string
#default,mean,,,
,result,table,service,response_code
,,0,http_ping,${string(v: response.statusCode)}"

csv.from(csv: data)
	|> map(fn: (r) => ({r with _time: now()}))
	|> map(fn: (r) =>
		({r with _measurement: "PingService", url: theURLtoMonitor, method: "GET"}))
	|> to(bucket: "<bucket_name>", orgID: "<orgID>", fieldFn: (r) =>
		({"response_time_ms":  uint(v: responseTime) / uint(v: 1000000)  }))
Deciphering the Flux script
After boilerplate imports @1-4, we have a custom function named differenceInNanosec @6. This is a helper function that converts time into integers for subtraction and helps keep straight which time measurement to subtract from which.
The bulk of the algorithm work comes next and is completed in just a few lines @10-16. @10 assigns the website URL to the variable. Lines @12-14 perform the actual HTTP request in between recording times before and after the call, and we use the times in differenceInNanosec to calculate the website’s response time @16.
After securing the response time, we need to save it to InfluxDB. However, there are a couple of hoops we must jump through. The complication is that our variables are simple data values, but Flux’s InfluxDB connector only writes Flux tables to InfluxDB.
Saving a Flux table sounds simple enough, but we need to create it first and as of today (Flux version 0.57), there are only two ways to create a Flux table. The first is from(bucket:...); Flux automatically creates a table when querying InfluxDB data. The second way to create a Flux table is via csv.from(csv:...).
This second option is our only viable option, and we put it to work @18-22 by constructing csv.from()’s raw input to build the csv table structure. The wrinkle @22 is that I have decided to use the Strings package to create a more dynamic table. You can see this dynamism in action with the use of the string replacement function ${string(v: response.statusCode)} to insert the HTTP status code.
Once the raw string is put together, we create a table object @24 using csv.from(). The table is close to ready for saving but needs a little more shaping to fulfill InfluxDB write requirements. @25-26 adds the required timestamp and _measurement name, and while not a strict requirement, I also add the url and http method as tags. At last, @29 we save the table into the target bucket with the response time in a response_time_ms field fieldFn: (r) => ({"response_time_ms": uint(v: responseTime) / uint(v: 1000000) })).
(Note the conversion to milliseconds to make it easier for humans to understand the measurement.)
Creating the Flux task
A lot happened in the Flux script, but pulling together the code just gets us to the starting line. We want to gather the response time every 5 minutes, and that is the perfect job for a Task.
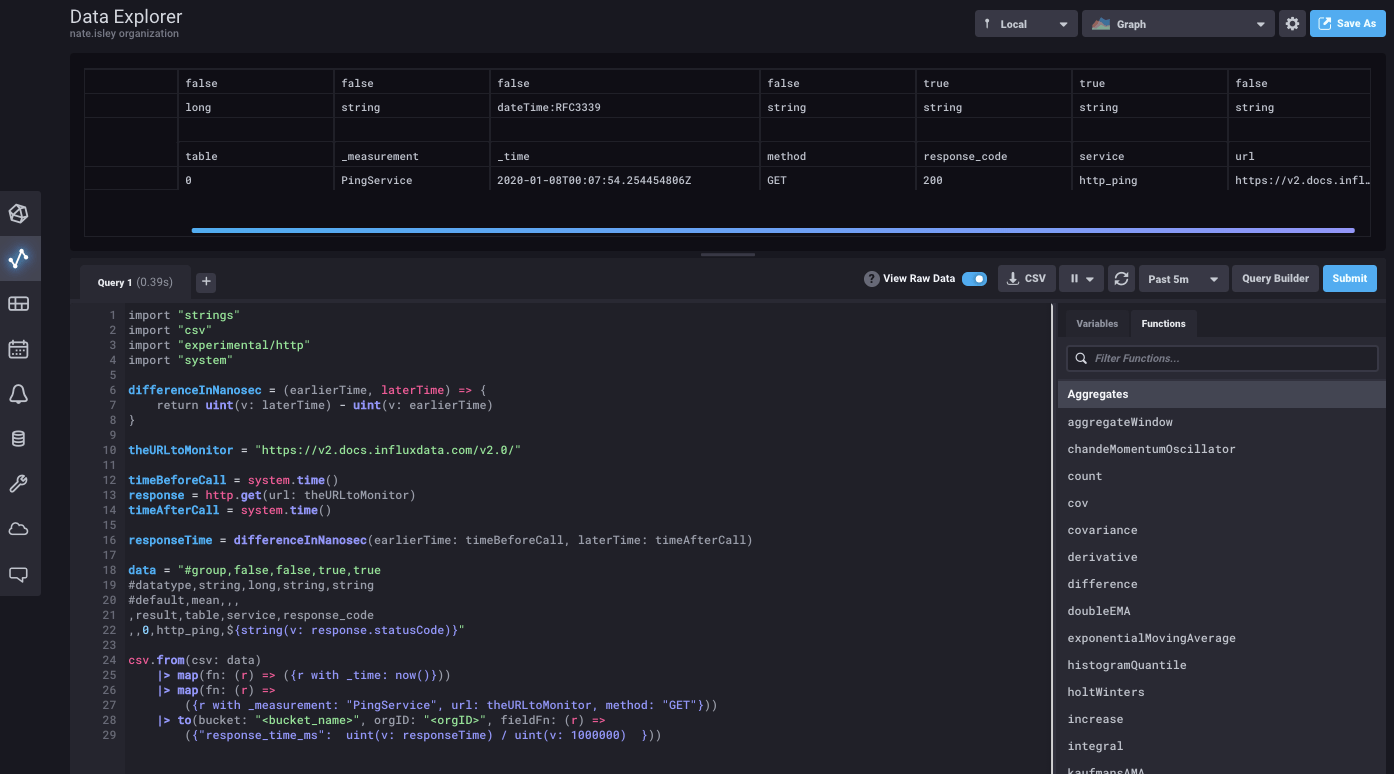
The first step in creating a task is to paste/write your code into a script editor and ensure your code successfully saves a singular data point. You can verify the above website response time Flux by copying and pasting the above code into the script editor and changing the URL, organization ID, and bucket name:
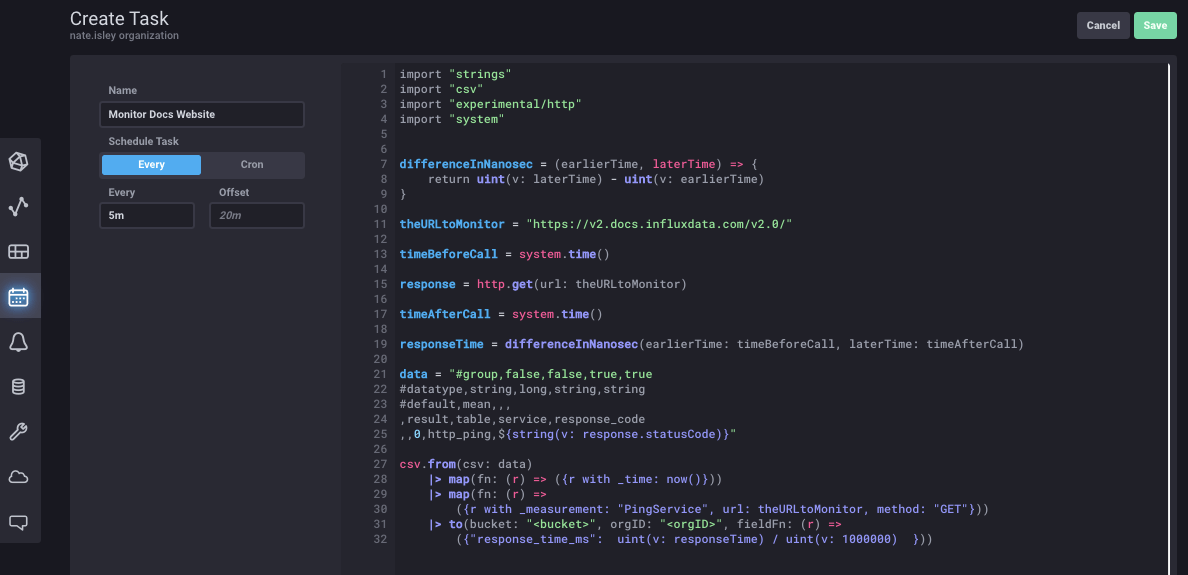
After confirming the script runs successfully, copy and paste your updated script into a task. To do this, go to the Tasks tab on the left and then select Create Task -> New Task in the upper right to open a blank task editor. Paste the code, name the task, and specify that it runs every 5 minutes with “5m”:
After saving, the task will run every 5 minutes to collect and store the response time in response_time_ns.
Build a dashboard to visualize response time
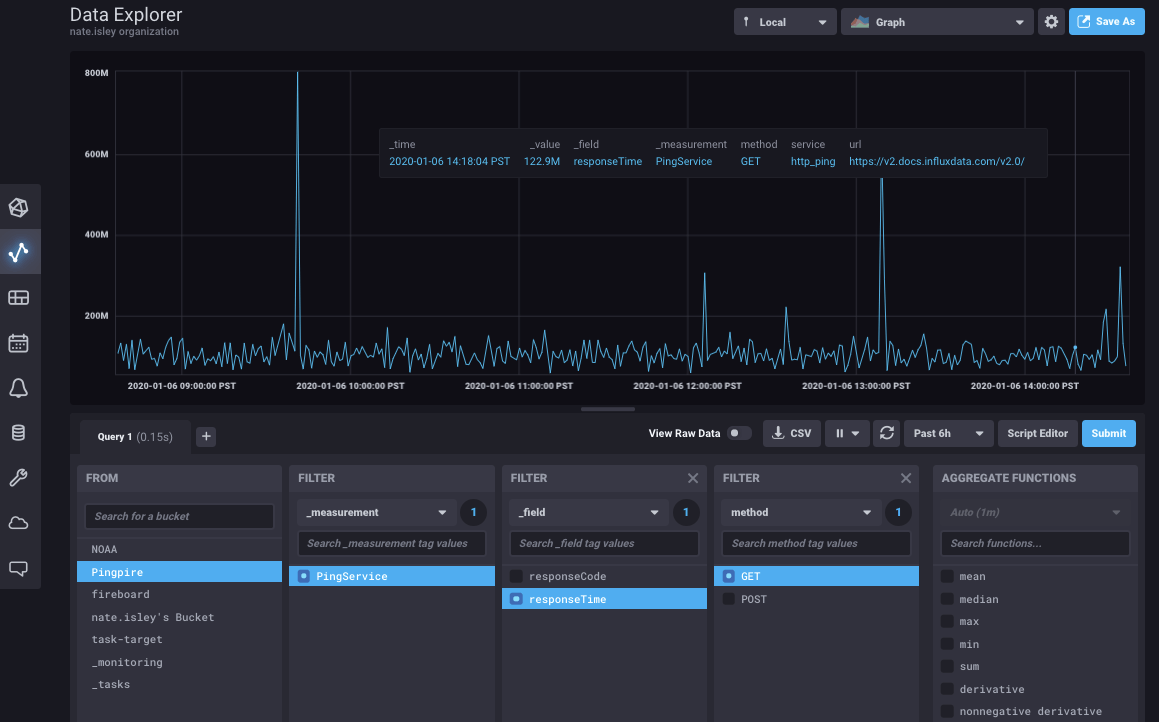
There are almost limitless ways to visualize the collected data, but the easiest is to go to the Data Explorer, find the response time metric, and use the upper right Save As button to create a new dashboard.
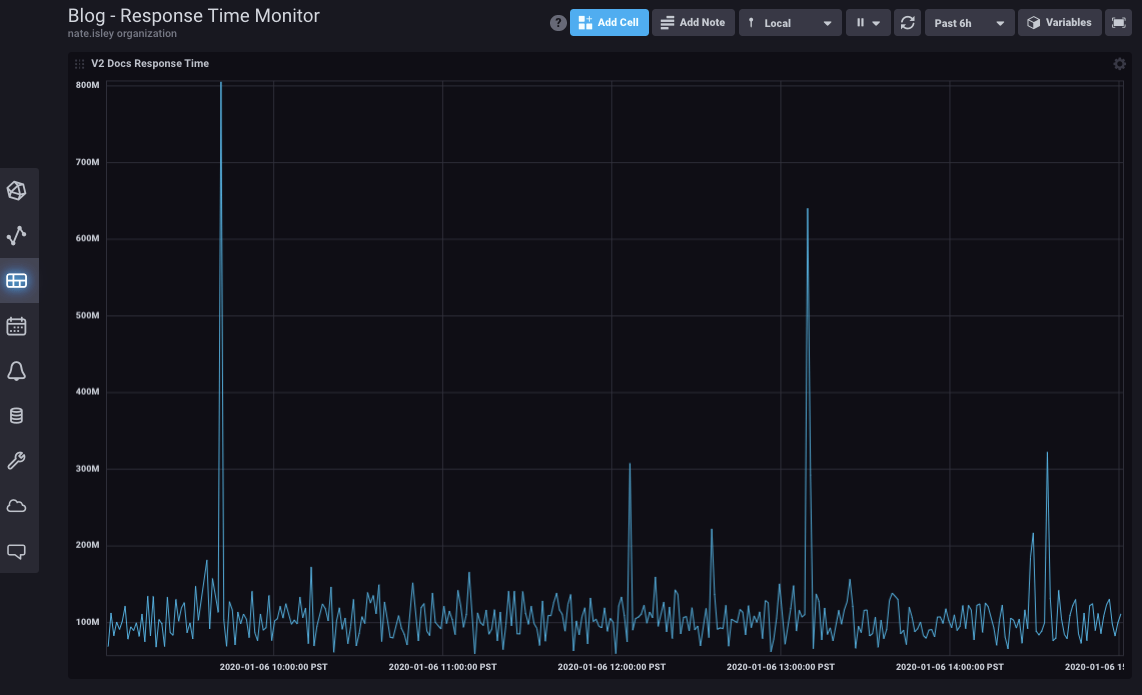
The result:
Tell us what you think!
Try out the above example today by signing up for a free Cloud 2 account or download the latest OSS release to run it locally. As always, if you have questions or feedback, please let us know in our community forum or join us in Slack!
