Table of Contents
Introduction
Telegraf is a daemon that can run on any server and collect a wide variety of metrics from the system (cpu, memory, swap, etc.), common services (mysql, redis, postgres, etc.), or third-party APIs (coming soon). It is plugin-driven for both collection and output of data so it is easily extendable. It is also written in Go, which means that it is a compiled and standalone binary that can be executed on any system with no need for external dependencies (no npm, pip, gem, or other package management tools required).
Telegraf was originally built as a metric-gathering agent for InfluxDB, but has recently evolved to output metrics to other data sinks as well, such as Kafka, Datadog, and OpenTSDB. This allows users to easily integrate InfluxDB into their existing monitoring and logging stack, and to continue using their existing tools that consume Kafka or Datadog data.
In this guide, we will cover:
- How to install and configure Telegraf to collect CPU data
- Running Telegraf
- Viewing Telegraf data in Kafka
- Viewing Telegraf data in the InfluxDB admin interface and Chronograf
The Kafka portion of this guide is entirely optional. If you only want to output your data to InfluxDB, simply skip all the steps regarding Kafka and delete the outputs.kafka section from the provided sample config.
Prerequisites
Before you start, you will need the following:
- InfluxDB Server
- If you don't already have one, you can run the database from within a docker container. I build my Influxdb Docker image from the
build-docker.shscript in theinfluxdb repo.
- If you don't already have one, you can run the database from within a docker container. I build my Influxdb Docker image from the
- Kafka Broker
- For this demo, I'm going to run a Kafka broker in a Docker container, using the spotify/kafka distribution. Assuming you have Docker installed, you can do this like so:
docker run -d -p 2181:2181 -p 9092:9092 \
    --env ADVERTISED_HOST=localhost \
    --env ADVERTISED_PORT=9092 spotify/kafka
NOTE: This entire guide can also be performed on OSX, just replace localhost everywhere with yourboot2docker ip or docker-machine ip <name>, and install Telegraf via Homebrew.
Step 1 – Installing Telegraf
Telegraf can be installed via .deb or .rpm packages available on the github page, but for this simplified demo I’ll just use a standalone binary:
wget http://get.influxdb.org/telegraf/telegraf_linux_amd64_0.1.8.tar.gz
tar -xvf telegraf_linux_amd64_0.1.8.tar.gz
mv ./telegraf_linux_amd64 /usr/local/bin/telegraf
Step 2 – Configuring Telegraf
Telegraf provides a command for generating a sample config that includes all plugins and outputs:telegraf -sample-config, but for the purposes of this guide, we will use a more simple config file, paste the configuration found below into a file called ~/telegraf.toml. You will need to edit the two indicated lines to match your environment if necessary.
[tags]
    dc = "us-east-1"

# OUTPUTS
[outputs]
[outputs.influxdb]
    # The full HTTP endpoint URL for your InfluxDB instance
    url = "http://localhost:8086" # EDIT THIS LINE
    # The target database for metrics. This database must already exist
    database = "telegraf" # required.

[outputs.kafka]
    # URLs of kafka brokers
    brokers = ["localhost:9092"] # EDIT THIS LINE
    # Kafka topic for producer messages
    topic = "telegraf"

# PLUGINS
# Read metrics about cpu usage
[cpu]
    # Whether to report per-cpu stats or not
    percpu = false
    # Whether to report total system cpu stats or not
    totalcpu = true
Step 3 – Running Telegraf
Now we can run Telegraf with the -test flag, outputting one set of metrics from the cpu plugin to stdout. One caveat is that this will not include CPU usage percent yet, because that requires taking two measurements.
$ telegraf -config ~/telegraf.toml -test
* Plugin: cpu
> [cpu="cpu-total"] cpu_user value=5.75
> [cpu="cpu-total"] cpu_system value=4.59
> [cpu="cpu-total"] cpu_idle value=11226.01
[...]
> [cpu="cpu-total"] cpu_busy value=12.15
We are now ready to run Telegraf on our system, it will begin sending its measurements to the configured InfluxDB server & Kafka brokers, using the automatic host tag and any tags configured in the toml file:
$ telegraf -config telegraf.toml
2015/09/01 22:01:41 Starting Telegraf (version 0.1.8)
2015/09/01 22:01:41 Loaded outputs: influxdb kafka
2015/09/01 22:01:41 Loaded plugins: cpu
2015/09/01 22:01:41 Tags enabled: dc=us-east-1 host=myserver
As we can see,Telegraf tells us that it has loaded the influxdb and kafka output sinks, and the cpucollection plugin.
Step 4 – Viewing Kafka Data
We can now use the Kafka console consumer to validate that our Kafka broker is receiving messages of each InfluxDB line-protocol message emitted from Telegraf.
To run the console consumer, download Kafka source:
wget http://apache.arvixe.com//kafka/0.8.2.0/kafka_2.10-0.8.2.0.tgz
tar -zxf kafka_2.10-0.8.2.0.tgz
cd kafka_2.10-0.8.2.0/
Then run (replace localhost with your Kafka broker address if necessary):
$ ./bin/kafka-console-consumer.sh --zookeeper localhost:2181 --topic telegraf --from-beginning
[...]
cpu_percentageUser,cpu=cpu-total,dc=us-east-1,host=myserver value=0.4024144869214442
cpu_percentageSystem,cpu=cpu-total,dc=us-east-1,host=myserver value=0.8048289738428706
cpu_percentageIdle,cpu=cpu-total,dc=us-east-1,host=myserver value=98.6921529174951
cpu_percentageNice,cpu=cpu-total,dc=us-east-1,host=myserver value=0.0
cpu_percentageIowait,cpu=cpu-total,dc=us-east-1,host=myserver value=0.0
cpu_percentageIrq,cpu=cpu-total,dc=us-east-1,host=myserver value=0.0
cpu_percentageSoftirq,cpu=cpu-total,dc=us-east-1,host=myserver value=0.10060362173035882
cpu_percentageSteal,cpu=cpu-total,dc=us-east-1,host=myserver value=0.0
cpu_percentageGuest,cpu=cpu-total,dc=us-east-1,host=myserver value=0.0
cpu_percentageGuestNice,cpu=cpu-total,dc=us-east-1,host=myserver value=0.0
cpu_percentageStolen,cpu=cpu-total,dc=us-east-1,host=myserver value=0.0
cpu_percentageBusy,cpu=cpu-total,dc=us-east-1,host=myserver value=1.3078470824946893
As shown above, each InfluxDB line protocol message that Telegraf sends to our database is also getting logged to our Kafka broker, allowing us to consume the line-protocol from arbitrary tools that interact with Kafka.
Step 5 – Viewing InfluxDB data in the Web UI and via Chronograf
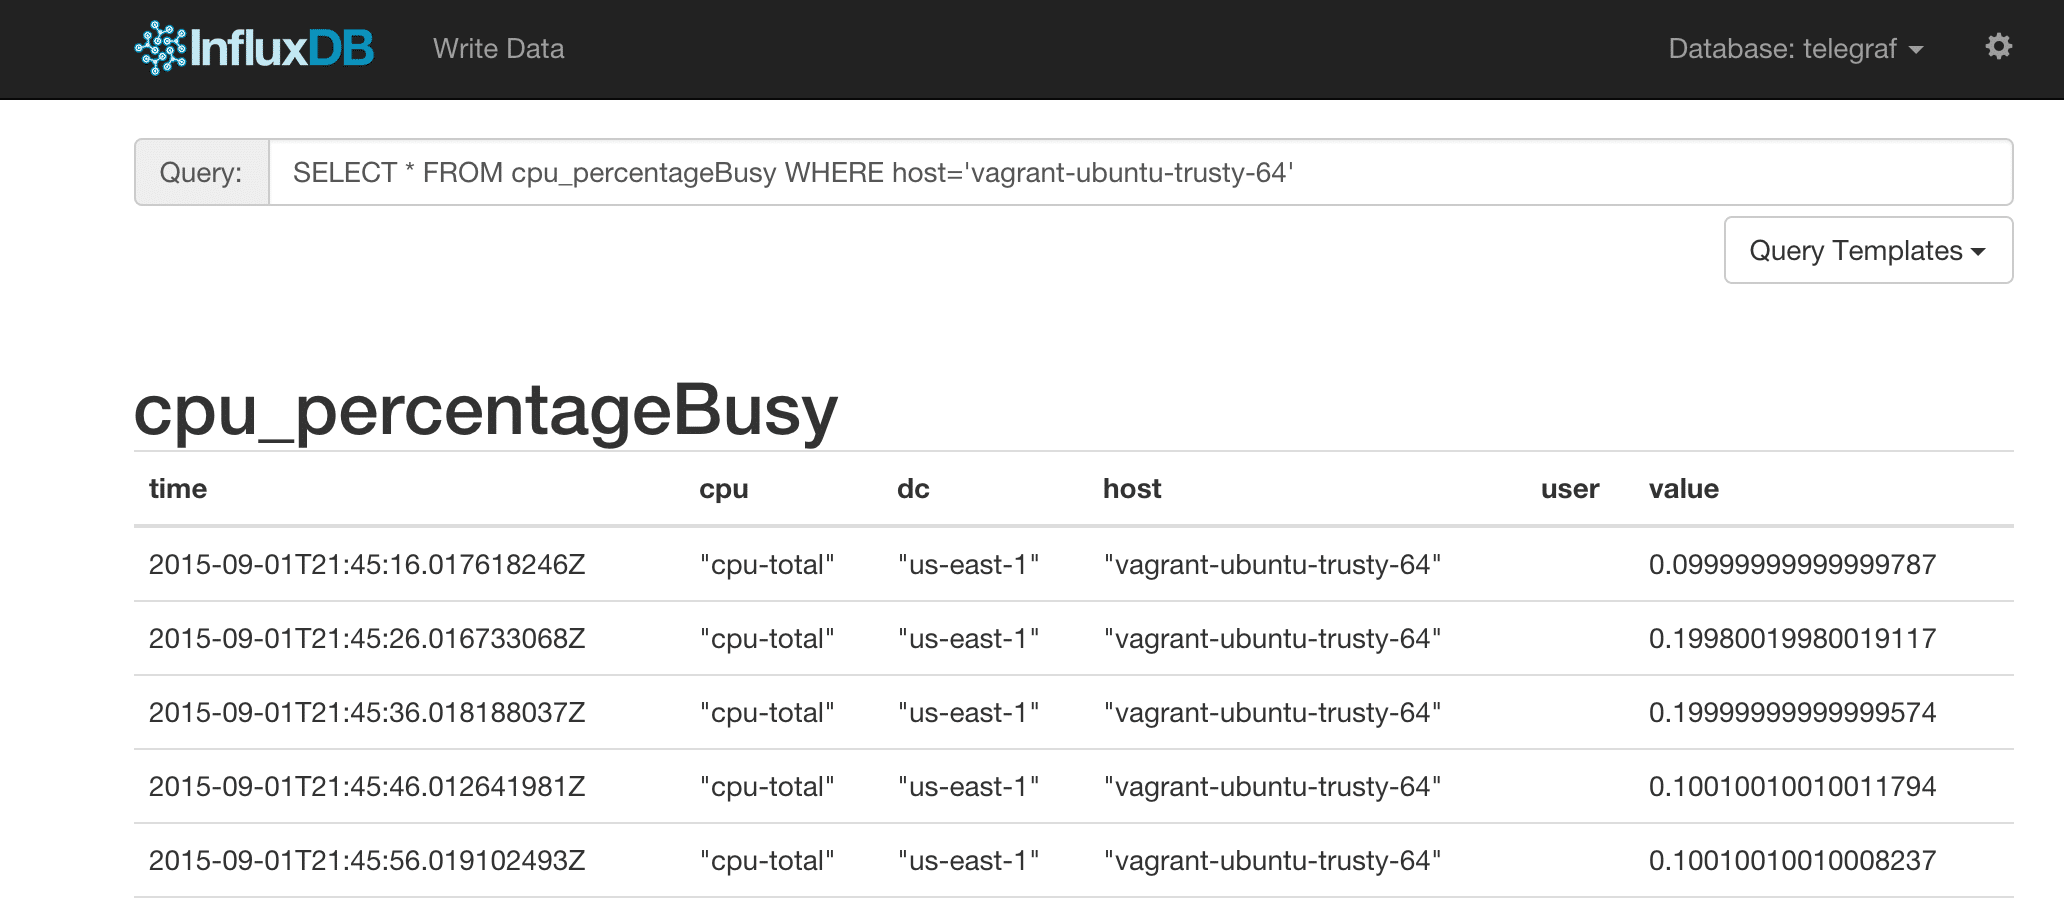
Now if we navigate to our InfluxDB web interface at http://localhost:8083, we can query for ourcpu_percentageBusy data and see that Telegraf is outputting proper measurements.
SELECT * FROM cpu_percentageBusy WHERE host='myserver' AND dc='us-east-1'
While the default InfluxDB admin interface is fairly basic, Influx also develops a time series visualization tool called Chronograf, which can make graphs that look like this:

This is graphing a query of the cpu busy percentage as seen below, which can also be made using Chronograf’s built-in query builder:
SELECT "value" FROM "telegraf".."cpu_percentageBusy" WHERE time > now() - 1h AND "cpu"='cpu-total'
Next Steps
Telegraf has a wealth of plugins already available and a few output options too. Documentation on how to configure all plugins and outputs can be found by running telegraf -sample-config, or for individual plugins by running telegraf -usage PLUGIN_NAME.
