Using the Telegraf Elasticsearch Input Plugin
By
Sonia Gupta
updated December 14, 2025
Use Cases
Product
Developer
Navigate to:
The Telegraf Elasticsearch plugin is really easy to use, and it can show you a lot of useful information. To begin, let’s get the InfluxDB sandbox up and running as well as an Elasticsearch node that we can populate with some data using Kibana.
Installing the InfluxDB Sandbox
For this tutorial I’ve opted to use the InfluxDB Sandbox, which is really easy to get running. Just clone the repository and run the ./sandbox up command and you’ve got all four components of the TICK stack running in their own containers. Follow the instructions here to clone the repository and get it running.
Installing Elasticsearch and Kibana
Elasticsearch requires at least Java 8 to be running on your machine, so I first ensured that was installed. Then, since I’m running Mac OS, I used Homebrew to install Elasticsearch and Kibana on my machine: brew install elasticsearch and brew install kibana. As of the time of this article, using Homebrew will install Elasticsearch version 6.7 and Kibana version 6.7. If you want to install the most recent version of Elasticsearch, you will need to follow the instructions available here.
If you used Homebrew to install both Elasticsearch and Kibana, you can start them up by entering elasticsearch in one terminal tab and entering kibana in a second terminal tab. You will keep them running through the duration of setting up the Elasticsearch plugin.
Then navigate to localhost:5601 and click on “Dev Tools” in the left sidebar and you should see something like this:
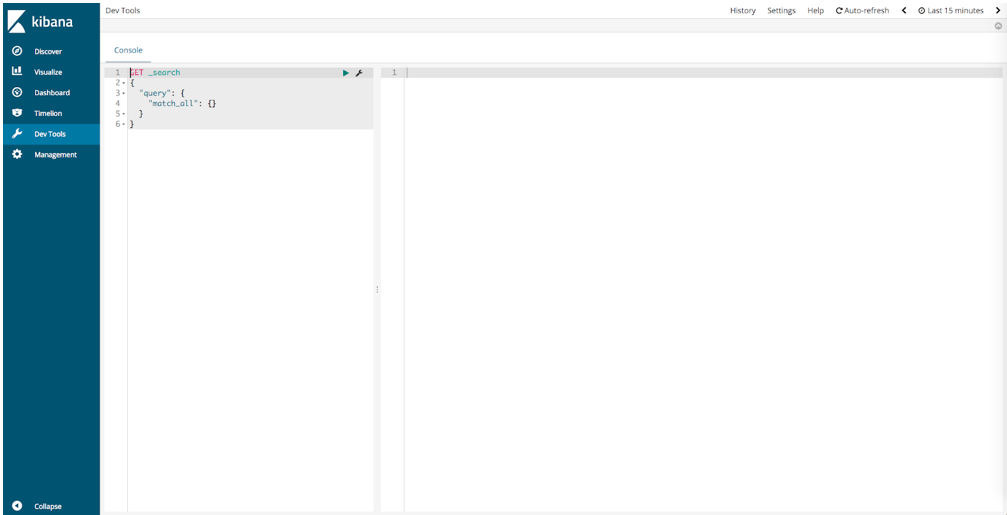
This is the Kibana UI from which you can make requests to your Elasticsearch node.
I recommend playing around with your Elasticsearch node and Kibana using the tutorial here. It will show you how to populate your node with data and check cluster health (a cluster consists of one or more nodes, so you also have a cluster). For example, running
PUT /user/_doc/1?pretty
{
  "name": "Malala Yousafzai"
}
in Kibana will create a user index and insert a user with an id of 1. And running GET /user/_doc/1?pretty in Kibana will fetch that user and return
{
  "_index" : "user",
  "_type" : "_doc",
  "_id" : "1",
  "_version" : 2,
  "found" : true,
  "_source" : {
    "name" : "Malala Yousafzai"
  }
}
Monitoring Elasticsearch
Now that you’ve got some indexes populated with data in your Elasticsearch node, it’s time to monitor the node! First, if you’ve got the sandbox running, shut it down with ./sandbox down.
Then open up the sandbox code in your favorite editor and navigate to telegraf/telegraf.conf. This is where you will find the various input and output plugins that come configured with Telegraf, and also where you will add the configuration for the Elasticsearch plugin.
Copy and paste the configuration from the Elasticsearch plugin README at the bottom of your telegraf.conf file, like so:
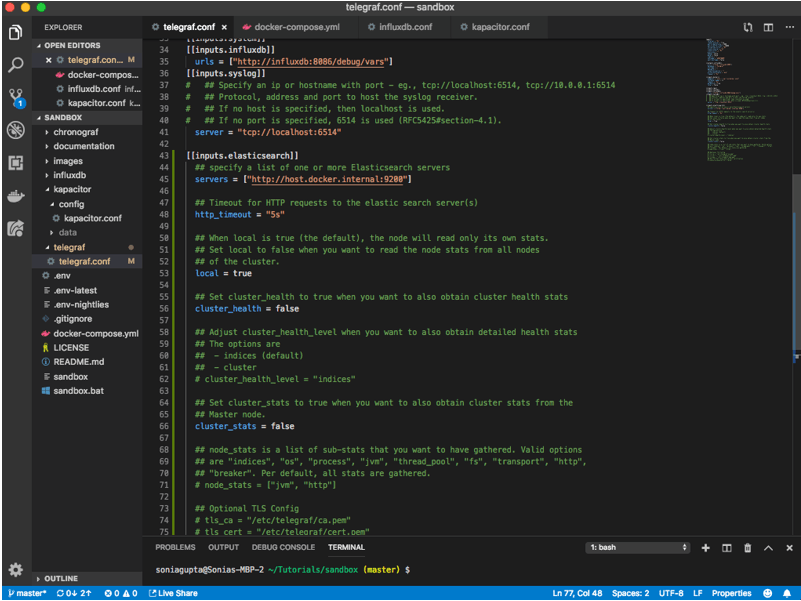
Note that I have made a change to the configuration. Instead of servers = ["http://localhost:9200"] I have servers = ["http://host.docker.internal:9200"]. This is because we are running our instance of Telegraf in a docker container and we need it to be able to communicate with the Elasticsearch node that we are running locally, outside of that docker container.
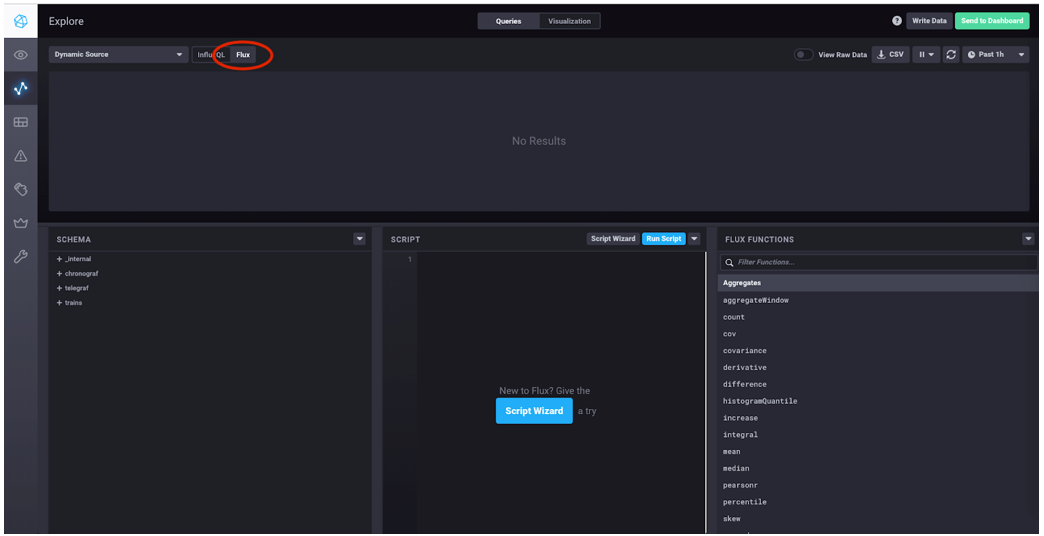
Save the file and spin up the sandbox again with ./sandbox up and navigate to the Chronograf tab that opens up at localhost:8888. Click “Explore” in the left-hand navigation bar. Then click “Flux” to switch to using Flux for queries.
Then, under “SCHEMA,” click “telegraf,” then “MEASUREMENTS,” then “elasticsearch_indices,” then “Add Filter” next to “docs_count.” This will construct a Flux query in the SCRIPT block:
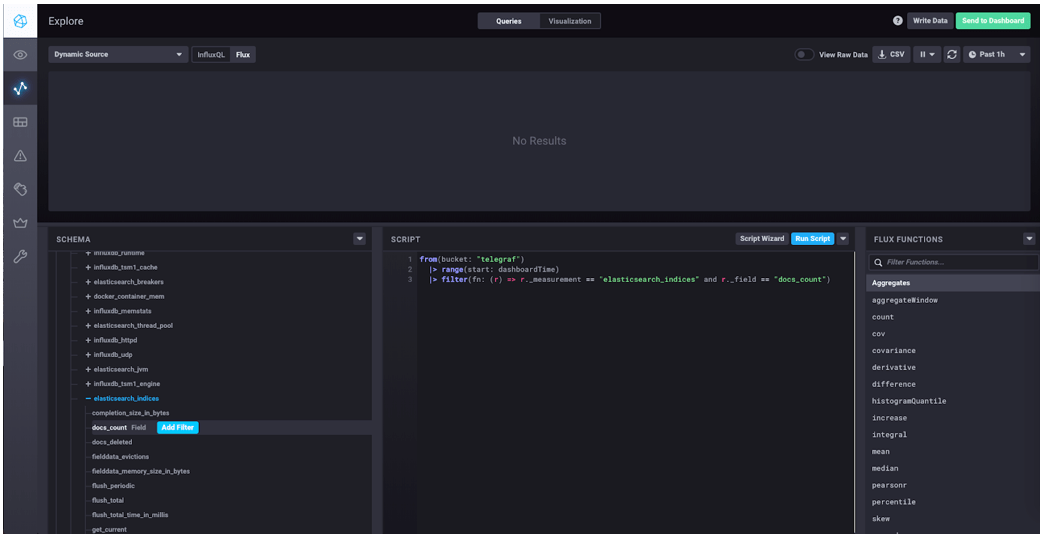
Your query should look like this:
from(bucket: "telegraf")
  |> range(start: dashboardTime)
  |> filter(fn: (r) => r._measurement == "elasticsearch_indices" and r._field == "docs_count")
Click “Visualization” at the top of the page and select “Single Stat.” Then click “Queries” to get back to the query block, and click “Run Script.” You should see in the top block on the page the number of documents (at least one) that you created using the Elasticsearch tutorial. This is the kind of data that you can see with the Elasticsearch plugin.
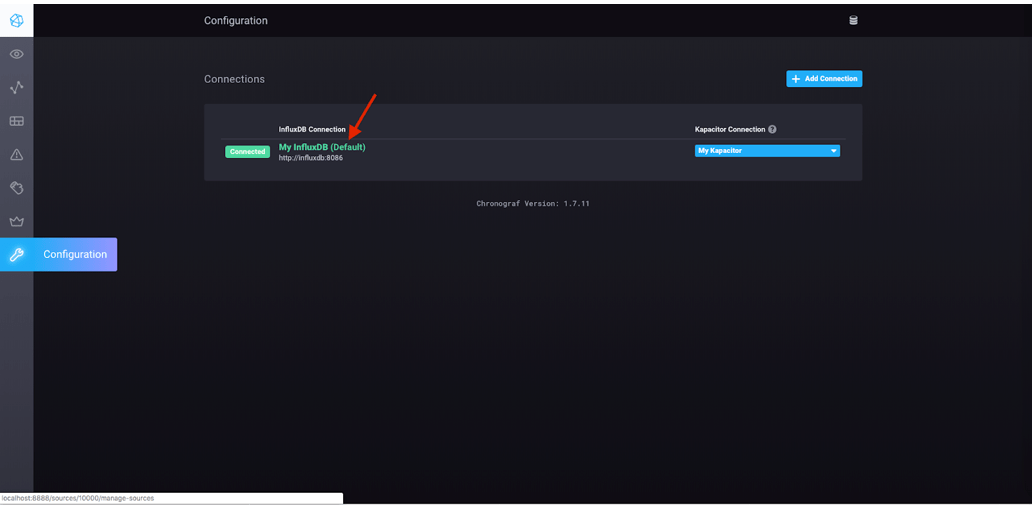
There are several other metrics available to you, and you can actually visualize some of those metrics by pulling in the pre-built dashboard. To do so, click “Configuration” in the left hand navigation bar and you will see your InfluxDB connection. Click on the name of that connection:
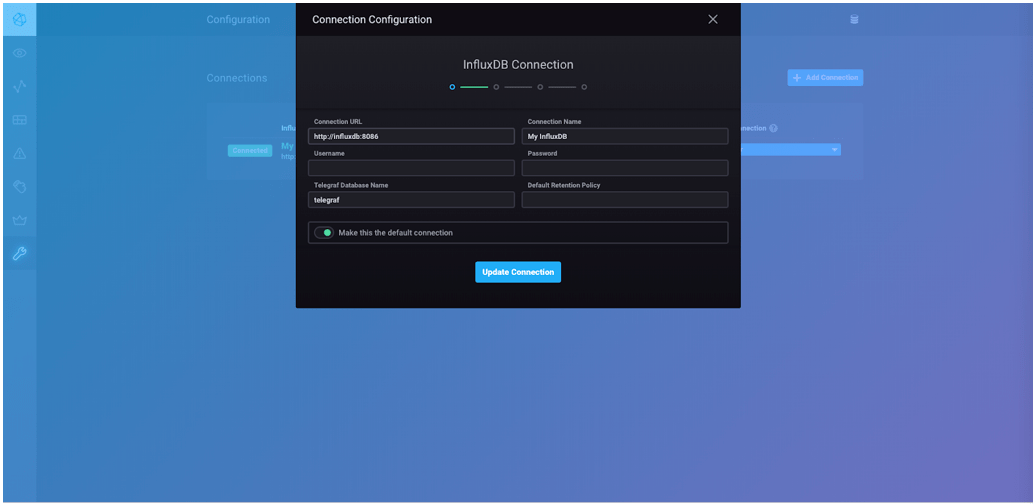
Then click “Update Connection” in the window that pops up:
Then scroll until you see “Elasticsearch,” and click on that box:
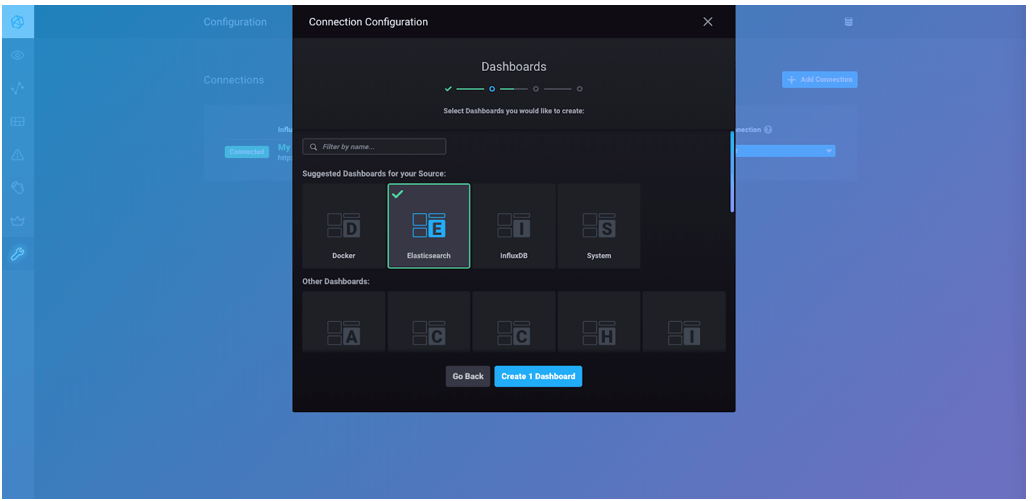
Click “Create 1 Dashboard.” Click “Skip” when you are asked about your Kapacitor Connection then click “Finish.” Then click “Dashboards” in the left-hand navigation bar, and you should see your Elasticsearch dashboard in the list. Clicking on that will take you to the dashboard itself:
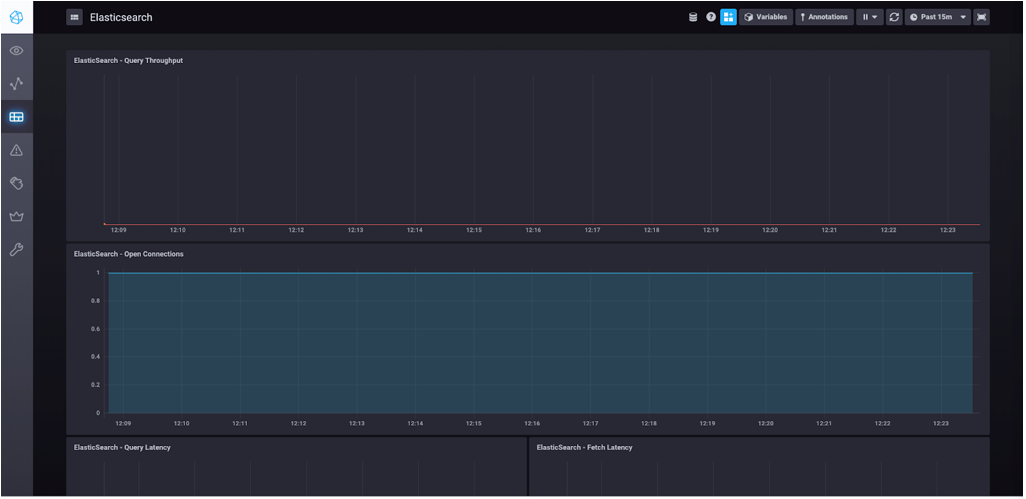
And that’s it! You’ve now successfully installed Elasticsearch and are able to monitor its performance using the Telegraf plugin as well as use the included dashboard to visualize some critical Elasticsearch metrics.
