Webinar Highlights: Modern vSphere Monitoring and Dashboards Using InfluxDB, Telegraf and Grafana
By
Caitlin Croft
updated December 14, 2025
Product
Use Cases
Developer
Navigate to:
Recently InfluxAce Jorge de la Cruz presented on “Modern vSphere Monitoring and Dashboards Using InfluxDB, Telegraf and Grafana”. Jorge is a Systems Engineer at Veeam Software and has been using InfluxDB for years. In case you missed attending the live session, we have shared the recording and the slides for everyone to review and watch at your leisure.
Webinar highlights
Monitoring 101
Jorge explained the basics prior to diving into the specifics of vSphere monitoring. There are those who believe in proactive monitoring and already have tools implemented to understand their infrastructure better. And then there are those who, as Jorge pointed out, “are surrounded by a fire in the data center, or whatever they need to monitor They may think everything is fine, but it isn’t.”
vSphere monitoring
In this webinar, Jorge de la Cruz dove into vSphere monitoring best practices. Determining the most critical areas you want to monitor is a key first step. He expands and demonstrates that IT administrators are interested in having visibility into their CPU, data storage and virtual machines. At the end of the day, they’re keen on improving their operations.
Telegraf + InfluxDB + Grafana
Jorge uses Telegraf to collect time-stamped data from a variety of sources. He is specifically using the vSphere Telegraf plugin. InfluxDB is the open source, purpose-built time series database he uses as it provides him with high-performance writes and efficiently stores the data. Grafana is used for visualizations and graphs.
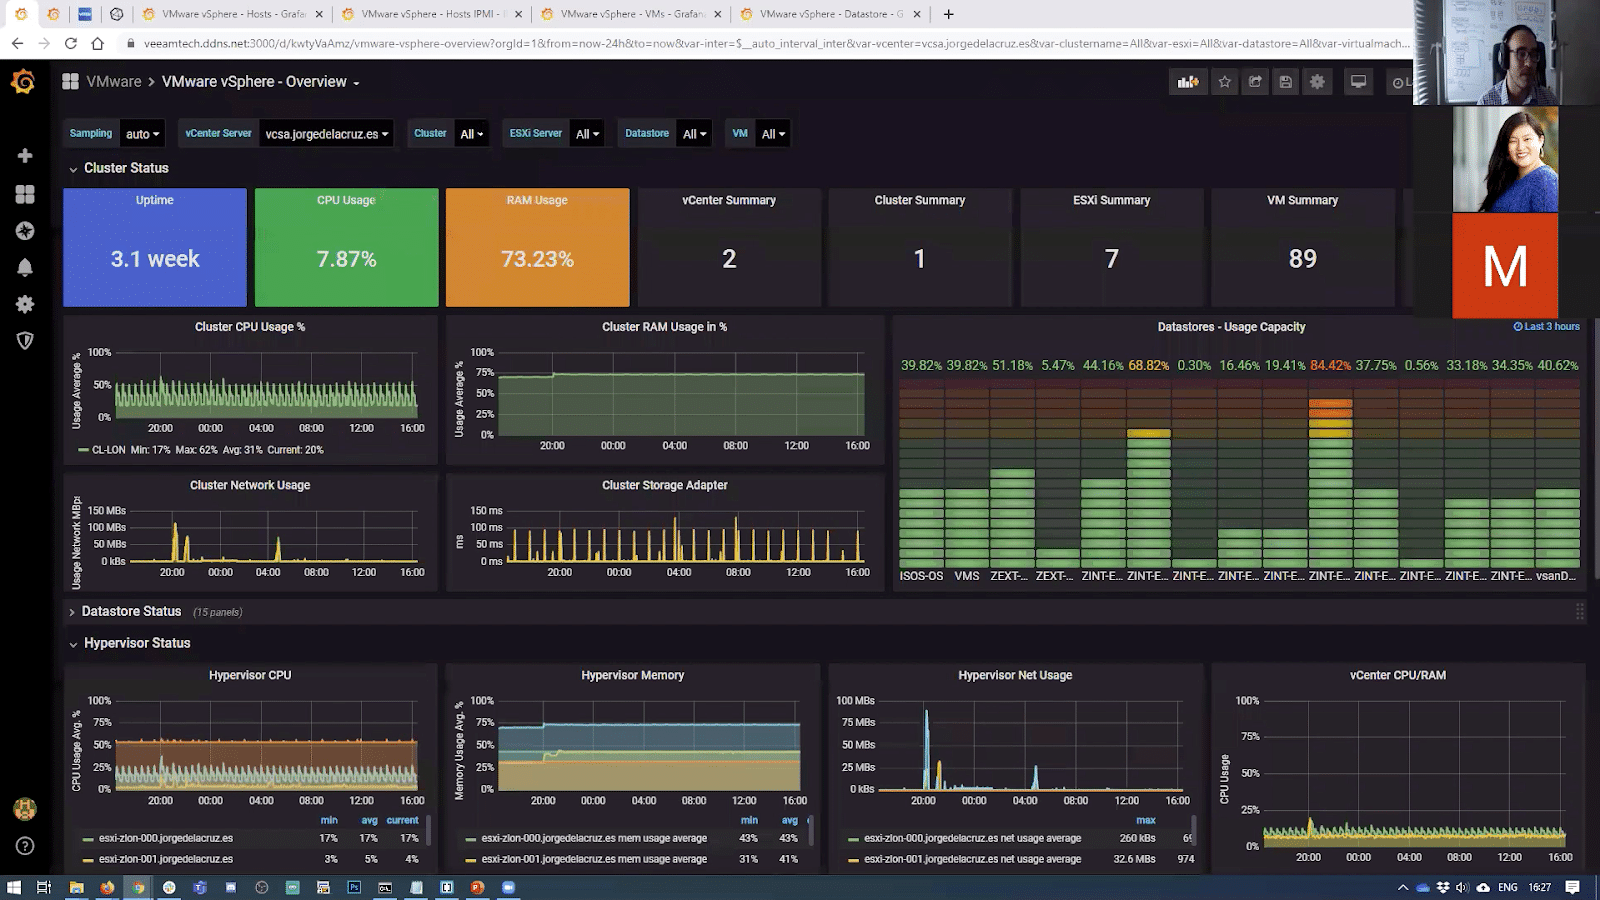
Demo time
Jorge was very brave and provided a live demo during his webinar! I’m glad to say it went off without a hitch! You just never know with live demos But Jorge said “he likes to live dangerously”. He showed us his beautiful Grafana dashboards which help him understand the overall status of his vCenter server.
Timeline
It was great seeing Jorge walk through his monitoring journey. He wrote his first Grafana blog in June 2016, and in June 2017 he created his first vSphere monitoring iteration using a Powershell script from a vExpert. Five years after his first blog, his VMware vSphere Overview Dashboard has been downloaded over 5,400 times!
Q&A time
Audience members had tons of questions for Jorge here are a few of them.
Question: Can you give us a URL so we can customize the configuration? Answer: You can download all of the dashboards and edit them. The configuration for the telegraf.conf is in the telegraf.conf. If you’re looking for the Telegraf plugin, click here. It’s on GitHub and it’s also available here.
Question: Is it possible to get ESXi metrics such as esxtop via Telegraf? Answer: You will need to build some custom scripts by using the PowerCLI that you can get today already from Linux, I’m pretty sure you should be able to download esxtop results and parse them and save them in InfluxDB.
Question: Can you review after creating the two .conf files? Where do you put those? Where can I find these Telegraf configurations? Answer: There is a directory for them. I recommend putting them in /etc/telegraf/telegraf.d - for example the vCenter one would be: /etc/telegraf/telegraf.d/vsphere-stats.conf. You don’t want to edit the telegraf.conf file it will ask you if you want to overwrite the telegraf.conf file. It’s better to have different vCenters or anything else you want to monitor with Telegraf, inside the folder with the specific configuration.
Question: What’s your opinion on using a VM as a Docker container to run Telegraf? Why would you use a VM vs a container deployment? Any advantages either way? Answer: You can do it, but remember, if you’re starting to leverage Telegraf massively, then the container is going to be a massive beast. It’s better to think about how many metrics you want to store and plan ahead.
If you’re interested in checking out the full webinar and listen to the rest of the Q&A, click here!
