Why Use K-Means for Time Series Data? (Part One)
By
Anais Dotis-Georgiou
updated December 14, 2025
Use Cases
Developer
Navigate to:
As an only child, I spent a lot of time by myself. Oftentimes my only respite from the extreme boredom of being by myself was daydreaming. I would meditate on objects in my environment and rotate them around in my head. I now attribute my love of jigsaw puzzles, math, and art to all the time I dedicated to visualization practice. My love for those things inspired me to try and understand more about how statistical functions and K-Means Clustering are used in anomaly detection for time series data.
Time Series Clustering is an unsupervised data mining technique for organizing data points into groups based on their similarity. The objective is to maximize data similarity within clusters and minimize it across clusters.
In this first post, I provide high-level answers for the following questions:
- What is K-Means clustering?
- How is it used for time series data?
If you’re still interested in learning more, please continue on to the second post. There, I will focus on:
- Some code showing how K-Means is used
- Why you shouldn't use K-Means for contextual time series anomaly detection
In order to effectively describe these concepts, I will share plenty of math, graphical visualizations, and art (for brain breaks). I hope they help!
What is K-Means Clustering?
First I want to give a general overview of K-means clustering. If you’re familiar with K-means, I suggest skipping to the next section.
Machine learning systems fall into 4 major categories that are defined by the amount of human supervision that they receive for training. These categories include unsupervised, semi-supervised, supervised, and reinforcement learning. K-Means clustering is an unsupervised learning technique. In other words, the system is not trained with human supervision. By contrast, supervised learning involves feeding training data into your machine learning algorithm that includes labels.
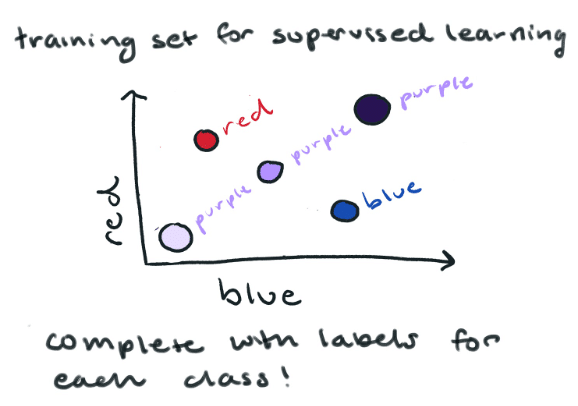
Here is a simple example of supervised learning. In the image below we have a series of colors and their corresponding red/blue value. We have labeled each color in our training set.
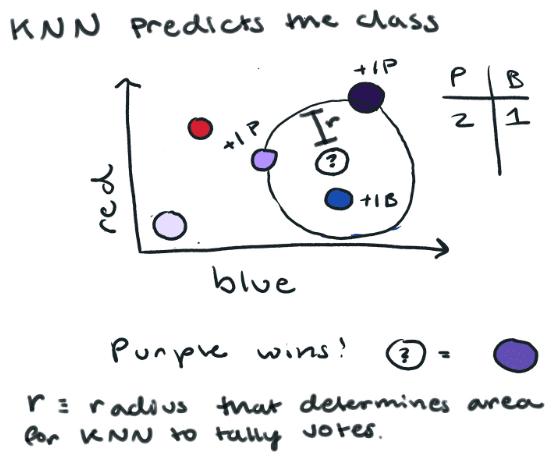
Now we want to know if this new color is red, blue, or purple. We could use K-Nearest Neighbor (a supervised learning algorithm) to predict which color class it belongs to. K-Nearest Neighbor (KNN) essentially looks at all the other points near to determine the class of our color by the majority vote of its neighbors. In this case, the prediction for our mystery color is purple.
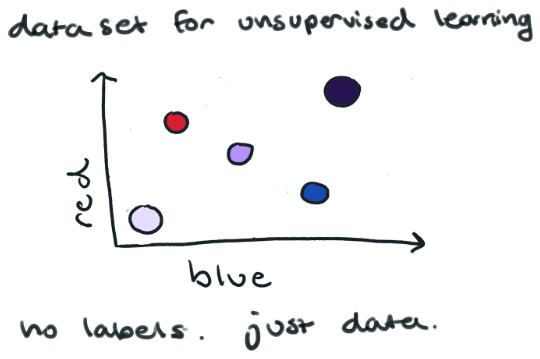
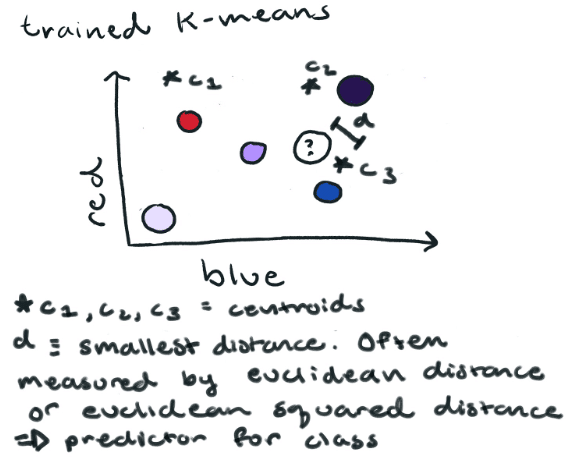
Now let’s look at a training set for unsupervised learning. Here we don’t assign labels to our data. If we use K-Means clustering we only set the number of clusters or classes we want. In this case n_clusters = 3 (red, blue, and purple). K-means will generate three points, centroids, which are at the center of a cluster. Now if we want to tell what color a new red/blue value belongs to, we could simply determine which centroid is the closest and assign the color to the corresponding class. It’s a good idea to mention that using the distance from the centroid to our point is not always the best idea. I’ll go into more detail about that and how K-means determines the centroids in the next post. Spoiler alertthere are some serious downfalls associated with both.
How is It Used for Time Series Data?
Why do people use an unsupervised learning technique like K-Means clustering for time series data analysis? To answer this question it’s a good idea to step back and ask, “why should we use machine learning for time series data analysis at all”? First of all, as poetic as the words “machine” and “learning” are, it’s good to remember that for many cases machine learning is not the smart solution. Let’s assume
…you consider one-off spikes to be anomalies and want to detect them. Using a threshold around a moving average could be a good idea.
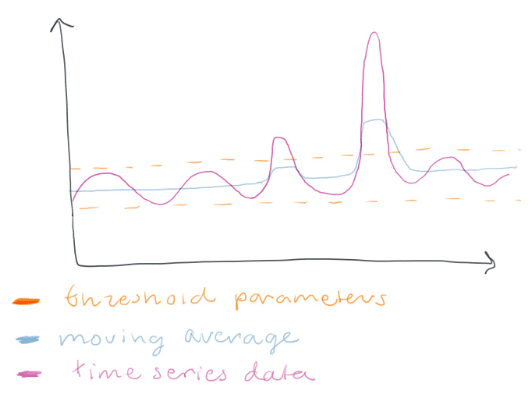 <figcaption> Anytime the moving average goes outside the threshold, we have an anomaly.</figcaption>
…you have tightly packed data, a highly controlled system, or a normal distribution. Determining anomalies based on the standard deviation is smart.
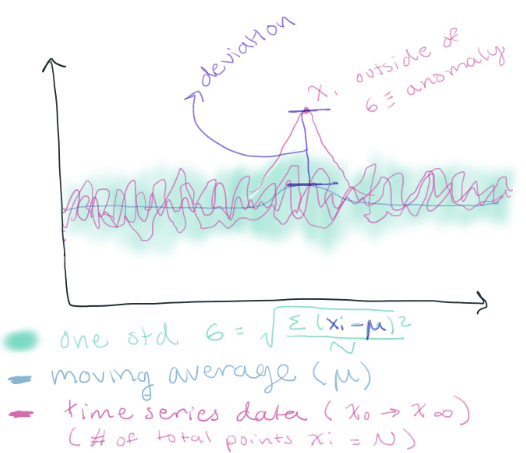 <figcaption> How cool! Using the standard deviation allows me to find an anomaly across multiple time series data. You simply sum the variance (the mean of the deviation squared) and take the square root of that to find the standard deviation. Any point outside the standard deviation can be considered an anomaly.</figcaption>
…your data has a wide range and you want to detect spikes of a certain magnitude. In this case, you might want to define non-anomalous data by any data that lies within the interquartile range.
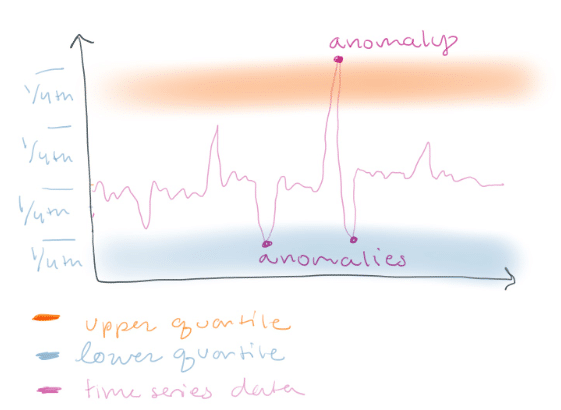 <figcaption> This technique is especially good if you prefer to get false positives or to highlight risky behavior. Imagine you are in a chemical plant and you are monitoring the pressure of a pipe from a gauge. This pressure sensor is used to monitor the behavior of a valve that is constantly opening and closing to control the pressure. You might want to set an alert that tells workers to open the valve and release pressure every time the pressure is in the upper quartile range to prioritize safety.</figcaption>
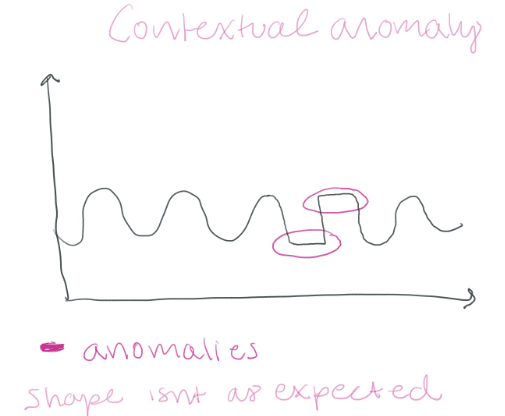
Things get tricky when you need to alert on subtle changes in your data. In this case, statistical functions might not be able to help you. What we need is something that “understands” what our data looks like and can help us determine if our data deviates from that norm. We can use contextual anomaly detection or collective anomaly detection. Contextual anomalies are data instances that are, in human terms, “not being themselves”. The anomalous behavior is defined by the normal system itself. If I suddenly jumped out of my seat and started throwing punches like a woman in a one-person mosh pit, we would say this is a contextual anomaly because I am typically very calm.
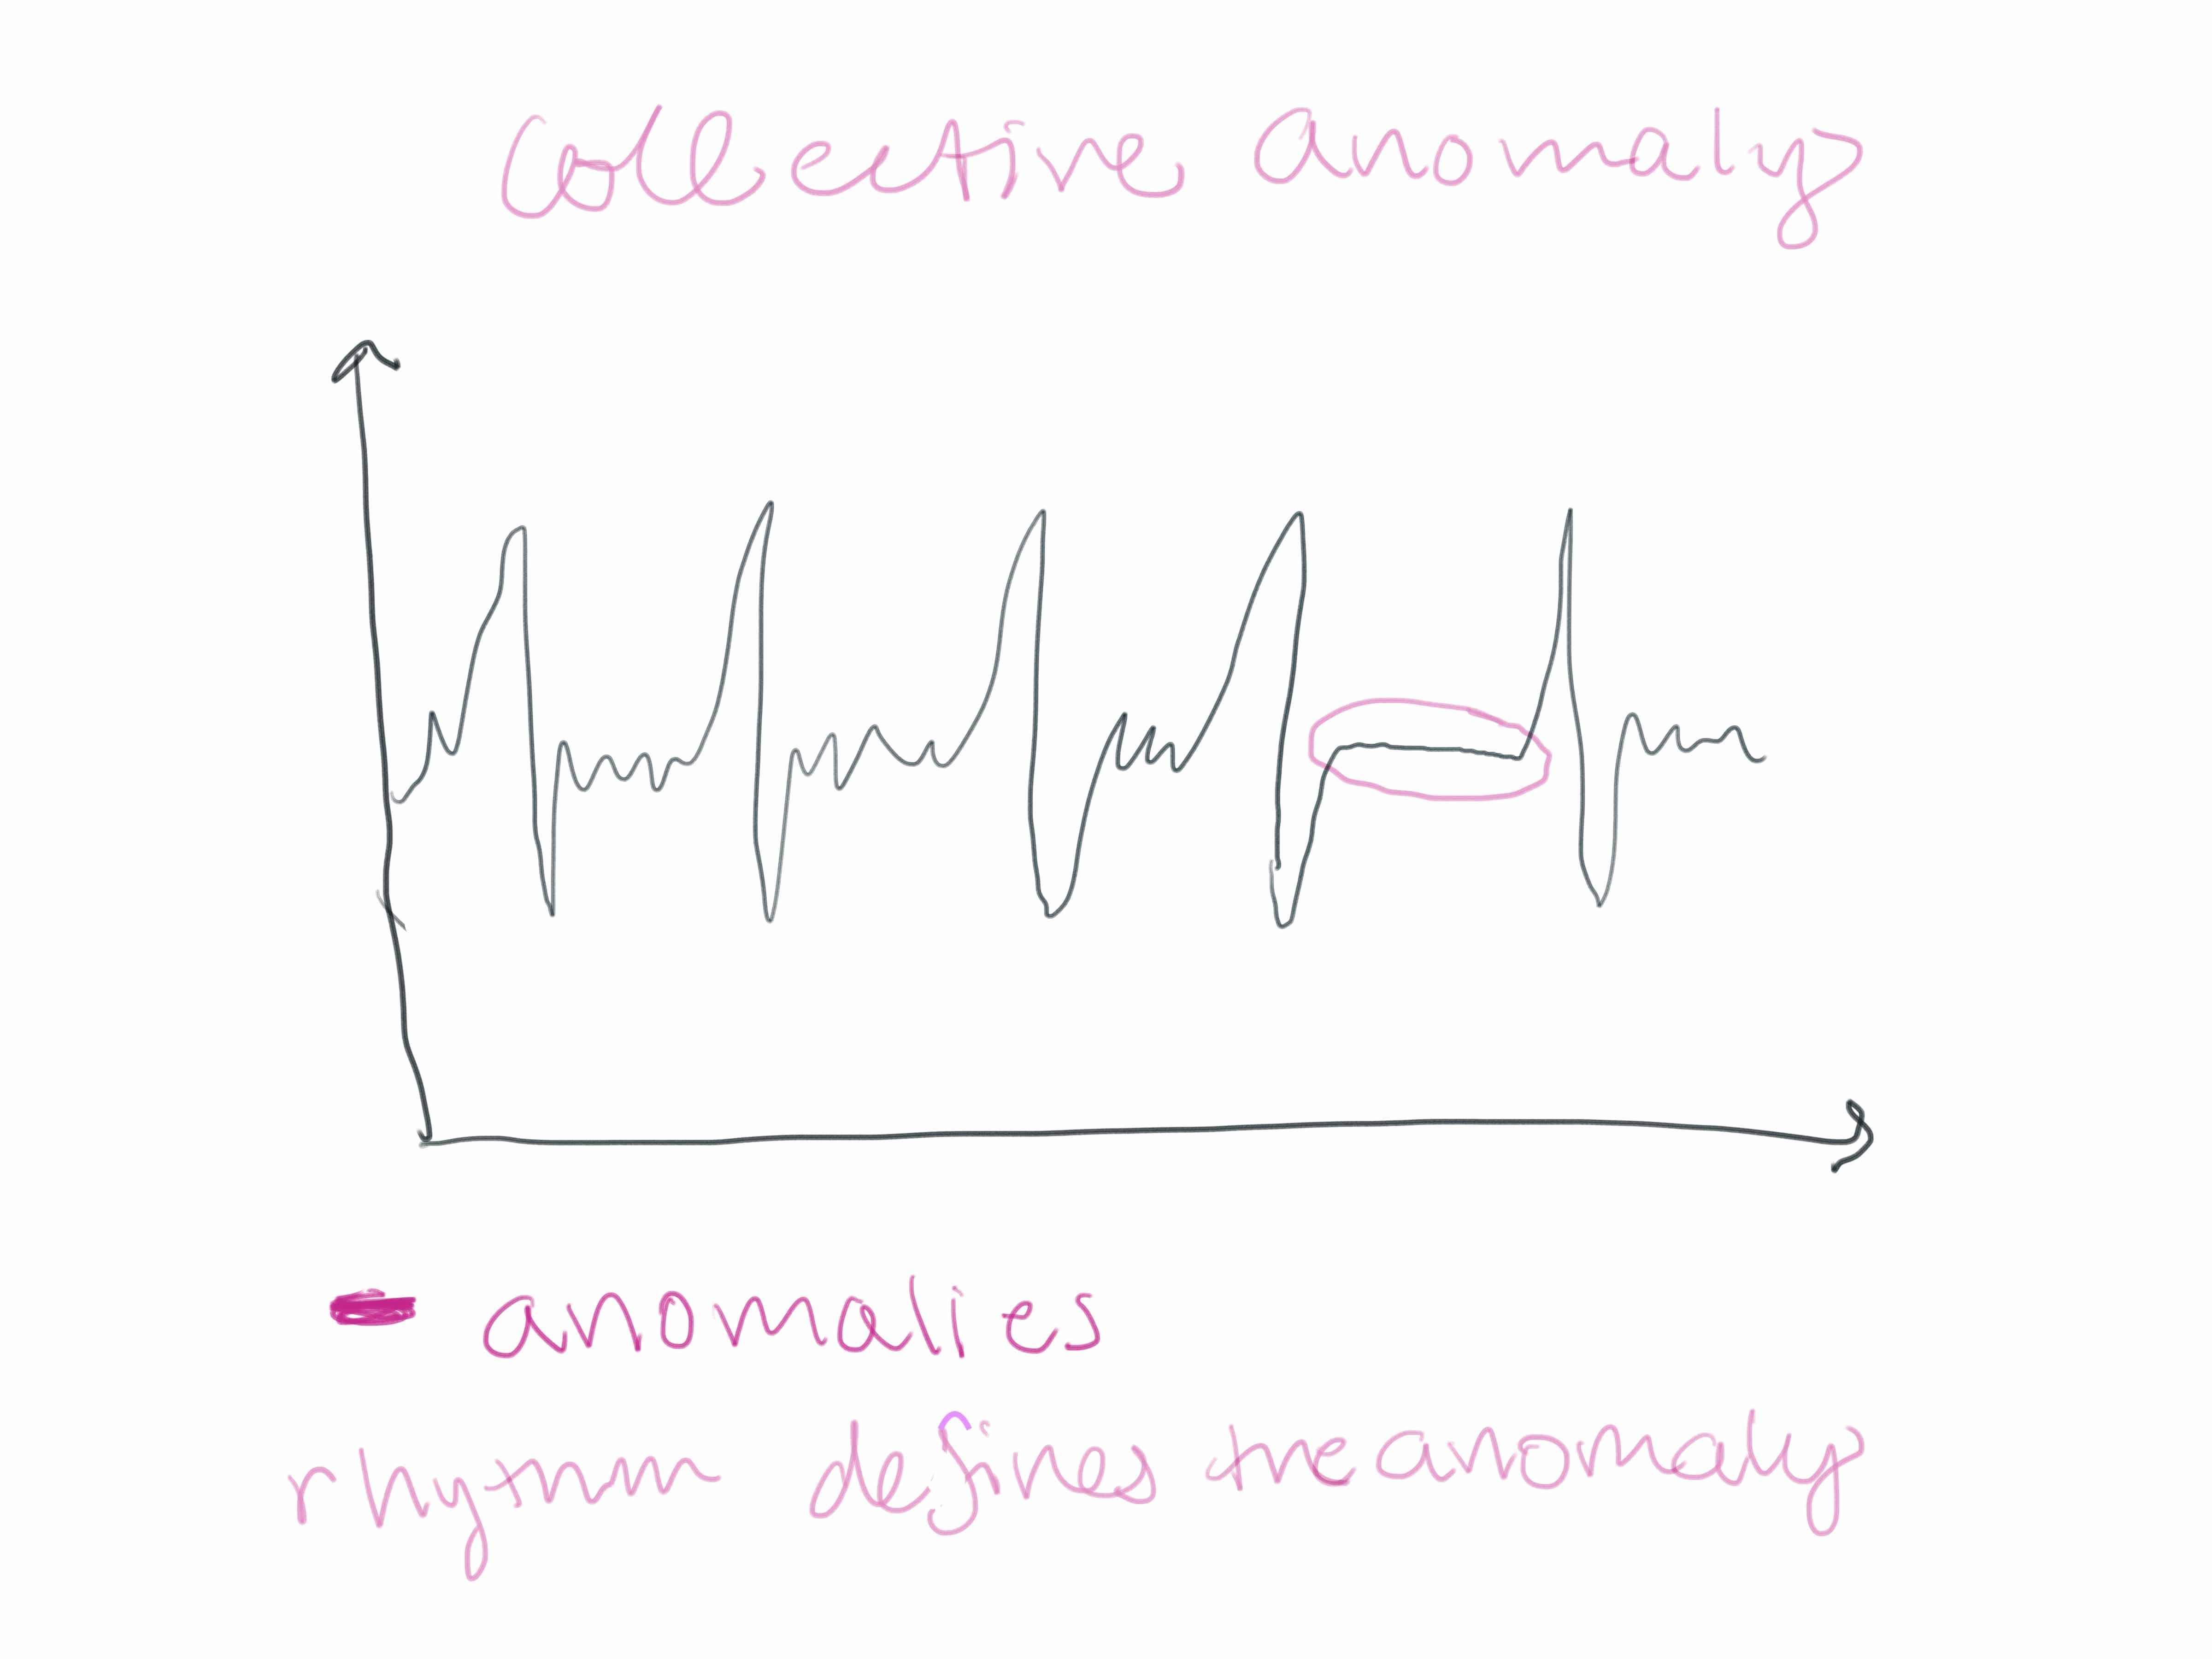
Collective anomalies happen when events happen in an unexpected order. Now assume that I decided to skip breakfast, lunch, and dinner. I might get “hangry” and riotous. However, in this case, the anomaly isn’t me getting upset. That’s normal for me when I don’t eat. Instead, I should monitor my feeding routine, look for breaks/anomalies in it, and expect my system to crash when those anomalies are detected. Collective anomalies happen in datasets where the instances are related to each other either sequentially or spatially.
 <figcaption> I recommend reading Anomaly Detection: A Survey to learn more about the difference between contextual and collective anomalies and methods to detect them.</figcaption>
To solve contextual anomaly detection problems, you should use machine learning. We can take a normal time series dataset and apply K-Means Clustering to it. This will allow us to discover all of the different shapes that are unique to our healthy, normal signal. We then can take new data, predict which class it belongs to, and reconstruct our dataset based on these predictions. Finally, we can measure the error between our predicted signal and our actual signal to determine whether or not an anomaly is present. To see this in action, read the next blog. Otherwise, I hope this intro to statistical functions and K-means has been helpful. Please let me know if you found anything confusing or feel free to ask me for help. You can go to the InfluxData community site or tweet us @InfluxDB.
As promised, here is some art I made. Shout out to @Chris_Churilo for fostering creativity and openness at InfluxData by encouraging me to share my hobbies.