Why You Can't Afford to Ignore Distributed Tracing for Observability
By
Gianluca Arbezzano254
Developer
Jan 30, 2019
Navigate to:
Observability is a hot topic, but not a lot of people know what it truly means. Everyone reads about monitoring vs. observability these days, and I have had the chance to experience what I think is the main concept behind this movement.
First of all, monitoring is complicated. Dashboards don’t scale because they usually reveal the information you need until only after an outage is experienced, and at some point, looking for spikes in your graphs becomes a straining eye exercise. And that’s not monitoring it is just a “not very” smart way to understand how something isn’t working.In other words, monitoring is just the tip of the iceberg where the solid foundation is the knowledge you have of your system.
However, nowadays distributed systems are too complicated to understand. A single request can go and come between many services and applications, some even not owned by your company. Every one of the actors that handle a request can fail, and when that happens, you need a way to answer the basic question: “What just happened?” Observability does that with a set of tools, methodologies, and mindset that allow you and your team to learn about a system.
In particular, I think distributed tracing is an observability tool that you need to have in your toolkit. Here, I share my experiences that led me to this conclusion.
I work at InfluxData as an SRE in particular on our SaaS product InfluxDB Cloud. A few months ago after a crazy growth spurt, we learned that our home-grown orchestrator (as it was at that time) was not sustainable and it did not give us enough confidence to know that things were in functional order. Luckily for us, we know the code really well because we wrote it from scratch as we were not using a standard configuration management tool or orchestrator like Kubernetes we wrote our own little orchestrator to solve our specific use case. It was set up on a daemon in an isolated environment on AWS for every customer with InfluxDB, Chronograf, Kapacitor, and other add-ons that our service offers.
We decided to refactor the application starting from the important and most complicated flows:
- Cluster Creation: the flow that creates subnets, security groups, instances for a new customer;
- Cluster termination: used when a customer stops paying for the service;
- Add-On creation: to spin up add-ons like Grafana, Kapacitor, or Chronograf.
To do that we used a pattern called reactive planning. Basically, you create a plan (cluster creation for example) and split the plan into different steps:
- Create a security group;
- Configure ingress/egress permissions;
- Create instances;
- Wait for instances to run;
- Create load balancer.
There is a scheduler that takes this plan and executes every step one by one and the most important part is that it executes the entire plan a second time. The second time the plan executes it should return no steps because all of them should already be executed, inferring that the plan is solved. This is nice and sweet in this context because it forces you to double check that everything is in working order. For example, the plan checks if the security group is created on AWS, and if it is created, it doesn’t return to that step again. This makes the provisioning rock-solid.
Another good side effect is that all the execution login is in the same place, within the scheduler. It means that there is only a single place to look in order to understand what is going on. The scheduler looks like this:
func (s *Scheduler) Execute(ctx context.Context, p Plan) error {
for {
// Create the plan.
steps := p.Create(ctx)
if len(steps) == 0 {
break
}
err := s.react(ctx, steps)
if err != nil {
return err
}
}
return nil
}
The react function is recursion because steps can return new steps.
func (s *Scheduler) react(ctx context.Context, steps []Procedure) error {
for _, step := range steps {
span, _ := opentracing.StartSpanFromContext(ctx, step.Identifier())
step.WithSpan(span)
logger := s.logger
f := []zapcore.Field{zap.String("step", step.Identifier())}
zipkinSpan, ok := span.Context().(zipkin.SpanContext)
if ok == true && zipkinSpan.TraceID.Empty() == false {
f = append(f, zap.String("trace_id", zipkinSpan.TraceID.ToHex()))
}
logger = s.logger.With(f...)
step.WithLogger(logger)
innerSteps, err := step.Do(ctx)
if err != nil {
.
}
span.Finish()
if len(innerSteps) > 0 {
if err := s.react(ctx, innerSteps); err != nil {
return err
}
}
}
return nil
}At every step, other than the Do() function, the logic to execute has two functions: WithLogger and WithSpan. I added this function only for observability purposes. As you can see, I am instrumenting my plan using opentracing.
With these few lines of code, I am able to configure the logger to always expose the trace_id, and in this way, I can easily query my logs per request. Inside the step, I have the span to easily access and to gain more context based on what happens inside the span. For example, we use etcd. The step that saves information inside etcd contains the key and the value. When I look at the trace, I can understand how the record changed during the execution of the plan.
Furthermore, we have a frontend that logs the trace_id for every interaction with the backend:
Nov 15 19:04:45 PATCH https://what.net/v1/clusters/idg trace_id:d572232a8fed45fa 422I am able to grab this from the log because the backend returns the trace_id as a HEADER. This is another easy way to lookup traces from logs or directly from a particular request if you are able to teach the user to attach it, for example, in a support ticket.
Yet a few days ago, we had a problem. Some of the clusters (a low percentage of them) were failing during creation, but AWS was not reporting any errors (we also trace all the AWS requests by the way). All the resources were created, but the EC2 was not registered in the target group.
The creation of clusters is a complex flow, as there are more than 40 interactions with AWS and it can take more than 10 minutes to complete all the steps. But looking at the trace, it was very easy to understand where the error was. This is a snapshot for the part of the trace that takes the EC2 and registers them to the load balancer for a cluster running:
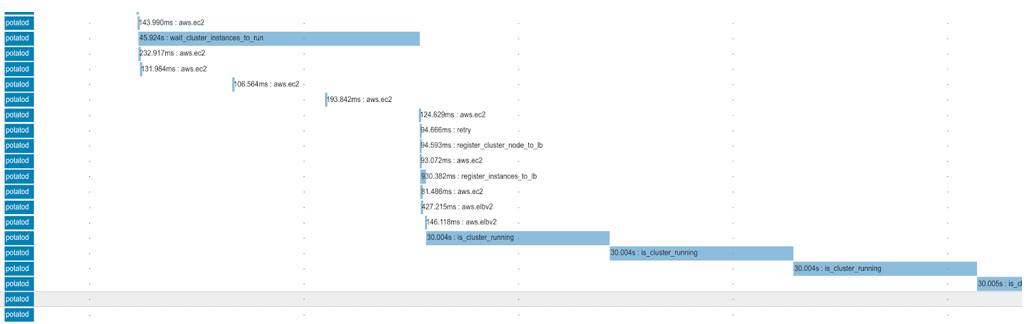
Every step has a name, and the one that I am looking at is the register_cluster_node_to_lb. As you can see, it calls the AWS.EC2 one time to get all the instance IDs to attach and it calls two times the AWS.ELBv2 service: once to get the right target group and once to register the instances.
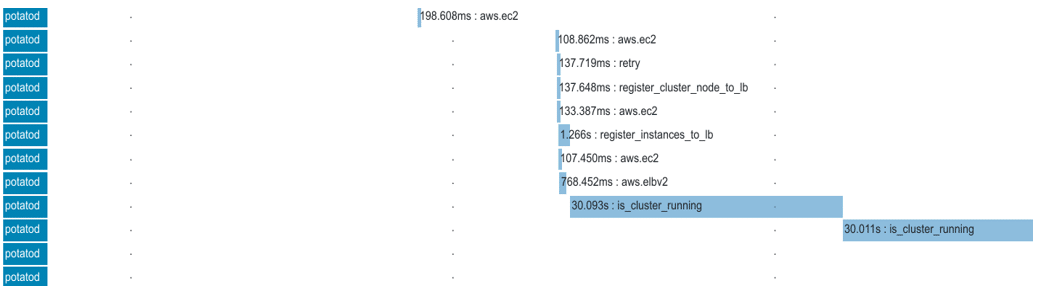
Comparing this trace with one that failed makes it easy to see that in the second screen there is only one request to AWS.ELBv2. So that’s where the issue was! It ended up being an error not well-handled.
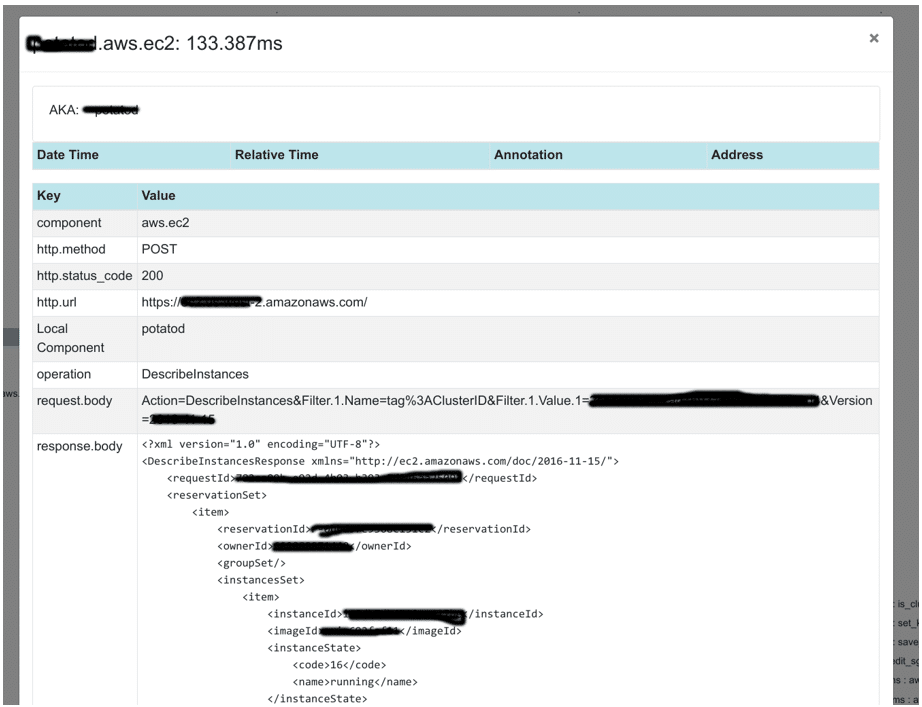
This specific application doesn’t handle a lot of loads but has critical flows where the ability to troubleshoot is important. Visibility on how a plan executes is a feature, and not an option. That’s why we trace all the AWS requests; for example, even request and response:
Observability is important not only in production but in development as it teaches you how your program works. That’s why I also use this setup in development. Observability is the ability to improve how fast and well you develop a feature. This is great because it makes observability very easy to improve and keep up to date. Alternatively, monitoring is only important in production, and you normally don’t care about triggering alerts during your development cycle.
We currently have this system running in production, which gives me the confidence I need to properly help our support team when they ask me to troubleshoot a customer issue. It is particularly helpful since within a couple of seconds I can visually understand where failures happen since the reactive plans highlight the relevant code to refactor, test or optimize.
I think distributed tracing is key in development cycles because the architecture of modern applications is very different from that of older ones not because modern applications are smaller or micro but because there are a lot of integration points with external databases, third-party services and so on. Circuit breakers and retry policies make the debugging a lot more complicated, and some failures are unpredictable or very expensive to handle if they don’t happen often. With this in mind, for some failures, it is better to have a fast way to understand the new issue than try to predict and avoid every possible failure because that’s simply not possible anymore.
