Table of Contents
Back in June we published a blog on our “metrics-first” approach to log analysis; we had found that just over a quarter of our users were already using the InfluxData platform for storing logs and non-numerical events. We consider logs to be just another form of time series data, and so we wanted to give those users better tools for ingesting and viewing that data. At the end of the day, logs are extremely valuable for debugging and troubleshooting; they provide detailed insight into the goings-on of your systems, and let you explore problems in ways that predefined dashboards don’t allow.
We released a plugin for Telegraf that allows you to ingest logs using the syslog protocol, which was based on work we were doing internally, and then back in July, we added log viewing functionality to Chronograf.
If you’re interested in getting rsyslog and the Telegraf plugin up and running on macOS or Linux, you should check out the Get Your Syslog On blog post. Once you start writing data, you’ll be able to explore it through the Log Viewer panel in Chronograf.
Not everyone wants to run a syslog instance, however, and we’ve gotten a few questions here and there about how to write logs directly to InfluxDB so that they can be viewed in Chronograf, but without using syslog or the Telegraf plugin.
Good news! This is totally possible!
First, let’s dig a little deeper into the implementation so we can understand what’s really going on. The first thing to understand is that syslog is a protocol; it describes how messages should be formatted and transmitted. This is described in RFC5424 - The Syslog Protocol. Part of that specification includes details on how to use structured data in your logs, which we strongly encourage!
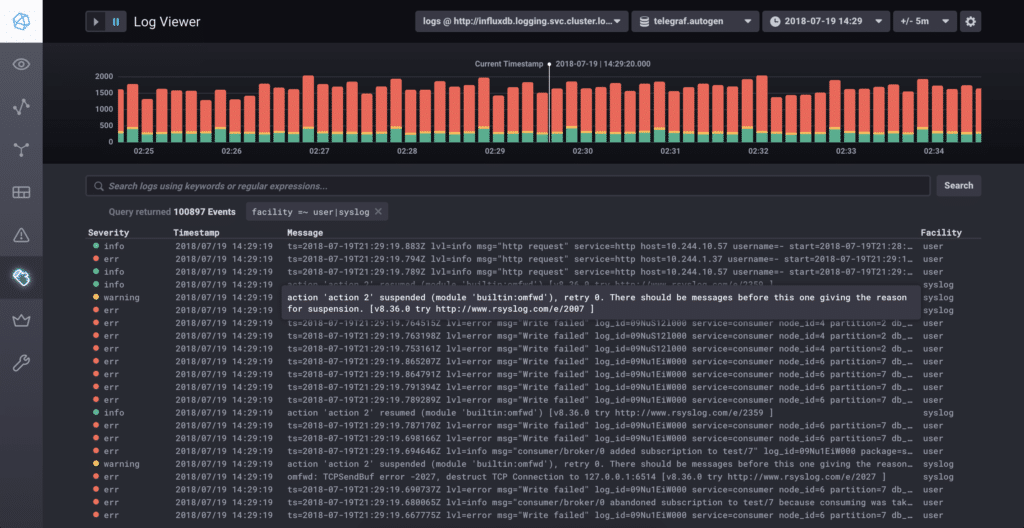
When you’re using syslog and Telegraf, the latter is responsible for accepting messages in syslog format and converting them to line protocol to be written to InfluxDB. It inserts all syslog messages into a measurement called syslog which is what Chronograf looks for when it is populating the log viewer with data. Since the syslog protocol is well-defined, we know that we’ll always have certain fields and tags present in the data, which is how Chronograf knows how to format everything. The viewer has drop-down menus at the upper right for selecting the InfluxDB instance and database to use.
Once data has been written to the database, the schema looks like this:
Tags:
appnamefacilityhosthostnameseverity(needs to match the syslog severity level keyword to display properly in Chronograf)
Fields:
facility_code(integer)message(string)procid(string)severity_code(integer)timestamp(integer)version(integer)
But there’s no reason why you can’t write data like this directly to the database! All you have to do is write points to InfluxDB that adhere to this schema, and land in the syslog database. Once they’re there, they’ll appear in the Log Viewer in Chronograf.
Here are a few examples of logs in line protocol:
syslog,appname=myapp,facility=console,host=myhost,hostname=myhost,severity=warning facility_code=14i,message="warning message here",severity_code=4i,procid="12345",timestamp=1534418426076077000i,version=1isyslog,appname=mysecondapp,facility=console,host=myhost,hostname=myhost,severity=crit facility_code=14i,message="critical message here",severity_code=2i,procid="12346",timestamp=1534418426076078000i,version=1iIf you want, you can open up the Influx CLI and write these points directly using the insert command; just be sure you update the timestamps to something recent so that you don’t have to go searching through history to find the data.
Some of the fields in the schema above are specific to the syslog format, and help you identify the severity of the logs (are they informational, or critical errors), as well as the applications that wrote them. This is extremely helpful data for troubleshooting, so don’t leave it out! You can get more information on things like severity codes and facilities on the syslog Wikipedia page.
Using this approach, you can create logs entries from any application which can make an HTTP connection to InfluxDB. We’ve even got a few users already using this technique in the wild, so if it fits your use case, give it a try! One thing to remember is that InfluxDB works best when you batch up large numbers of points before sending them to the database (5,000-10,000), so if you’re sending lots of individual log lines you might overwhelm the database with HTTP requests.
If you end up writing logs directly to InfluxDB, or if you have other success stories about integrating metrics and logs, we’d love to hear about it! Tweet us @InfluxDB on Twitter!
