Zeppelin, Spark, and InfluxDB for Big Data Time Series Scenarios
By
Anais Dotis-Georgiou
updated December 14, 2025
Product
Use Cases
Developer
Navigate to:
So you’re using InfluxDB and Telegraf. Perhaps you’re writing over a million metrics points per second. Perhaps you’ve used Flux to do some data exploration. However, you now find yourself in a little bit of a pickle. You need to process and analyze this large amount of data, and you’d prefer to do that work in your favorite language with your go-to libraries. InfluxData has been working on a solution to allow you to tackle that data analytics problem with ease — an InfluxDB interpreter for Apache Zeppelin which supports Apache Spark.
What is Apache Zeppelin?
If you’re familiar with Jupyter Notebooks, then you’re halfway there. Apache Zeppelin is also a web-based notebook that enables collaborative data science and data analytics. However, Zeppelin goes further as it:
- Enables quick and easy language switching. You can write some SQL, Scala, Python, and then Markdown to seamlessly perform your data analysis.
- Provides built-in visualizations and dynamic forms to easily present your results and create input forms.
- Allows you to run cron jobs easily.
- Supports Spark, PySpark, Spark R, Spark SQL with dependency loader.
- Allows you to connect any JDBC data sources including PostgreSQL, MySQL, MariaDB, Redshift, Apache Hive, etc.
- Supports Python with Matplotlib, Conda, Pandas SQL and PySpark integrations.
What is Apache Spark?
Apache Spark is a “unified analytics engine for big data”. More specifically, as described by Wikipedia, it is an “open-source distributed general-purpose cluster-computing framework. Spark provides an interface for programming entire clusters with implicit data parallelism and fault tolerance.”
Exploring InfluxDB with Zeppelin and Spark
Now that we’ve explained the box of parts, let’s walk through a quick tutorial to show the power of using these technologies together.
In this tutorial, we’ll cover how to:
- Query your InfluxDB instance with the Java Client
- Convert it to a dataframe
- Parallelize the dataframe to distributed dataset that can be operated on in parallel
- Save the parallelized dataframe as a temporary view so we can query and visualize the data in SparkSQL
Finally, if you have concerns about using a client to query your data before performing any sort of analysis, I encourage you to read the section following the tutorial. In it, I will cover some common concerns and questions regarding big data time series pipelines.
Step One: Imports
We start by importing our dependencies.
import sqlContext.implicits._
import java.sql.Timestamp
import com.influxdb.annotations.{Column, Measurement}
import com.influxdb.client.InfluxDBClientFactory
import com.influxdb.query.FluxRecord

println("Spark version:" + sc.version)
println("Scala version:" + util.Properties.versionString)
Step Two: Generate the Flux query
We define a case class, craft a Flux query and store it as a constant.
case class Cpu(num: String, usage: Double, time: Timestamp)

val fluxQuery = ("from(bucket: \"my-bucket\")\n"
        + " |> range(start: -1h)"
        + " |> filter(fn: (r) => (r[\"_measurement\"] == \"cpu\" and r[\"_field\"] == \"usage_system\"))")
Steps Three and Four: Use the Java client to query your InfluxDB instance and parallelize the result to Spark
We use the Java InfluxDB v2.0 Client to to query our InfluxDB instance. First, we must supply the appropriate authentication parameters. Next, we map the output of the query to our case class. Finally, we parallelize the results. Calling the parallelize method copies the existing collection to form a distributed dataset that can be operated on in parallel. In other words, that method handles the transformation from a Scala Seq to a Spark distributed dataset. Then use toDF to convert the results to a dataframe.
val cpu_frame1 = sc.parallelize(
    InfluxDBClientFactory.create("http://localhost:9999", "my-token".toCharArray)
            .getQueryApi.query(fluxQuery, "my-org").get(1)
            .getRecords.toArray(Array.ofDim[FluxRecord](0))
            .map(r => Cpu(r.getValueByKey("cpu").toString, r.getValue.toString.toDouble, Timestamp.from(r.getTime)))).toDF()
Step Five: Register the DataFrame as a temporary view
Now we can create a temporary view of the dataframe. Temporary views are in SparkSQL. Registering the Spark dataframe as temporary view allows us to query the dataframe with SparkSQL.
cpu_frame1.createOrReplaceTempView("cpu1")Step Six: Query and visualize
Use a SQL statement to query our data and take advantage of the built-in visualization.
%sql

select * from cpu1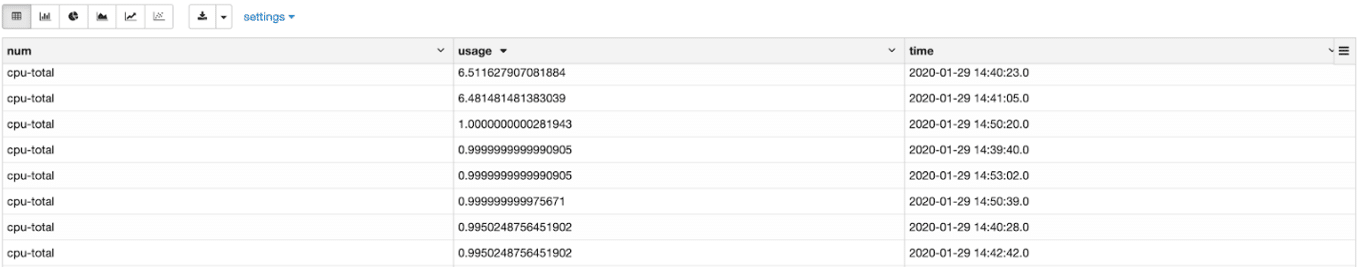

Big data pipeline questions and concerns
Often, when I suggest using a client to perform data analytics or data science, I'm met with the same reactions: sighs, seat-squirming, eyes glazed over. I can read the questions on people's faces:- Why should I even bother storing my data in InfluxDB if I'm going to pull the data out anyway?
- Why don't you have a tool for me to do this work server-side?
- Do I really have to do that extra work?
- InfluxDB is a time series data lake. It's where you can store all of your raw time series data. There are many platforms that simply cannot handle the data ingest rate that InfluxDB provides. However, there are use cases where moving a dataset to a data warehouse makes a ton of sense. Moving specific data into a data warehouse offers you a more organized data analytics pipeline. Keeping unique datasets in different warehouses allows you to pair specific analytics with those individual datasets in isolation.
- Short Answer: Are you sure you really want that? Long Answer: Flux enables data exploration, preparation, and preliminary analysis server-side. However, it turns out most data scientists would prefer to do the heavy data analysis in their prefered language with familiar libraries. Also, InfluxDB v1.x did allow you to do this work server-side. InfluxDB v1.x has Kapacitor, a data processing engine, that allows you to create UDFs. However, it turns out that learning and using Kapacitor's unique scripting language is cumbersome for most data scientists. I recommend using Flux to evaluate what data needs to be moved to a data warehouse where you can take advantage of sophisticated data science libraries and distributed computing.
- My hope is that after reviewing this tutorial, you are convinced that querying data with the client and integrating Spark isn't extra effort. It actually saved me time.
Considerations and next steps for your big data time series
The InfluxDB interpreter PR is still in review phase within the Apache Zeppelin community. However, in the meantime, you can still build Zeppelin with the InfluxDB interpreter from source if you want to try this out prior to the PR being merged. I hope you enjoyed this tutorial and are as excited as I am about this work. As always, please share your thoughts, concerns, or questions in the comments section, on our community site, or in our Slack channel. We’d love to get your feedback and help you with any problems you run into!
