Dashboards
In this technical paper, InfluxData CTO, Paul Dix, will walk you through what time series is (and isn’t), what makes it different from stream processing, full-text search and other solutions.
By reading this tech paper, you will:
- Learn how time series data is all around us,
- See why a purpose built TSDB is important.
- Read about how a Time Series database is optimized for time-stamped data.
- Understand the differences between metrics, events, & traces and some of the key characteristics of time series data..
- Understand the differences between metrics, events, & traces.
What is a dashboard?
Dashboards are a great way to visualize your data. Presenting the data to its target audience in a format that is meaningful and easy to understand is fundamental.
Why use a dashboard?
InfluxDB time series data can be queried and graphed in dashboards, whose visualization types include line graphs, gauges, tables and more. There are many types of dashboards to choose from including those that come with InfluxDB, other open source projects like Grafana, or even IoT specific dashboarding tools like Seeq. These solutions often come with pre-canned dashboards built by the community to allow you to get started very quickly. You can easily clone one of these pre-canned dashboards to create customized dashboards or build them from scratch — either way, you can build the perfect dashboard to fulfill your visualization needs!
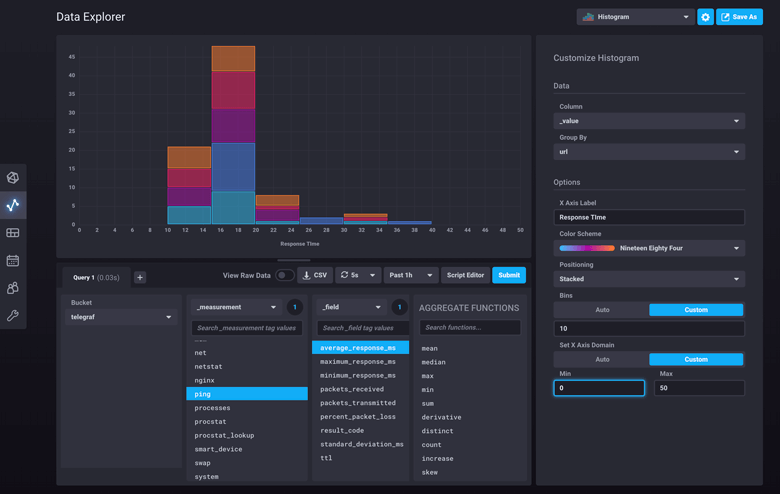
Explore your data with an InfluxDB dashboard
InfluxDB allows you to quickly see the data that you have stored via the Data Explorer UI. Using templates or Flux (InfluxData’s functional data scripting language designed for querying and analyzing), InfluxDB empowers you to rapidly build dashboards with real-time visualizations and alerting capabilities across measurements. See Get started with Flux to learn more about Flux.

Want to know more?
Download the Paper
Dashboard templates
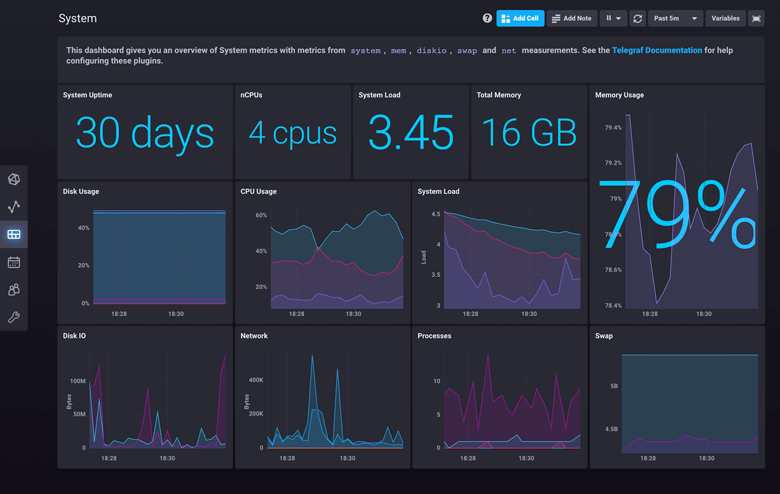
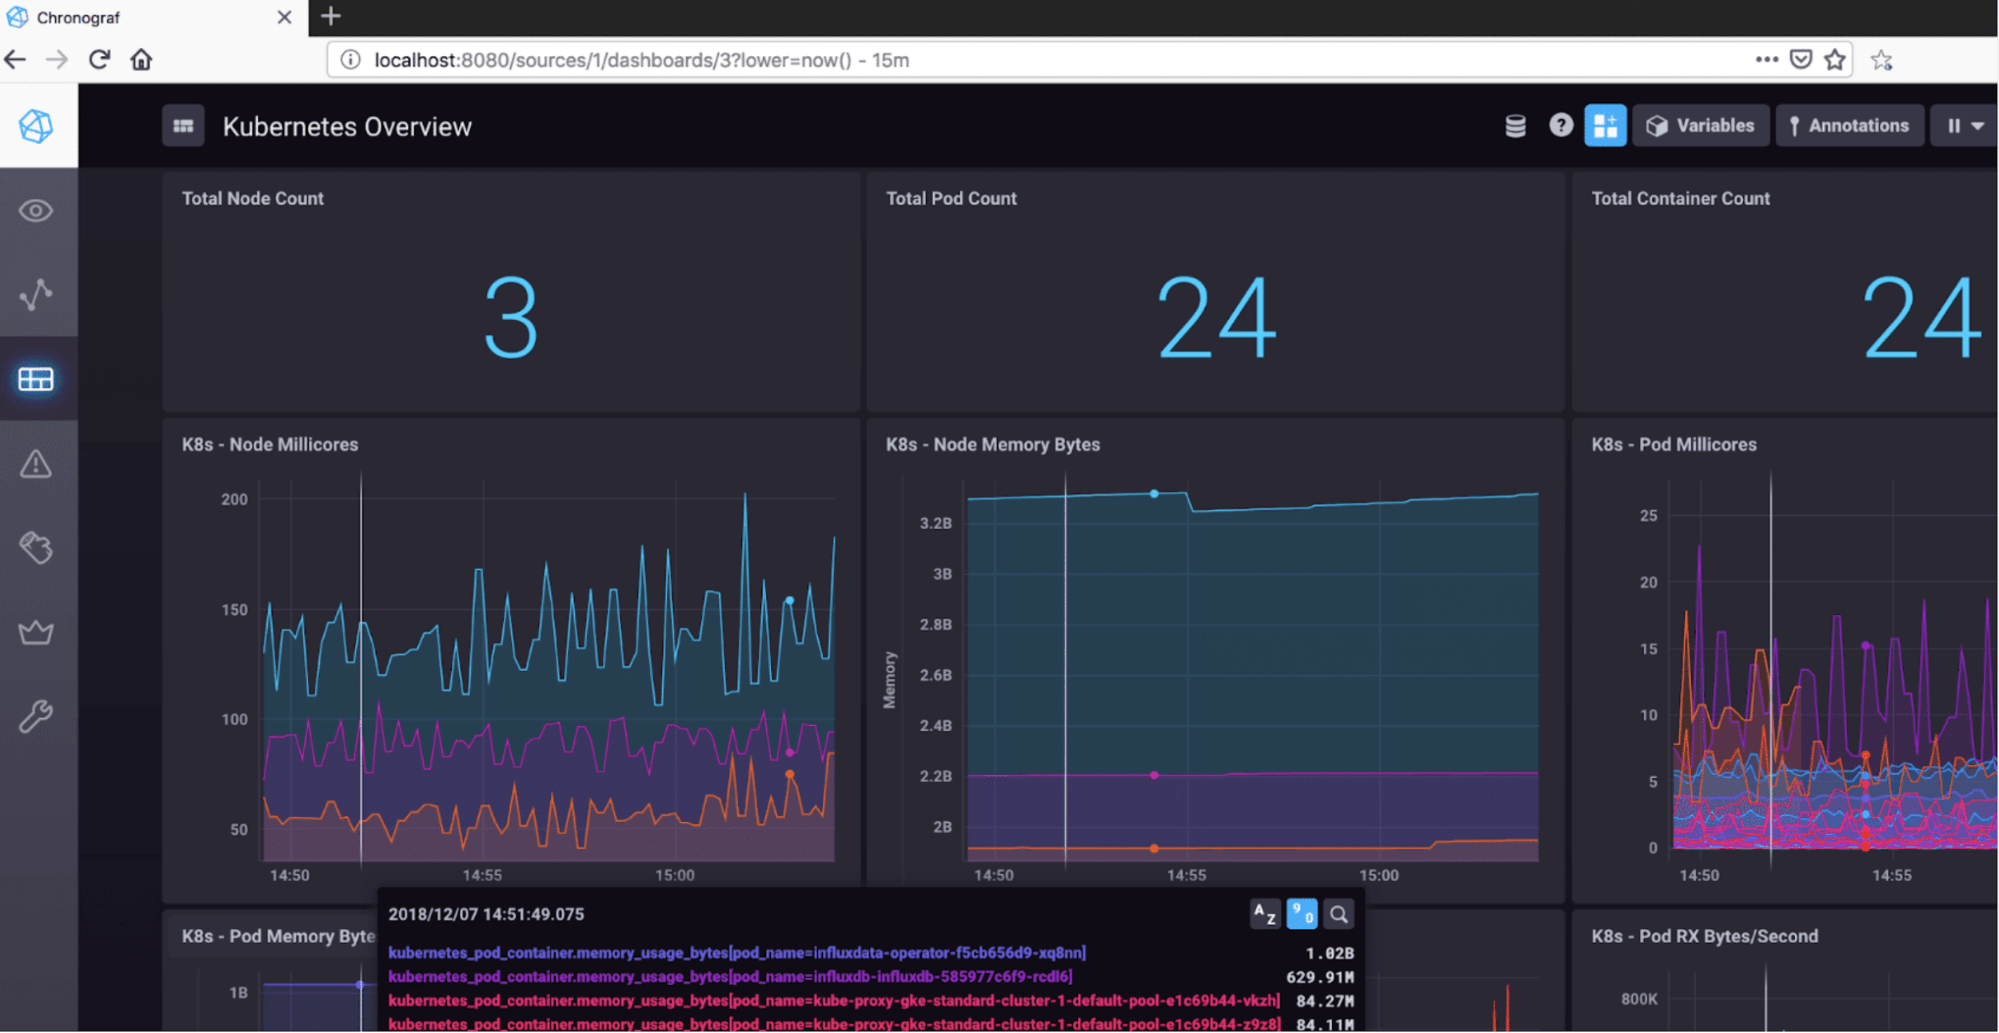
InfluxDB comes out-of-the-box with pre-canned dashboards for the supported Telegraf input plugins. Currently, it offers dashboard templates for the following Telegraf input plugins:
To see how easy it is to start visualizing your data, with Telegraf as a DeamonSet deployment in your Kubernetes environment, you can start monitoring Kubernetes containers in InfluxDB without any additional effort.
Grafana dashboards
Grafana is a great open source time series visualization and analytical suite. Among other things, Grafana readily integrates with InfluxDB and Telegraf to make monitoring of sensor, system and network metrics much easier and far more insightful. The process of setting up a Grafana dashboard and integrating it with various data sources is straightforward.
By clicking on “Add Data Source” in Grafana UI, you configure it for InfluxDB. Once finished, you can select “New Dashboard” button, to start visualizing InfluxDB data of your interest.


