Announcing the new Chronograf, a UI for the TICK stack -- A complete open source monitoring solution
By
Paul Dix
updated December 14, 2025
Product
Company
Navigate to:
Today we’re releasing the first open source version of Chronograf, the user interface of the TICK stack. With this release we can now provide the entire stack as a complete open source monitoring solution. It’s part of our vision to enable users to own their monitoring on pure open source software that is as easy to setup and use as commercial SaaS offerings. It’s a continuation of our two primary drives as we build software: optimize for developer happiness by giving our users the fastest time to value with tools and solutions that are a joy to use.
This release should be viewed as an alpha, but we’ll be iterating quickly based on user feedback and releasing nightly builds. It’s intentionally a bare-bones release to get it in the hands of community users as quickly as possible. In the early phases of this project you can expect releases every 2 weeks with bug fixes and new features based on what early adopters are requesting. This release of Chronograf is a reset from the previous releases and is a breaking upgrade. We know this is breaking with semantic versioning, but felt it was best for the platform as a whole. This version has features not present in Chronograf 1.0, but also doesn’t have the dashboarding features of the prior releases. Future versions of this new Chronograf will have a superset of functionality from the 1.0 release. We won’t be maintaining the 1.0 release of Chronograf and all new features and requests should go against the now open source release.
Read on for more on our vision, why we’re building an open source monitoring solution, a quick overview of features and how Chronograf relates to Grafana.
Own your monitoring
Our goal with Chronograf and the entire TICK stack is to give developers and users the power and flexibility to deploy a cost-effective open source monitoring solution while giving them the ability to customize their visualizations and monitoring algorithms in any way they see fit. Because TICK is open source, developers can modify and add to their solution in ways that just aren’t possible with SaaS products.
Our philosophy is that developers, devops engineers, and administrators should own and control their monitoring. Today, every operator seems to be 80% happy with their solution. Our goal is to get you that 80% functionality quickly on a completely open source platform and get out of the way while you customize and build to solve the last 20%.
The key to our open source vision is community contribution. When we launched Telegraf, our open source data and metrics collector, in June of 2015, we created a simple plugin system that would easily allow open source developers to contribute plugins. We kicked it off by developing the first five plugins and now we’re at 90. This is the power of open source monitoring: community contributions that help everyone.
With Chronograf, we plan to bring this same contribution system to visualizations. More importantly, Chronograf will tie in with Kapacitor, bringing community contribution to monitoring, anomaly detection, and alerting. As the platform matures, everyone will be able to benefit from already built monitoring and alerting rules for well known systems.
Chronograf Features
Chronograf starts with a pre-built view of hosts that are running Telegraf. You can sort those hosts by their CPU utilization, filter by parts of the hostnames, and jump to a system level dashboard.
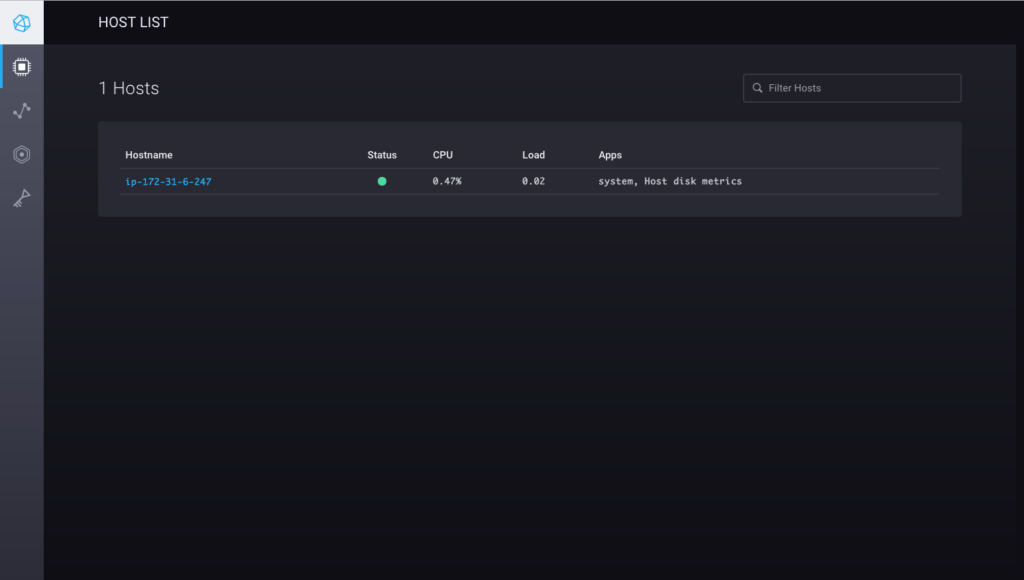
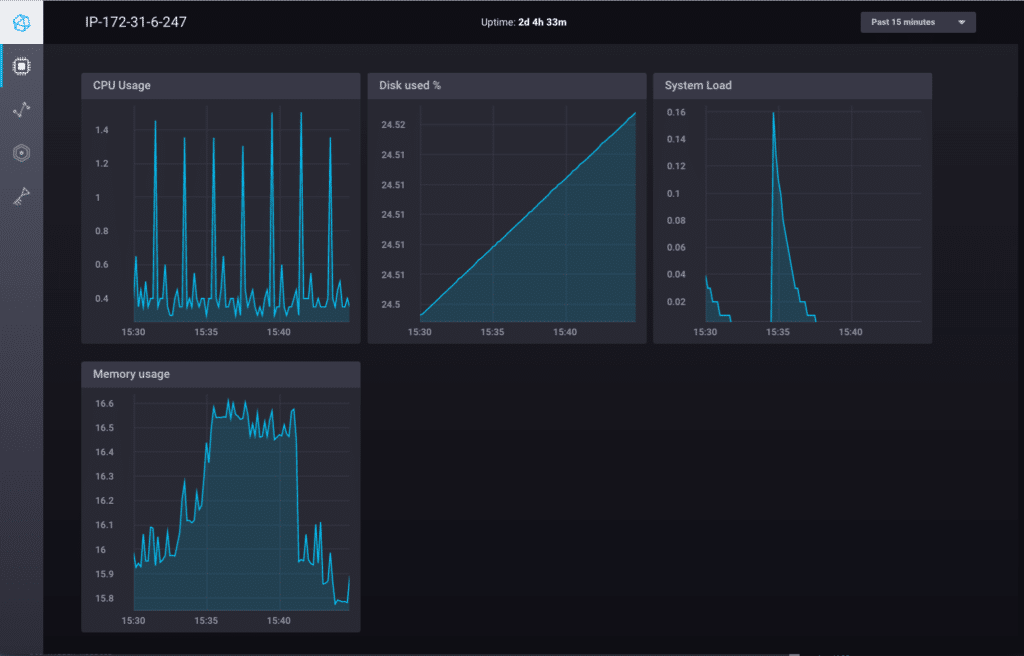
You can see in the hosts view that there are applications running on each host. Each of these applications has a dashboard view. The interesting part about the applications is that the list is generated automatically by the data that exists in InfluxDB (created by either Telegraf or your own data) and the list of layouts that Chronograf supports.
Users can add their own layouts locally or can contribute back to the community by submitting a pull request.
Finally, Chronograf includes a section for setting up alerting rules and viewing alerts. The built in UI gives users the ability to monitor for absolute thresholds, relative thresholds like outliers outside the moving average, and the absence of data (i.e. a dead man’s switch) and flap detection.
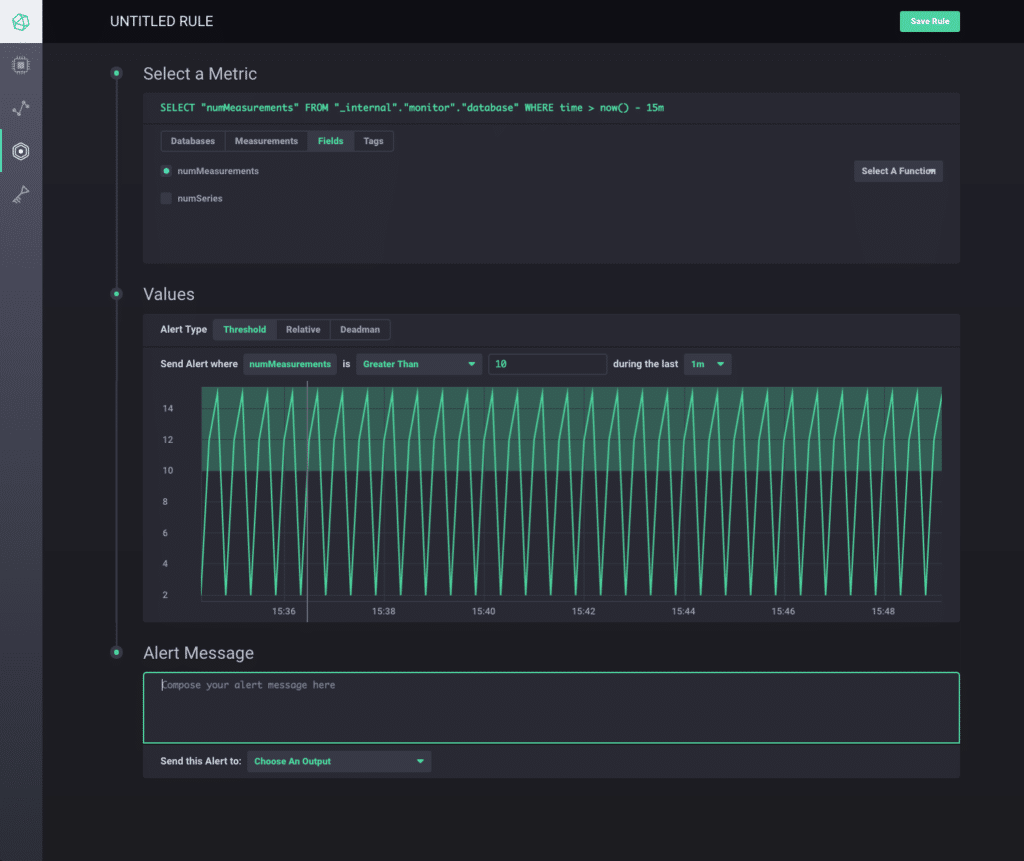
The monitoring and alerting system behind Chronograf is Kapacitor. This means that all the alert output endpoints like PagerDuty, Slack, email, VictorOps and many more are supported out of the box. With Kapacitor running as part of the stack, more advanced users will be able to set up complex monitoring like anomaly detection, pattern matching, and correlation analysis. For example check out the Kapacitor tutorial on User Defined Functions and anomaly detection.
How this relates to Grafana
The first two questions that many of our users and fans will probably have is: What does this mean for Grafana and why would we pursue Chronograf when a great dashboarding solution already exists? In short, it doesn’t mean anything for Grafana or our support for it. We’re big fans of the project and are working with their team to ensure that InfluxDB continues to be a first class citizen for Grafana users.
We continue to offer Grafana as part of our InfluxDB Cloud on AWS product and that’s going to continue for the foreseeable future. We also plan to build integrations in Chronograf to export to Grafana dashboards and interact with any Grafana APIs where it makes sense.
We’re moving forward with Chronograf because we’re serious about improving the ease of use of the entire platform. To drive that we need a user interface that is built specifically for the TICK stack. Most of the value we’ll be getting out of these early releases of Chonograf is to make Kapacitor easier to use. Users can create monitoring and alerting rules without having to write TICKscripts. We’ll be driving more features in Chronograf that take advantage of the whole system we have put together to collect, store, and process the data.
As developers of Chronograf we also push forward the ease of use of the APIs of Telegraf, InfluxDB, and Kapacitor. The best way to design a great API is to be a regular user of it. Developing Chronograf helps us push all four components forward in a way that takes the entirety of the system into consideration.
This is just the beginning
Our release today reaffirms our commitment to open source software and our belief that the community is the best source of inspiration for quality product design. In the future we envision, you’ll deploy the TICK stack and have visualizations, insight, and monitoring in place within minutes. All without configuration, code or any complicated setup. In the near term we’d love to iterate with potential Chronograf users to improve functionality and implement important features. We’ll be moving quickly so we hope you’ll contribute through feedback or code.
What's next
- Chronograf overview
- Chronograf Getting Started
- Downloads for the TICK-stack are live on our "downloads" page
- Deploy on the Cloud: Get started with a FREE trial of InfluxDB Cloud featuring fully-managed clusters, Kapacitor and Grafana.
- Deploy on Your Servers: Want to run InfluxDB clusters on your servers? Try a FREE 14-day trial of InfluxDB Enterprise featuring an intuitive UI for deploying, monitoring and rebalancing clusters, plus managing backups and restores.
- Tell Your Story: Over 100 companies have shared their story on how InfluxDB is helping them succeed. Submit your testimonial and get a limited edition hoodie as a thank you.
