Table of Contents
Amazon CloudWatch – Amazon’s built-in infrastructure monitoring tool – monitors your Amazon Web Services (AWS) resources and the applications you run on AWS in real time. Here’s what you can do with this tool and how to access AWS CloudWatch monitoring dashboards.
CloudWatch for monitoring AWS resources and applications
As a monitoring and management solution, CloudWatch provides system-wide visibility into resource utilization, application performance and operational health. It is great for detecting anomalous behavior in your environments, visualizing logs, optimizing resource utilization and taking automated actions. Use it to:
- Collect and track metrics to monitor your resources and applications
- Set alarms that send notifications based on predefined thresholds
- Stop under-used instances based on monitored resource data
AWS services often used along with Amazon CloudWatch include Amazon Simple Notification Service (Amazon SNS), Amazon EC2 Auto Scaling, AWS CloudTrail, and AWS Identity and Access Management (IAM).
AWS CloudWatch Monitoring Template premade dashboards
The AWS CloudWatch Monitoring Template has two premade monitoring dashboards to discover insights and keep applications running smoothly.
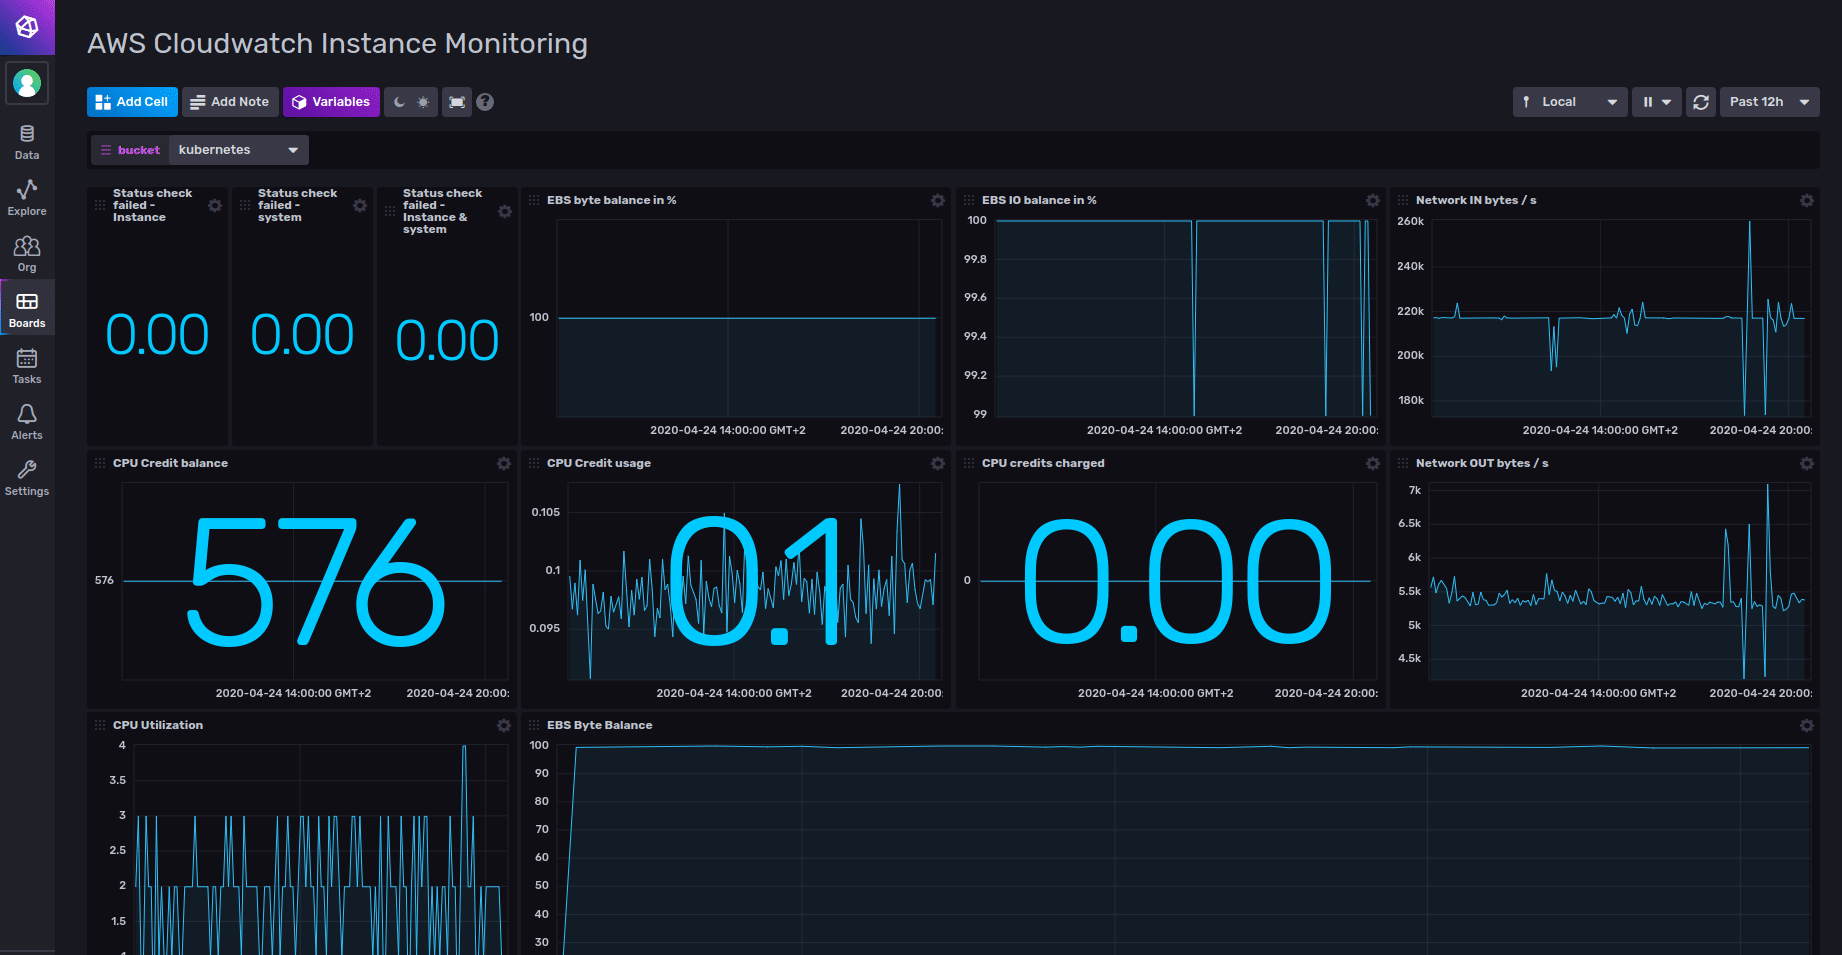
The Instance Monitoring dashboard displays data from AWS EC2, the cloudwatch_aws_ec2 measurement, as shown below. Use this dashboard to get a quick snapshot of the state of your AWS instances and to view resource consumption per instance.
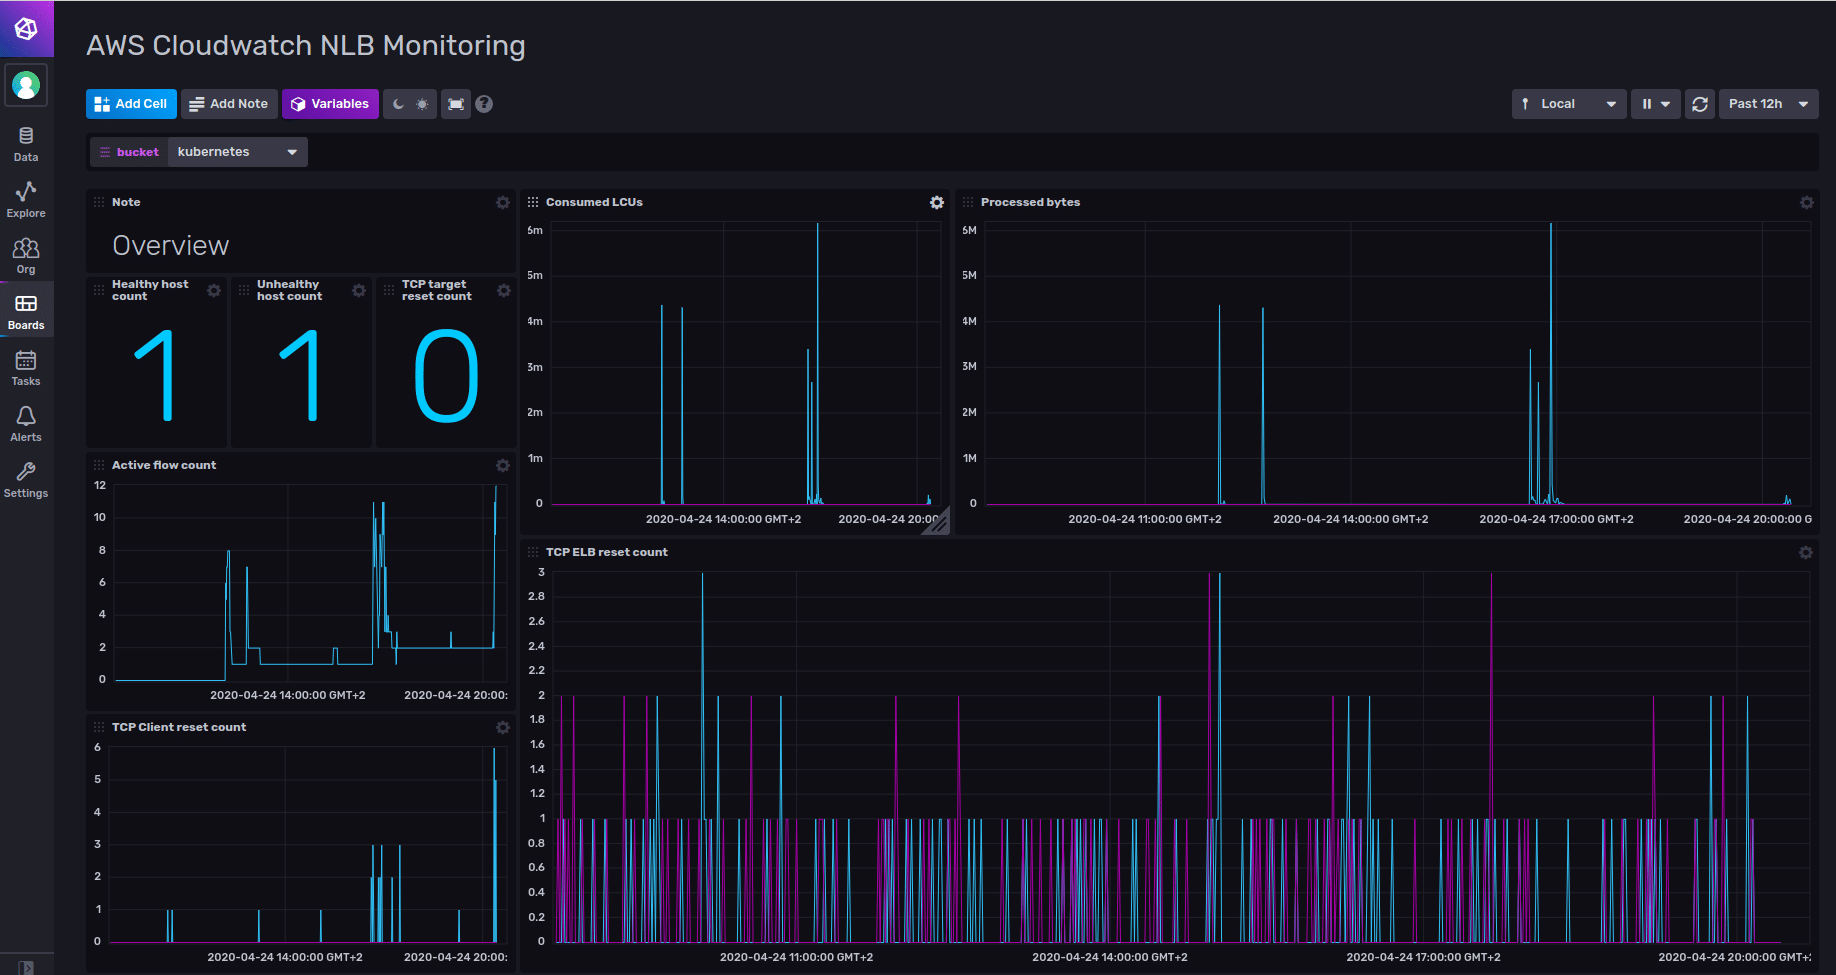
The Network Load Balancers monitoring dashboard, shown below, displays data from EL, the cloudwatch_aws_network_elb measurement. Use this dashboard to monitor your load balancers, analyze traffic patterns and troubleshoot issues with your load balancers and targets.
With the AWS CloudWatch Monitoring Template, DevOps engineers, developers, site reliability engineers (SREs) and IT managers can easily share their monitoring expertise.
As with other InfluxDB Templates, this template packages up everything needed to monitor – Telegraf configurations and InfluxDB Dashboards, Tasks, Alerts, and related artifacts – into a single YAML text file, freeing individuals and teams to quickly get their monitoring solutions up and running.
Sign up for your free InfluxDB Cloud account to install this template.
