Table of Contents
AWS Lambda is a serverless compute service that allows you to run code without having to manage servers. Lambda provides autoscaling and bills only on compute time, so you aren’t paying for unused resources. Some common use cases are file processing, stream processing, and acting as a backend for web and mobile applications. AWS Lambda functions can be invoked with external HTTP requests as well as by events triggered by over 200 different AWS services.
To make monitoring your AWS Lambda functions easier with InfluxDB, we have created a pre-built template that makes getting your Lambda function metrics into InfluxDB simple.
What are InfluxDB Templates?
Before jumping into setting up the AWS Lambda template, let’s cover what an InfluxDB template actually is. InfluxDB Templates are a set of tools that allow the InfluxDB users to share pre-made monitoring solutions.
Templates allow you to define your entire monitoring configuration from a single YAML file. This includes things like data sources, dashboards, and alerts. All of these can be configured and then imported into InfluxDB with a single command. Templates are great for getting started quickly and learning how to use InfluxDB. Once you are set up, you can very easily customize or extend the template for your own custom use case.
InfluxDB Templates are:
- Comprehensive: Define and package the entire monitoring solution by configuring the data sources, dashboards and alerts. This level of sophistication makes getting started right away possible with no time-consuming back-and-forth.
- Developer-oriented: InfluxDB Templates work with modern developer tooling used in today's developer teams. Written in YAML, distributed via GitHub, and open-source licensed under Apache 2.0, the templates are easy for developers to create and share.
- Faster to deliver value: Build and share templates that cover a variety of monitoring solutions to get better insights faster and easier. Templates can be combined or changed to ensure they work for your project - leaving you more time to focus on it.
How to set up the AWS Lambda Template
To get started using templates, you will first need a running instance of InfluxDB. The fastest way to get started is using InfluxDB Cloud, but you can also spin up an open source instance on your machine if you prefer.
Once inside the InfluxDB UI, you need to navigate to the Settings tab and select Templates. You then need to paste in the following URL from the AWS Lambda Template repository:
https://raw.githubusercontent.com/influxdata/community-templates/master/aws_lambda/lambda.yml
If you have the InfluxDB CLI configured on your computer, you also have the option of installing templates from the command line by using the following command:
influx apply -u https://raw.githubusercontent.com/influxdata/community-templates/master/aws_lambda/lambda.yml
Running this template will create a dashboard called AWS Lambda in your account and also create a single bucket for storing that data.
Now that the template is installed, you need to create a Lambda function and invoke it to get some data into InfluxDB. If you don’t have a function already made, you can use the sample function provided with the template and paste that code into your NodeJS Lambda function.
The template is expecting the data to come from Telegraf, so you will need a running Telegraf instance as well. If you need help setting up Telegraf, you can follow the getting started guide in the documentation. The template specifically uses the Telegraf AWS Cloudwatch Plugin and the Lambda namespace.
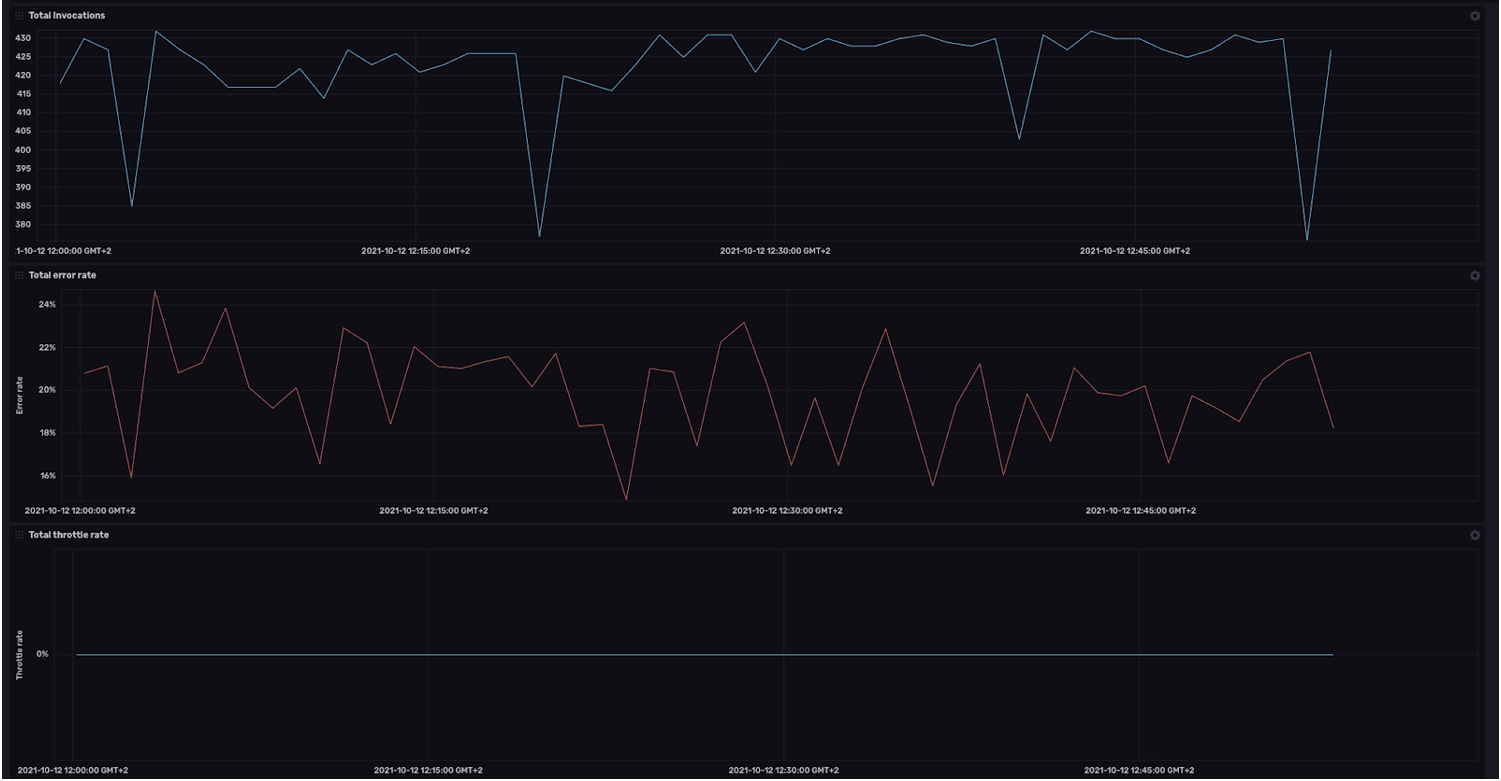
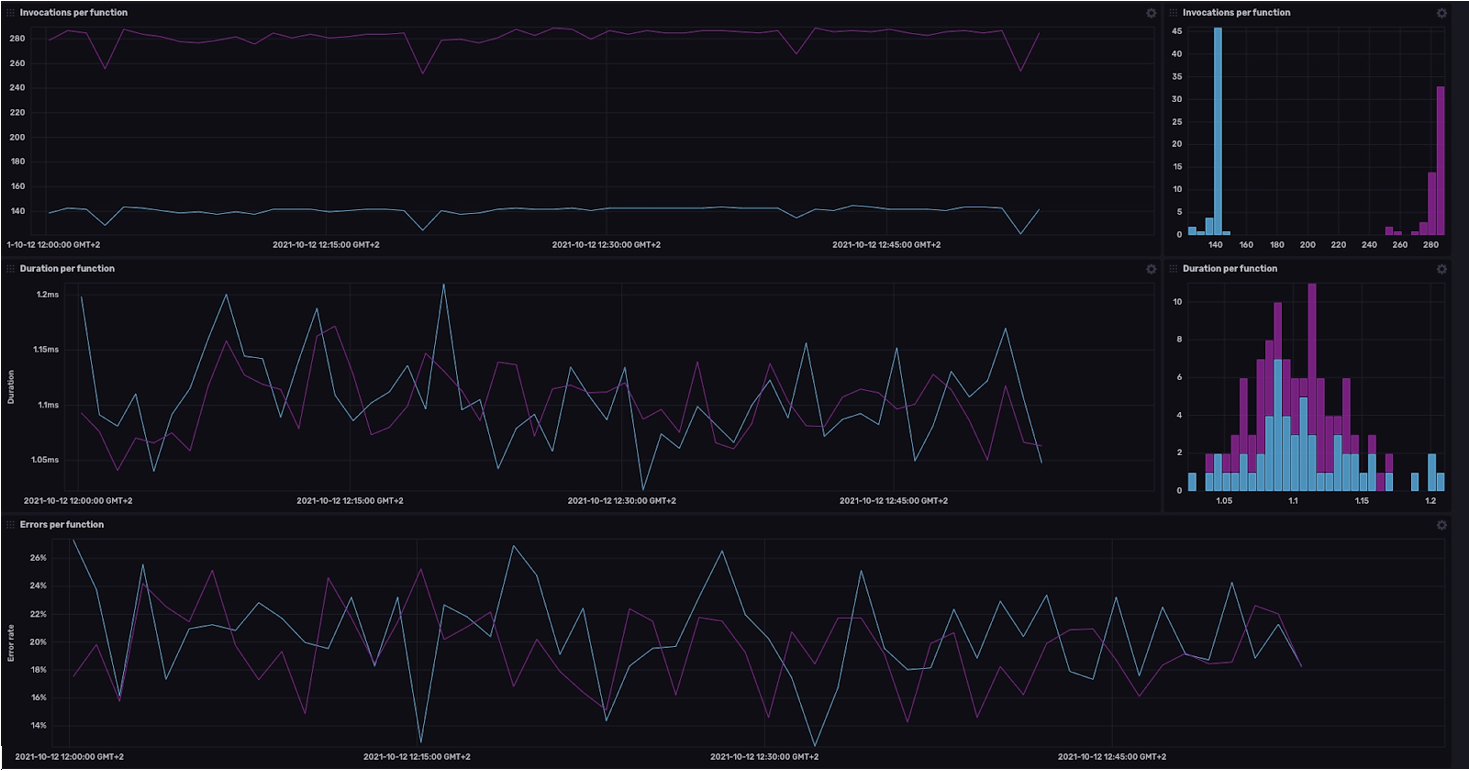
Once all of that is set up, you can make a request to your Lambda function using whatever tool you prefer. The template again provides a simple shell script to make some requests if you want to test things quickly. At this point you can refresh your dashboard after waiting a bit and you should see some results that look similar to this:
Next steps
The metrics made available by this template by default are the invocation count, error statistics, and throttle statistics. If you want to take things to the next level, you can extend the template by changing the configuration to bring in other Lambda metrics like duration and concurrency. You could also use the data you are currently storing in different ways by modifying the dashboard and adding different charts.
If you want to learn more about making templates be sure to dive into the documentation. The InfluxDB community has also created a number of templates for the most popular projects to save you time and effort, so be sure to check them out before you get started building from scratch. And if you do make something new you can share it with the community by submitting it to our community template repository.
