Gaining Real-Time Insight into AWS Spend Using a Time Series Platform
By
Chris Churilo
updated December 14, 2025
Use Cases
Product
Developer
Navigate to:
“It used to be, without having this level of insight into where your expenses were at, it was sort of just a black box,” says Robert Allen, director of engineering at Houghton Mifflin Harcourt (HMH) and part of the company’s Bedrock Platform Technical Services team.
Based in Boston, Houghton Mifflin Harcourt (HMH) is a nearly 200-year-old publishing company whose content is available through multiple media. As a global learning company, HMH specializes in pre-K–12 education content, services and cutting edge technology solutions for today’s changing landscape.
The HMH team wanted to gain real-time visibility, time to value, and control to better align performance with the fiduciary aspects of infrastructure operation. The three business challenges they faced were:
- Gaining real-time visibility into their AWS spend, which covers several accounts across multiple business units and many developer teams. The company needed real-time cost visibility into its many accounts, each of which manages its own services.
- Optimizing its DevOps monitoring (to optimize infrastructure cost for each individual product). Engineers were incentivized to just get the infrastructure working with no true hard regard as to what the cost was. They lacked that closed loop of feedback into what their infrastructure decisions are costing.
- Gathering and tracking KPIs to measure the performance of the company's online educational business. The HMH team had been collecting most of their KPI information using Elasticsearch, in a very mechanical way using log parsing. They needed a more dynamic and automated way to track those metrics.
These three challenges had one thing in common: they all involve time series data. Given the unique properties of time series workloads involving more data points, more data sources, more monitoring and more controls HMH realized they needed an enterprise-grade time series platform purpose-built for time-stamped data.
Solving multiple problems with one time series platform
HMH chose InfluxDB Enterprise, the hardened version of the open source core TICK stack. They take full advantage of InfluxDB Enterprise’s unique set of features - such as High availability, Horizontal scalability, and LDAP and OAuth support.
They currently have approximately 25 functional teams working to solve a particular product or a platform service problem within the company. Each of those is able to maintain their own databases and retention policies with InfluxDB.
HMH also deploys InfluxData’s open-source metrics collection agent Telegraf, to optimize spend and performance and inform decision-making. Telegraf proved to be the perfect fit for their container-based environment, as it accommodates very specific ways to collect metrics and can run in the container with a given process and monitor it locally.
Making the switch to Telegraf was easy since Telegraf is able to:
- Consume metrics for all aspects of the infrastructure
- Easily develop custom plugins and applications for metrics capture
- Capture once and ingest by multiple services
- Operate on one-to-many metric sources
They also used InfluxData’s Kapacitor, the platform’s native data processing engine. Kapacitor can process both stream and batch data from InfluxDB, acting on this data in real-time via its programming language TICKscript. Kapacitor’s powerful features helped solve HMH’s recurrent data challenges:
- Teams maintain their own workflows
- Templating of various workflows
- The ability to write User Defined Functions (functions that can communicate with Kapacitor to process data).
- Alerting for PagerDuty, Slack, Webhooks, etc.
- Advanced downsampling and transformation workflows (enabling them to retain the most significant data so they can still view overall trends in the data)
Houghton Mifflin Harcourt's DevOps monitoring and real-time analytics solution
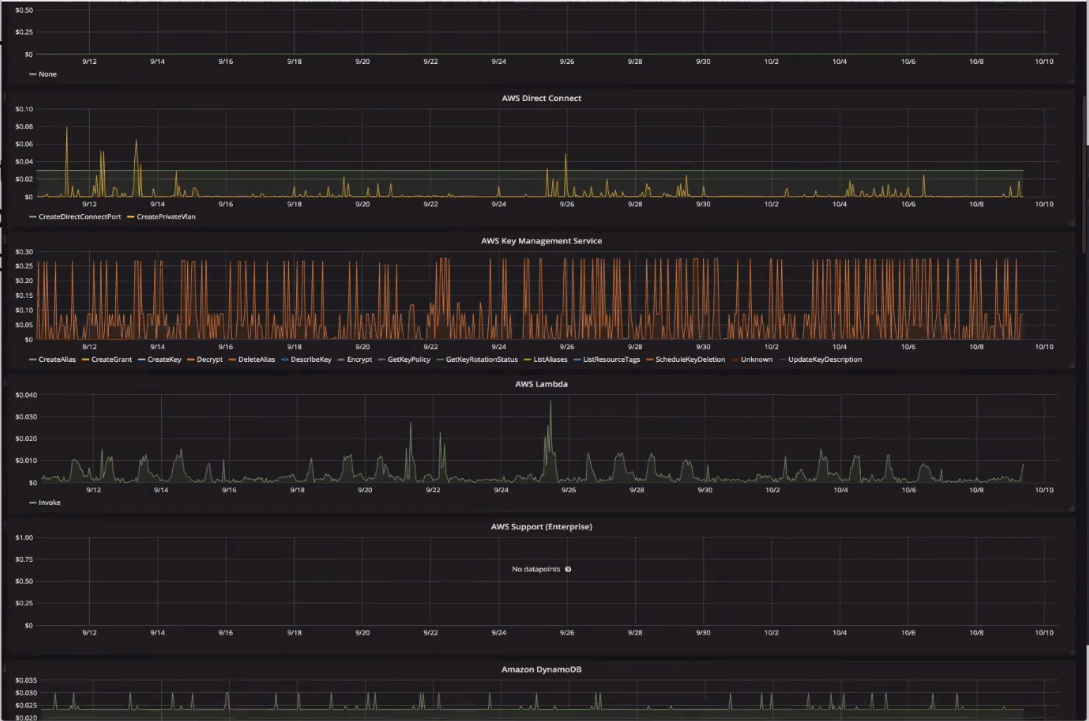
The HMH DevOps monitoring and real-time analytics solution also uses InfluxDB to monitor AWS billing. AWS Programmatic Billing provides very detailed data (a form of multi-billing provided in a massive CSV file). By nature, that data is rolled up at one-hour intervals. Users can be as detailed or broad in their dimensions using custom tags or other forms of reporting files.
HMH found that InfluxDB Enterprise handles large cardinality extremely well when the Time Series Index (TSI) is enabled. Cardinality is the number of unique time series that the database stores, and TSI enables the number of series to be unbounded by the amount of memory on the server hardware.
Each month, HMH ingests about 23 million line items from AWS (the AWS Cost and Usage report contains line items for each unique combination of AWS product, usage type, and operation that an AWS account uses). Each of these line items is converted into points and is at one-hour granularity, so every line item represents the billing for one hour.
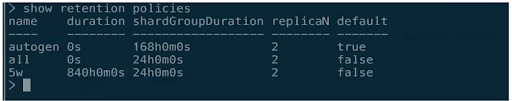
Using InfluxDB’s flexible built-in retention policy functionality, HMH customized the data storage duration to fit their needs. They set two retention policies for two distinct data types: a 5-week retention policy (that stores non-invoiced data and is used for day-to-day monitoring and for investigative purposes) and an Unlimited retention policy (that stores all invoiced data and never expires).
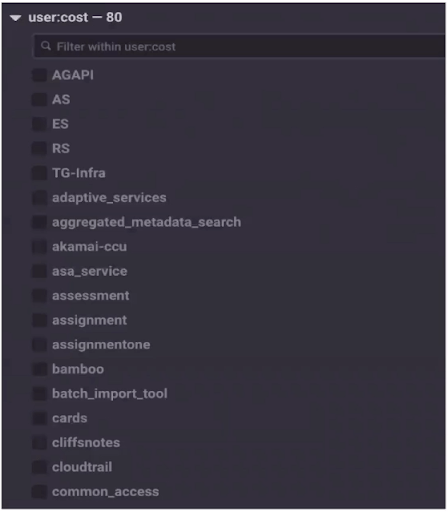
To enable reporting on cost analysis at the application/stage level in detail, they use custom tags (labels that the user or AWS assigns to an AWS resource). After cost allocation tags are activated, AWS uses them to organize resource costs on the cost allocation report, to facilitate categorizing, and to track AWS costs.
As for capturing the telemetry KPI data, they use Telegraf. The KPI data is stored in InfluxDB as events, counters, and metrics. Because the HMH team now has the flexibility of high cardinality, they are able to collect these metrics and roll them up using time series data.
Turning real-time visibility into business value
With the real-time visibility, time to value, and control that InfluxDB Enterprise has provided, Houghton Mifflin Harcourt’s Bedrock Platform Technical Services team can now:
- Perform data drilldowns to discover how the company's products are consuming AWS services
- View cost changes to identify deviations from what they expect versus what they know
- View Spend by Product, Hourly Cost, and also break down their Run Rate by certain products.
- Enable hundreds of engineers to coexist and develop without adversely impacting their peers' work
- Gain more control over what metrics they collect and how they collect them
The versatility of InfluxDB time series database allowed Houghton Mifflin Harcourt to use it for a variety of applications to monitor billing metrics, DevOps metrics, and KPI’s.
Learn more about this InfluxData use case by reading the full case study.
