An Introductory Guide to Grafana Alerts
By
Community
May 16, 2024
Developer
Navigate to:
Grafana is a resilient open-source dashboard and visualization platform celebrated for its ability to help users grasp complex data. The alerting system is an essential element enhancing its capabilities. By notifying users of data shifts or irregularities, the alerting system significantly improves the user experience.
This guide covers the basics of Grafana alerts, emphasizing their importance and offering practical tips for seamless setup. It also reveals essential components, highlighting their significance and providing hands-on advice for smooth configuration.
How do Grafana alerts play into system monitoring and observability?
Grafana alerts are integral elements of the Grafana platform, engineered to proactively inform users about particular events or conditions within their monitored data. Grafana alerts enhance system monitoring by providing timely insights into crucial changes, anomalies, or issues. At the core of system monitoring, Grafana alerts are crucial for reliability, stability, and performance. Their significance lies in delivering timely, actionable information, empowering users to uphold optimal system health, and responding adeptly to changing conditions. The key importance of Grafana alerts include:
- Proactive Notification: Designed to provide early user notification, Grafana alerts enable swift intervention before issues escalate. This proactive approach minimizes potential downtime and performance degradation risks. These alerts are critical in maintaining system reliability and preventing adverse impacts. Users can address emerging issues promptly, ensuring continuous and optimal system performance.
- Real-Time Monitoring: Grafana alerts operate in real time, continuously evaluating data against defined conditions. This real-time assessment informs users, allowing prompt responses for proactive control and system responsiveness.
- Customizable Conditions: Users can define the conditions that trigger alerts—metrics, thresholds, or other criteria. This customization tailors alerts to specific user needs. The flexibility allows a personalized approach, aligning alerts with individual goals. Users can adapt configurations as needs change, ensuring ongoing relevance. This adaptability means alerts are dynamic, reflecting evolving monitoring requirements. The user-centric approach enhances the effectiveness and responsiveness of Grafana alerts.
- Performance Optimization: Receiving alerts informs users about potential issues, promoting proactive system performance optimization. This timely feedback enables users to make necessary adjustments, fine-tune configurations, and allocate resources accordingly. Optimizing performance based on real-time feedback ensures systems operate at peak efficiency. Users can adapt strategies to evolving conditions, maintaining optimal functionality.
How Grafana alerts work
Grafana alerts work by continuously monitoring data based on predefined conditions set by the user. The platform operates as a proactive monitoring system, notifying users about critical changes or anomalies in their data. The flexibility to customize conditions, coupled with real-time evaluation, empowers users to maintain optimal system health and respond effectively to evolving conditions. Here’s a simplified overview of how Grafana alerts function:
- Users define conditions in Grafana, such as thresholds or patterns, for specific metrics or queries. Users can customize conditions to align with their criteria for triggering alerts.
- Grafana’s alerting engine continuously evaluates data against the defined conditions at specified intervals.
- When the system meets conditions in the evaluation period, it triggers an alert.
- Grafana initiates the notification process upon triggering an alert and delivers alerts through channels like email, Slack, or other integrations.
- Users receive alerts in real-time, allowing them to respond promptly to emerging issues. The goal is to enable quick intervention and resolution before the situation escalates.
- Grafana can integrate with external systems and services, allowing users to automate responses or take specific actions when alerts occur. The flexibility to customize conditions, coupled with real-time evaluation, empowers users to maintain optimal system health and respond effectively to evolving conditions.
How to install Grafana
Before diving into alert configurations, ensure you have Grafana installed. For the installation and operation of Grafana, it’s essential to have a compatible operating system, hardware meeting or surpassing minimum requirements, a supported database, and a compatible web browser.
Hardware Recommendations
Grafana requires some minimum system resources, although some features might require more memory or CPUs. The minimum recommended memory size is 512 MB, and the minimum recommended CPU is 1.
Supported Web Browsers
Grafana supports the current versions of the following browsers:
- Chrome/Chromium
- Firefox
- Safari
- Microsoft Edge
Using the latest browser versions with Grafana is advisable, as older versions may not be supported. Be certain to activate JavaScript in your browser, as running Grafana without JavaScript enabled is not supported.
Supported Operating Systems
If you meet the requirements listed above, you can go ahead and install Grafana with the instructions listed below:
Ubuntu:
On Ubuntu, Grafana installation can be done via several methods:
- Leveraging the Grafana Labs APT repository
- Downloading a .deb package
- Obtaining a binary .tar.gz file
To install Grafana, navigate to the Grafana download page, select your desired options, and copy and paste the code into your command line to execute it.
MacOS:
For MacOS installation of Grafana, it’s simplest to use Homebrew. From the Homebrew homepage, search for Grafana. From the Homebrew Grafana page, you can see that you can use brew install grafana to install Grafana and brew services start grafana to start Grafana.
Windows:
To set up Grafana on Windows, you have two options. First, you can leverage Grafana Cloud by creating a free account for a hassle-free experience. Alternatively, you can install Grafana using the Windows installer by navigating to the Grafana download page, choosing your options and Windows as an operating system, and going through the installer.
How to configure Grafana alert notifications
- Create a Dashboard:
- Open your Grafana instance in a web browser and log in with your credentials.
- Navigate to the Dashboard section in the Grafana interface.
- Click on the + icon or the Create button to start a new dashboard.
- On the dashboard, click + Add visualization button.

- Connect a Data Source:
- In the Grafana dashboard, navigate to the gear icon (⚙️) and select Data Sources.
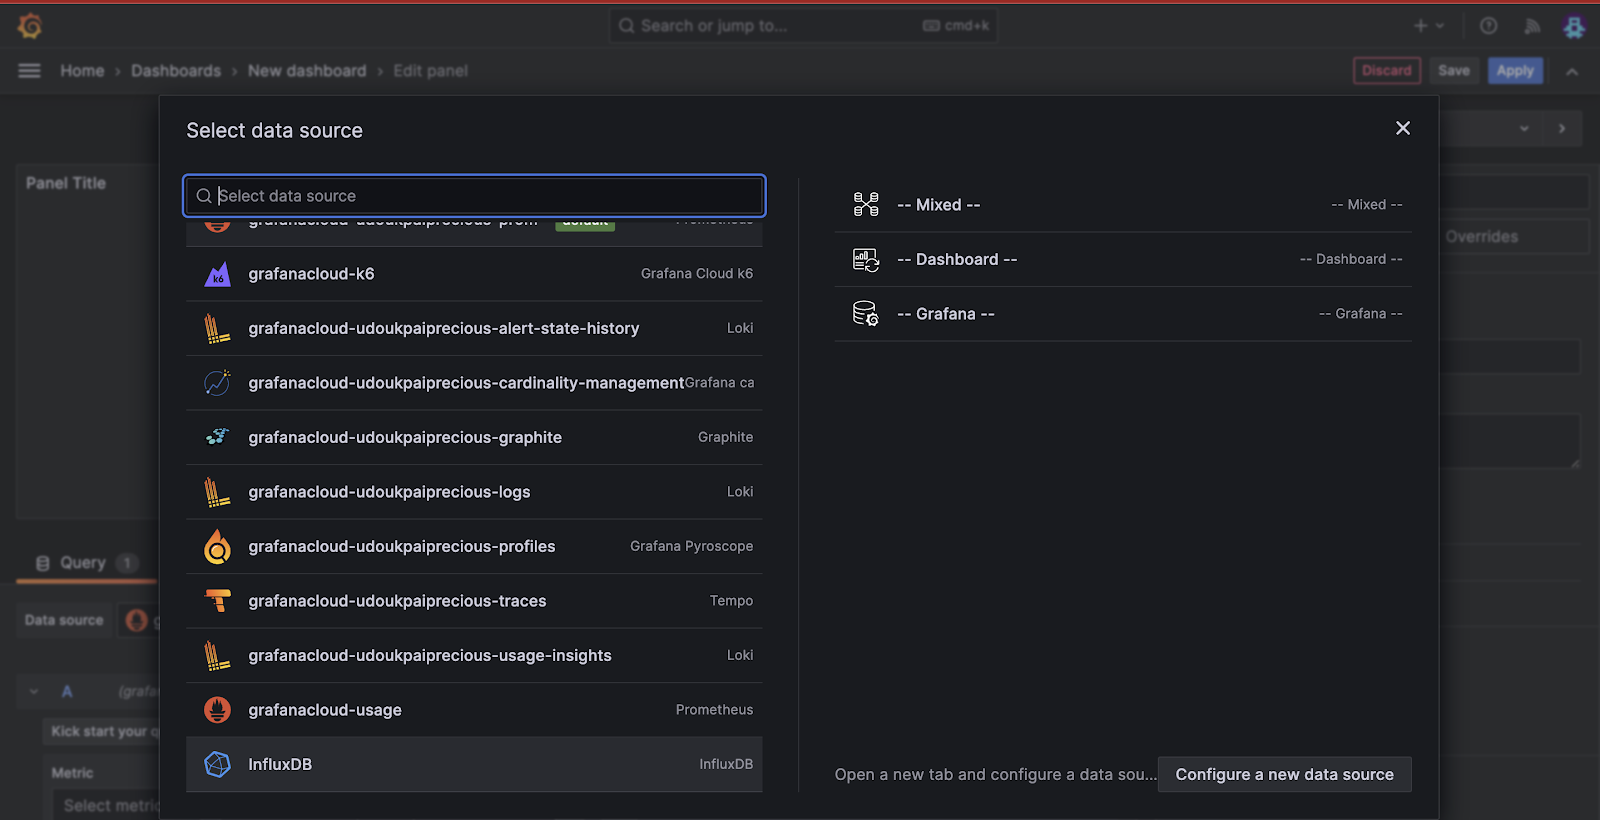 * Configure InfluxDB as a data source in Grafana by providing essential details: a name, InfluxDB URL, access method, database name, authentication (if required), HTTP method (usually GET or POST), and the minimum query time interval.
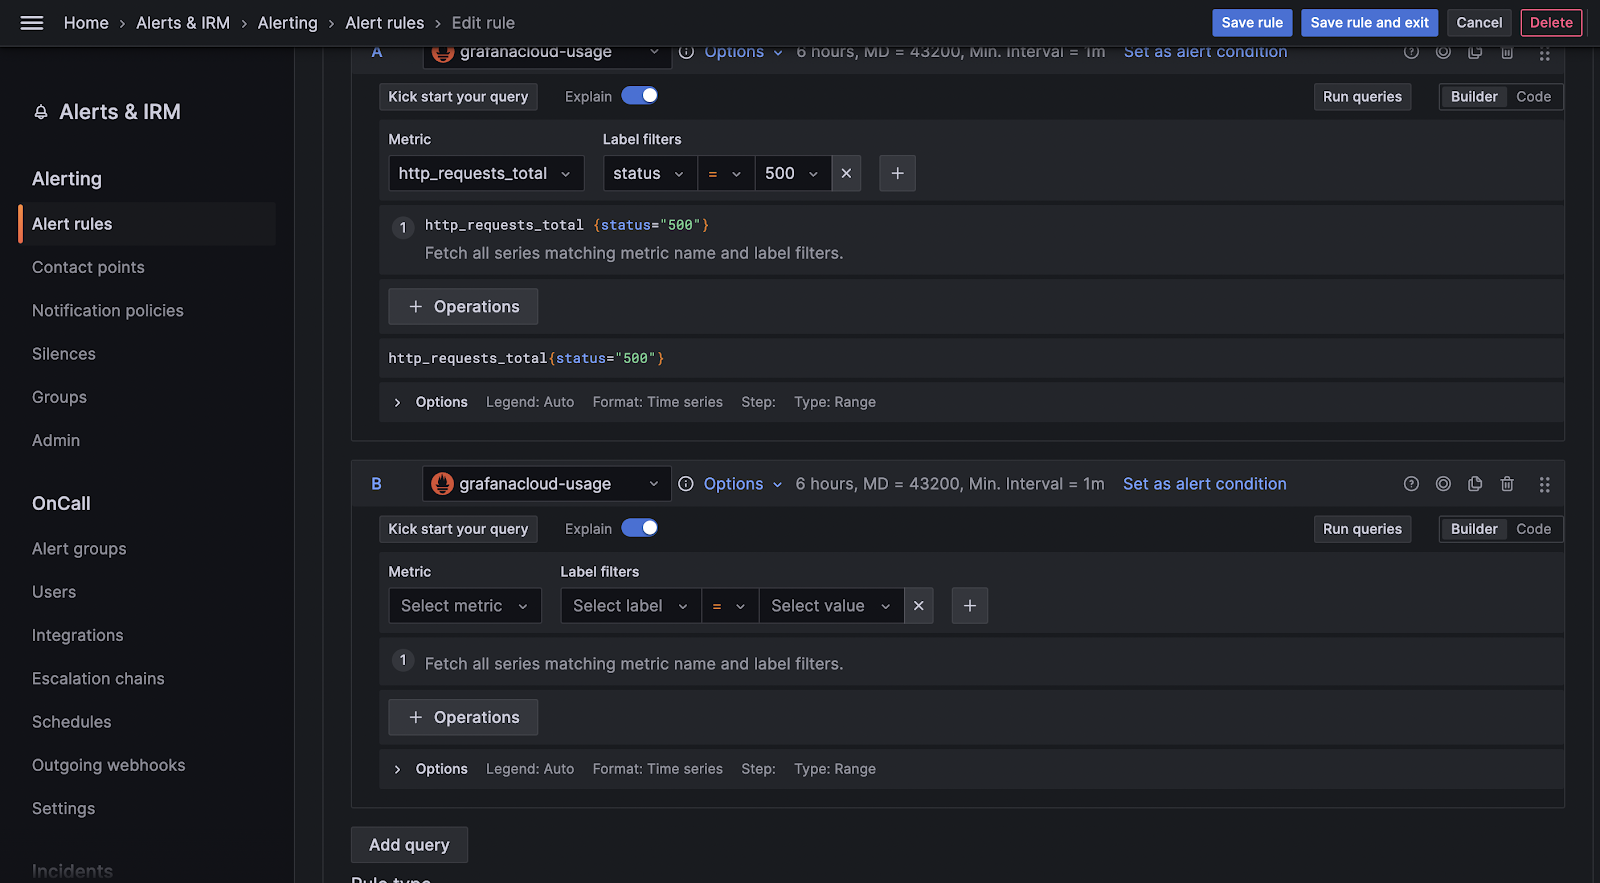
- Configure Alert Conditions:
- In the panel settings, go to the Alert tab.
- Set conditions for triggering alerts based on InfluxDB metrics. Define thresholds, time intervals, and other parameters.
 4. Add Notification Channel:
- In the Alert tab, click on contact points, then click on Add contact points.
- Give your contact point a name, select the notification method (e.g., Email, Slack, Webhook, Microsoft Teams), and provide details like the channel name and specific settings (e.g., email address and SMTP server for Email).
- Click on test notification, and a notification will be sent to the provided channel.

- Click on Save Rules and Exit.
How to effectively manage Grafana alerts
- Check Data Sources: Verifying that your data sources are correctly configured involves checking the settings and parameters you’ve specified in Grafana to connect to external databases or services.
- Verify Queries: Reviewing queries in Grafana involves a comprehensive examination of the configured queries for both displaying data on dashboards and triggering alerts.
- Regularly Review Alerts: Modifying alert configurations to suit evolving system requirements involves adjusting the setup and triggering of alerts in response to changes in the environment or the objectives of your monitoring system.
- Set Meaningful Thresholds: Establishing thresholds that align with your system’s typical behavior is essential to avoid false positives in alerting. This involves defining limits or values that indicate a deviation from the norm, signaling a potential issue.
Next steps
Mastering Grafana alerts empowers users to stay on top of their data, proactively address issues, and maintain system reliability. Whether you’re a beginner or an advanced user, incorporating Grafana alerts into your monitoring strategy is a key step toward efficient and effective data management. The insights provided in this article serve as a guiding resource, allowing both beginners and advanced users to integrate Grafana alerts into their monitoring strategy seamlessly.
Check out these other tutorials on how you can use Grafana and InfluxDB:
- Grafana dashboard tutorial
- Grafana and Home Assistant tutorial
- Getting started with InfluxDB and Grafana
This post was written by Precious Ukpai. Precious is an Experienced Full Stack (MERN) JavaScript developer. He loves contributing to Open source software and also sharing his knowledge and experience to help people solve basic software development problems.
