HAProxy Monitoring (the InfluxDB Way)
By
Ignacio Van Droogenbroeck
updated December 14, 2025
Product
Use Cases
Developer
Navigate to:
My personal experience with HAProxy dates back to my work with a previous company, where we used HAProxy to do load balancing between pairs of servers with specific roles. Those servers are the core of the major payment gateway in Uruguay, where thousands of users use them every day to pay their bills, recharge their mobile phones, pay parking fees, and even play lottery numbers.
Before I created The HAProxy Monitoring Template an InfluxDB Template we were blind in terms of understanding how HAProxy was performing or even if our users viewed any error when they tried to do some transactions.
What happens if you don't monitor HAProxy
If you don’t monitor HAProxy, your users are the alert method to understand if something isn’t working as expected. Before starting to monitor using InfluxDB, we had a hard time responding when developers or customers told us: “The application is working slow.” We had to review each part of the architecture and ask ourselves: Is the application, bandwidth, or backend to blame what’s going on? We had to make a diagnosis in this almost blind scenario. This takes time, and time is money.
When you need to analyze the server’s and your application’s performance, you can use InfluxDB. We used the built-in tool to get metrics and bring them to InfluxDB, create a dashboard and alerts to monitor the service’s performance, and if, for example, our users and developers received an HTTP code 200 or something else we’d know. They didn’t need to run in circles screaming “Fire, fire, fire!” when something didn’t work as expected.
The above scenario is what led me to create the The HAProxy Monitoring Template profiled below. But first, a quick refresher on HAProxy and InfluxDB Templates.
Overview of HAProxy load balancing
HAProxy is an open-source TCP/HTTP load balancer software and proxy server for TCP and HTTP-based applications. It can run on Linux, Solaris, and FreeBSD to improve the performance and reliability of the server environment by distributing workloads across multiple servers. HAProxy is used by some of the world’s highest-traffic websites. HAProxy load balancing algorithms determine which server, in a backend, will be selected when load balancing.
Overview of InfluxDB Templates
InfluxDB Templates let you quickly define your entire monitoring configuration (data sources, dashboards, and alerts) for any technology in one easily-shared, open-source text file that can be imported into InfluxDB with a single command. Most InfluxDB Templates are community-contributed, so if you’re interested in submitting your own InfluxDB Template, learn how to build one.
Collecting HAProxy metrics with InfluxDB
The HAProxy Monitoring Template has a preconfigured dashboard.
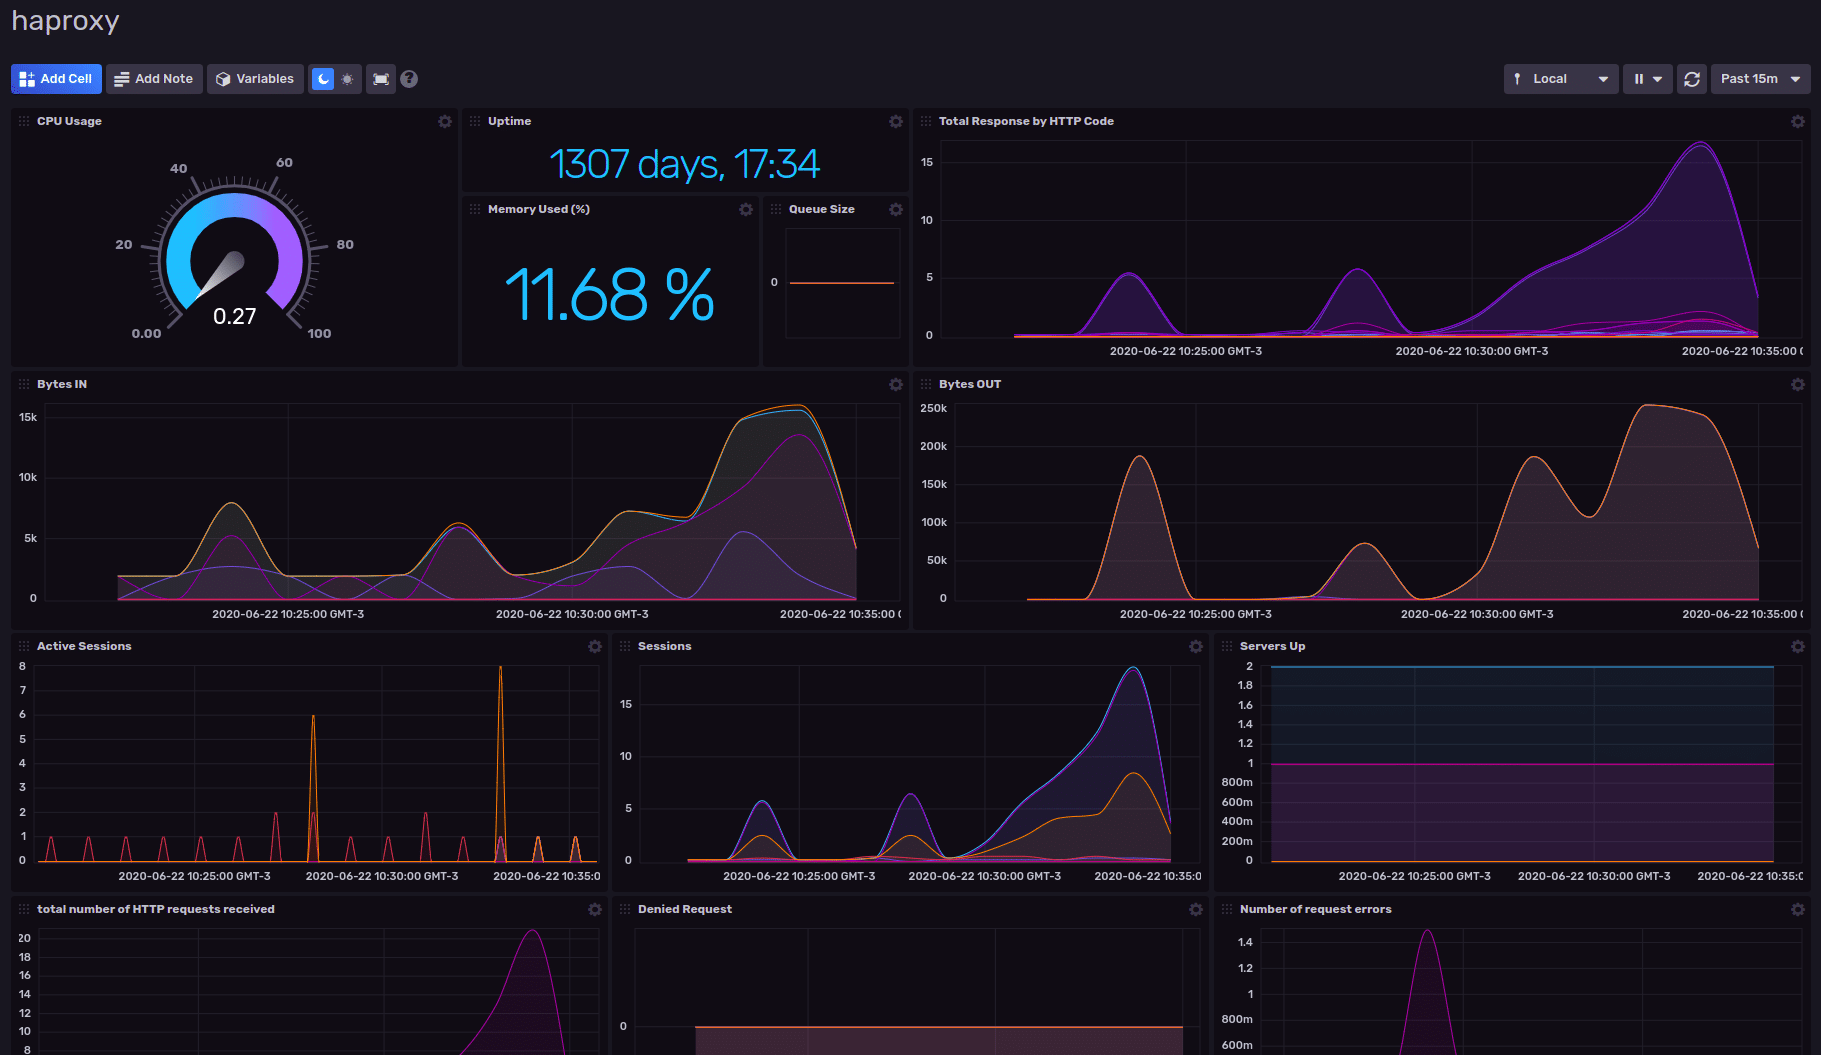
The template uses the HAProxy Telegraf Plugin to collect metrics about HAProxy and store them in InfluxDB, which is then presented in the included dashboard:
- Telegraf is InfluxDB's open-source, plugin-driven metrics collection agent.
- The Telegraf plugin gathers statistics using the stats socket or HTTP statistics page of a HAProxy server.
- The HAProxy Monitoring Template webpage lists the HAProxy metrics you can monitor using this dashboard.
Installing the template is easy:
- Once your InfluxDB credentials have been properly configured in the CLI, you can install the HAProxy monitoring template using the Quick Install command.
- Once installed, the data for the dashboard will be populated by the included Telegraf configuration, which includes the relevant HAProxy metrics.
- General instructions on using InfluxDB Templates can be found in the use a template document.
It’s worth noting that this template can be used with the Linux System Monitoring Template. To install the HAProxy Monitoring Template, sign up for your free InfluxDB Cloud account.
A great way to get started with InfluxDB
Developers need to have visibility of how their applications are performing. It’s also important to store that data in a system that allows you to manipulate it, and InfluxDB can help. This is why InfluxDB Templates are a great way to get started with InfluxDB and time series storage.
Are you developing an application or device that gets important data to your customers? Count on InfluxDB; it’s not only important to get the data. The value resides in what we can do with that data to improve customers’ business. For example, can your application/device measure the quantity of water used in the farm? You can store that data in InfluxDB. You, the customer, can understand if the water is being used efficiently. Do you have an IoT device that counts the number of people in front of a business within a period of time? InfluxDB also helps, and your customers can do promotions in a specific period of the day to get more customers.
I can spend the entire day talking to you about how InfluxDB can help bring value to your IoT or monitoring solutions, and maybe I will do just that in a future blog post!
