How to Build Grafana Dashboards with InfluxDB, Flux, and InfluxQL
By
Al Sargent
Product
Use Cases
Developer
Jul 16, 2020
Navigate to:
We’re excited about today’s release of Grafana 7.1, which extends Grafana’s built-in InfluxDB datasource to run queries in both the Flux language and InfluxQL. This means it’s super easy to connect Grafana to InfluxDB — whether you use InfluxDB 1.8 or 2.0, Flux or InfluxQL.
Because this InfluxDB datasource is built into Grafana 7.1, there is no separate plugin to download and install. You get a simplified configuration experience that’s the result of the Grafana and InfluxData engineering teams working closely over the past several months, and one more step in our journey to “time to awesome”.
If you’re an InfluxDB Cloud 2 user, Grafana has updated the InfluxDB Data Source to support Flux, without requiring you to separately install a Flux plugin.
If you’re an InfluxDB 1.x user, now you can use Flux queries in your Grafana dashboards, in addition to InfluxQL. Use Grafana 7.1 to create a new InfluxDB Data Source and choose Flux as the language. Flux allows you to write queries that go beyond the limits of InfluxQL, as explained below. Of course, your existing InfluxQL queries will continue to work as they always have.
Leverage InfluxQL in InfluxDB Cloud 2 with Grafana 7.1
If you have been using InfluxDB 1.x and have considered using InfluxDB Cloud 2, we have some exciting news to share. InfluxDB Cloud 2 now supports InfluxQL along with the InfluxDB 1.x write API (details below). This means you can sign up for InfluxDB Cloud 2, send data to it, and leverage your existing dashboard with just a few security credential changes. Your existing Grafana dashboards do not need to be adjusted in any way.
Do more in your Grafana dashboard queries
With Grafana 7.1, you can create much more powerful queries to populate your dashboard charts, by using Flux queries to do things that just aren’t possible in InfluxQL:
- Joins, to create graphs that span multiple buckets. For example, you might want a Grafana chart that displays both bytes transferred and requests per second; Flux allows you to query these two measurements and join them into a single table.
- Math across measurements, which go beyond simple joins to allow you to do math on columns in the joined table. For example, you might want to divide an error rate by a request rate to get an error rate percentage.
- Multiple datasources, allowing you to enrich time series data with metadata from relational databases such as MySQL, MariaDB, Postgres, Microsoft SQL Server, Snowflake, SQLite, AWS Athena, and Google BigTable; or from CSV files. This is useful when, for example, your time series data includes customer number fields but not customer names. Flux allows you to pull in the customer name so that it can be displayed in your Grafana dashboards. Here are some tutorials that explain further.
Other features unique to Flux include:
-
- Sort by tags, rather than sorting only by time
- Group by any column, including grouping by measurement values
- Window by calendar months and years. Grouping by month works whether a month contains 28, 29, 30, or 31 days, and grouping by year works for regular and leap years.
- DatePart-like queries, which let you get all datapoints from, say 9 am to 5 pm
- Pivot with the ability to specify your row key, column key, and value column.
- Histograms, specifically cumulative histograms.
- Covariance between columns, or two data streams.
- Cast booleans to integers, as part of Flux's set of conversion functions.
- String manipulation and data shaping, using Flux's string package for sanitization and normalization.
- Work with geo-temporal data using Flux's geotemporal query package.
- Visual Studio Code integration, with syntax highlighting, autocomplete, and more
- vim integration, with syntax highlighting and autocompletion
- Sophisticated anomaly detection, using techniques like Median Absolute Deviation (MAD) and Balanced Iterative Reducing & Clustering (BIRCH) to help you find fix problems faster and reduce your mean time to resolution (MTTR)
- Alert notifications into PagerDuty, Slack, Discord, Microsoft Teams, Telegram, Pushbullet, and webhooks
Here’s a detailed comparison of InfluxQL and Flux with code samples.
How to integrate Grafana with InfluxDB
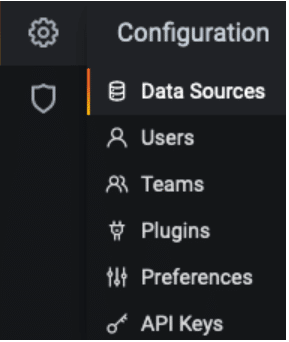
Log into Grafana as usual, click on the gear icon on the left, then choose Data Sources:
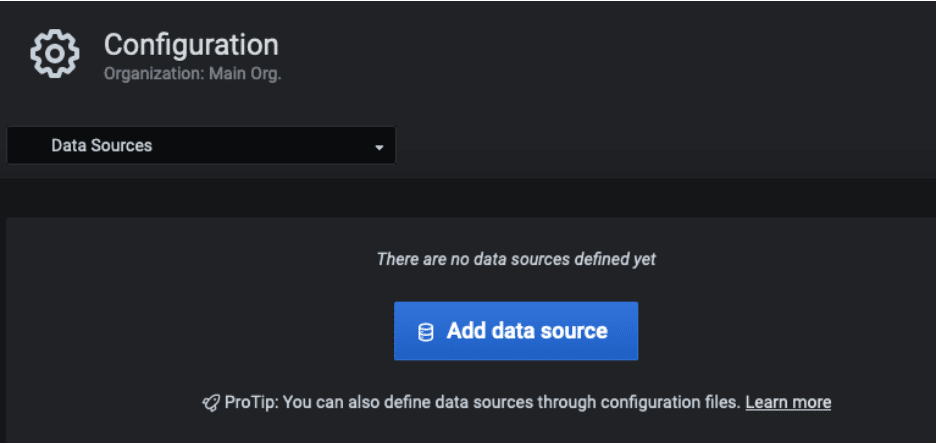
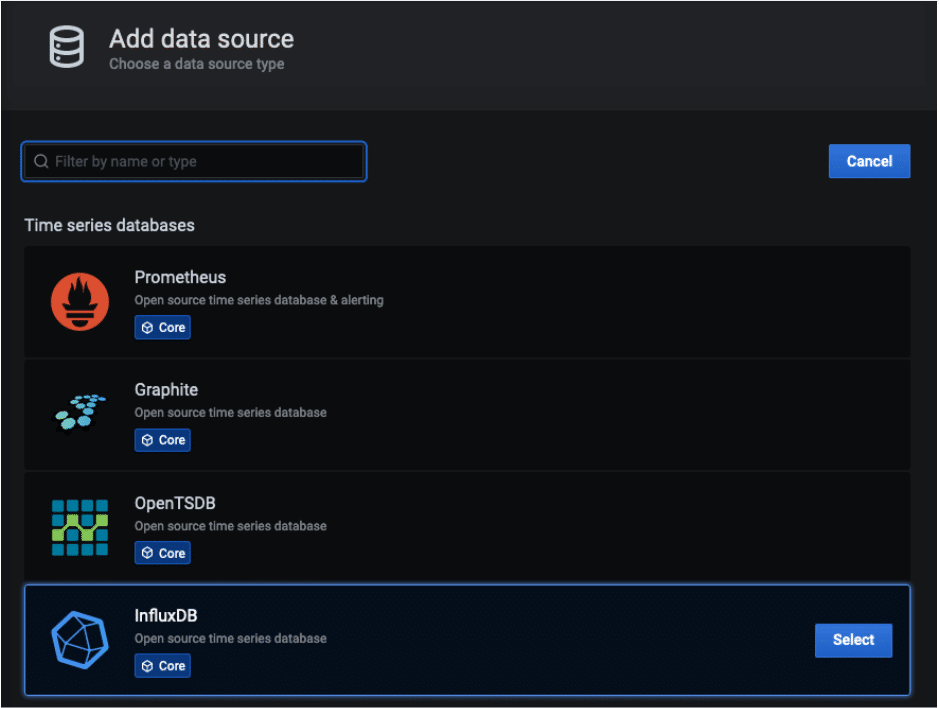
Click on Add data source:
Hover over InfluxDB, then click Select:
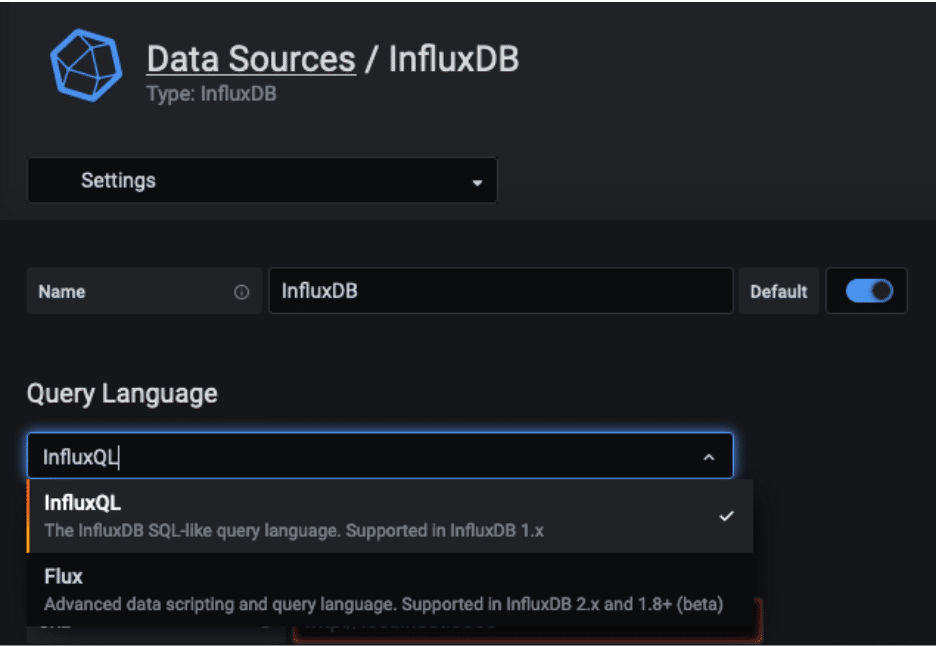
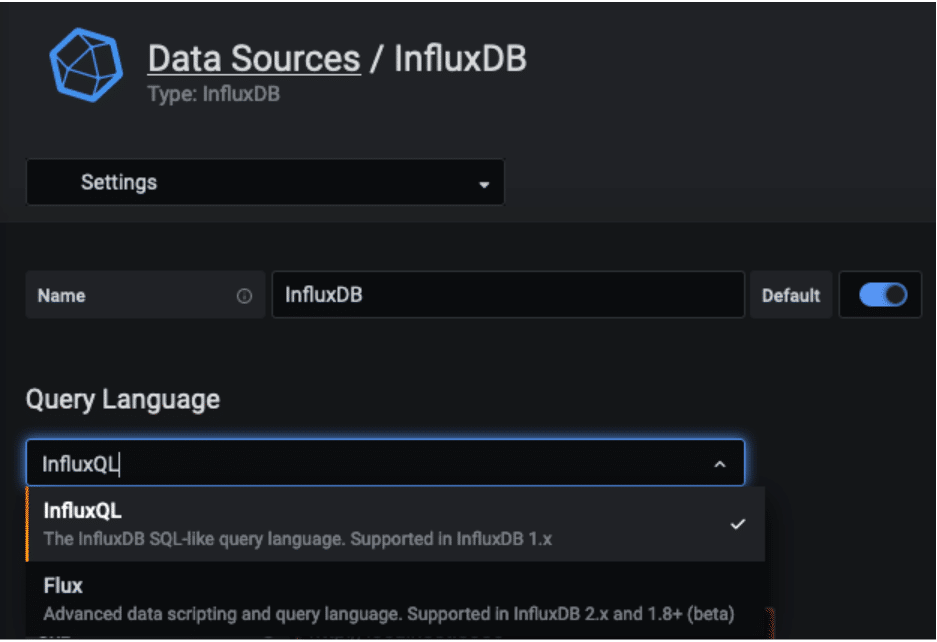
So far, this probably looks familiar if you’ve used Grafana previously. But here’s what’s new in Grafana 7.1: the ability to choose which language you want to use, InfluxQL or Flux:
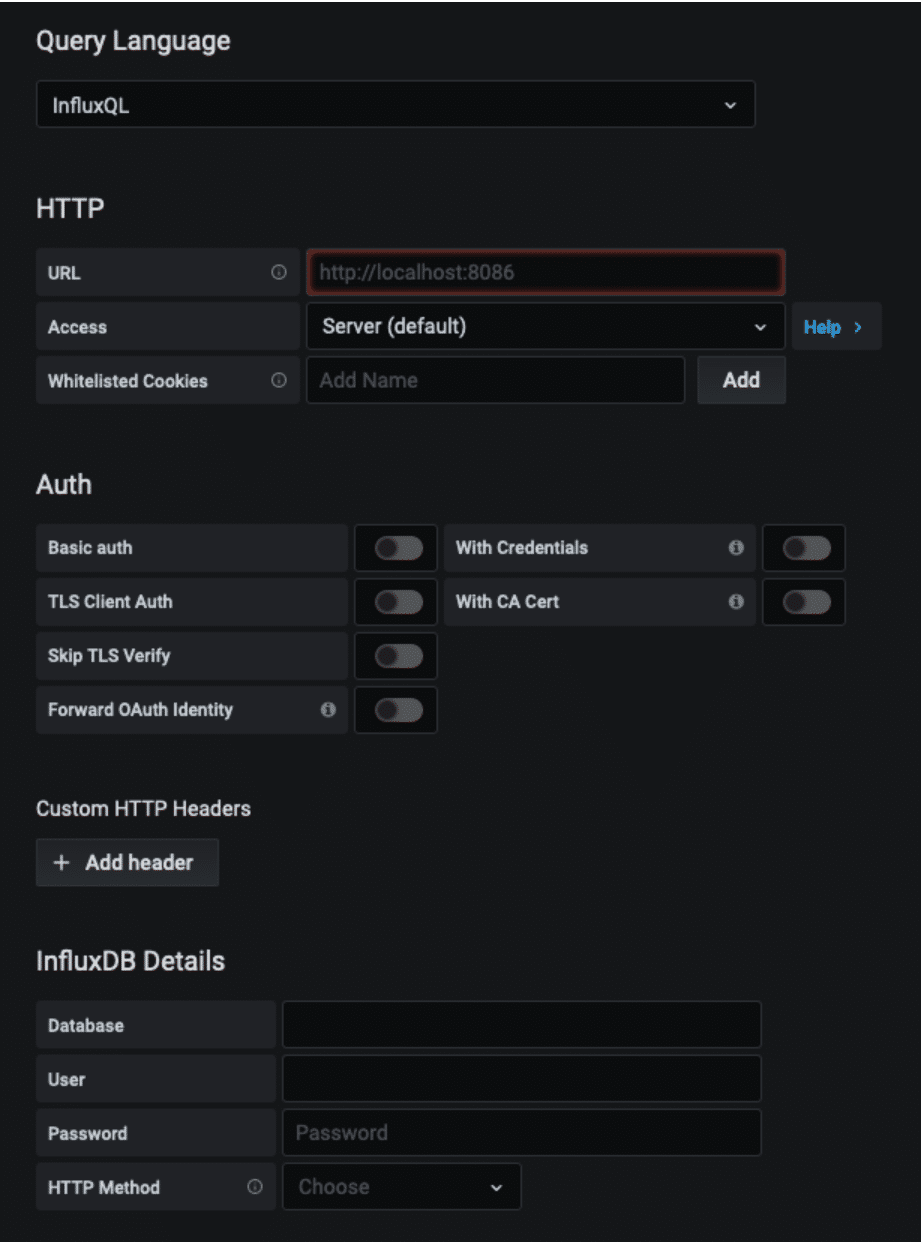
If you choose InfluxQL, you’ll see the configuration page below. When filling in the URL field, keep in mind that for InfluxDB 1.8, the default port is 8086. For InfluxDB Cloud 2, here are the URLs that you can use. Further details are in this documentation page.
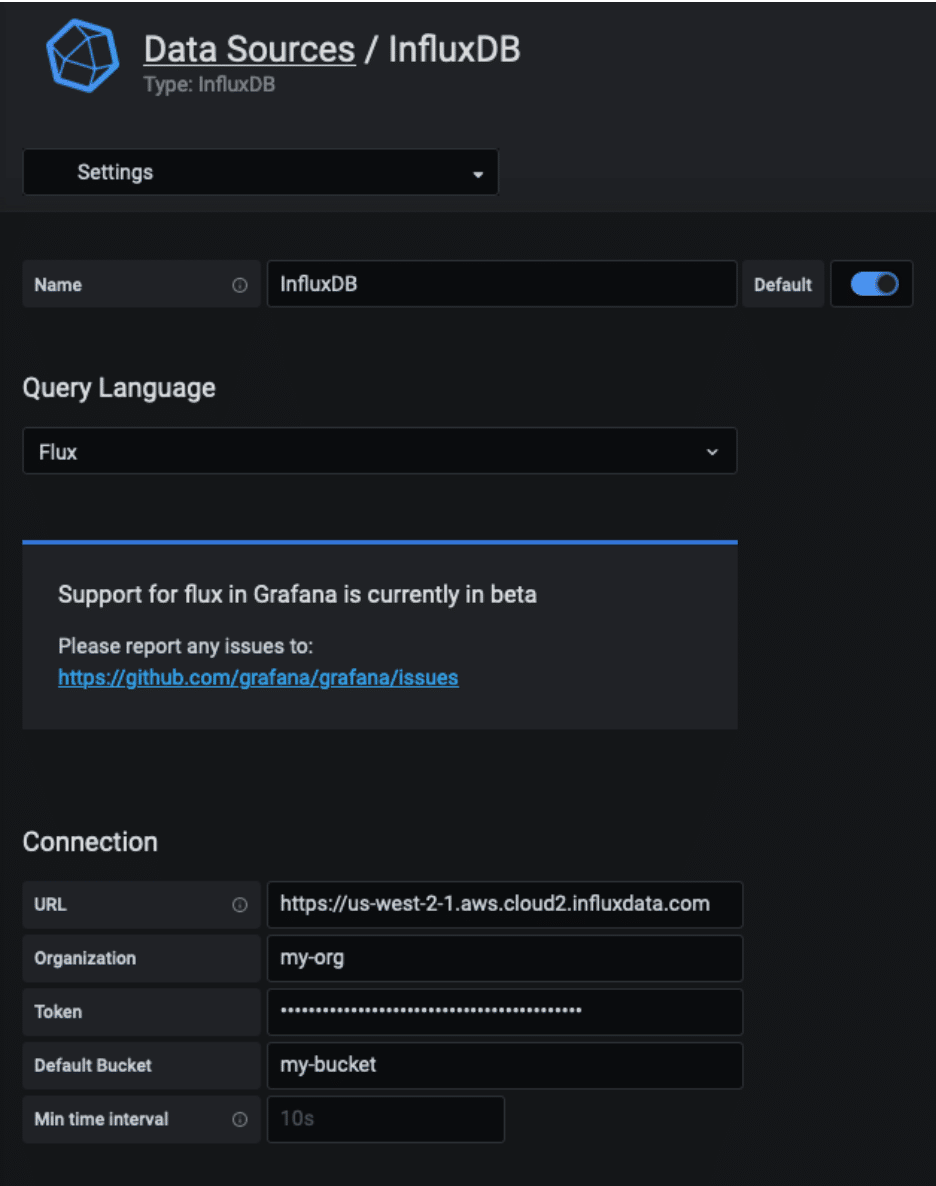
And if you choose Flux, here’s what to specify:
- Choose the InfluxDB data source
- Choose the Flux language
- Fill in the connection details with your InfluxDB Cloud 2 URL, organization, token, and bucket — as shown in the screenshot below.
Here I’ve specified AWS US West 2 (Oregon) in my URL, but you might be running in a different region. Your org name and bucket name will probably be different as well.
You can also create multiple InfluxDB Data Sources in Grafana. You have a lot of flexibility here. You can, for instance:
- Create two data sources that point to the same InfluxDB instance, once of which uses Flux, and another that uses InfluxQL. (See screenshot below.)
- Create multiple data sources to connect to different InfluxDB instances.
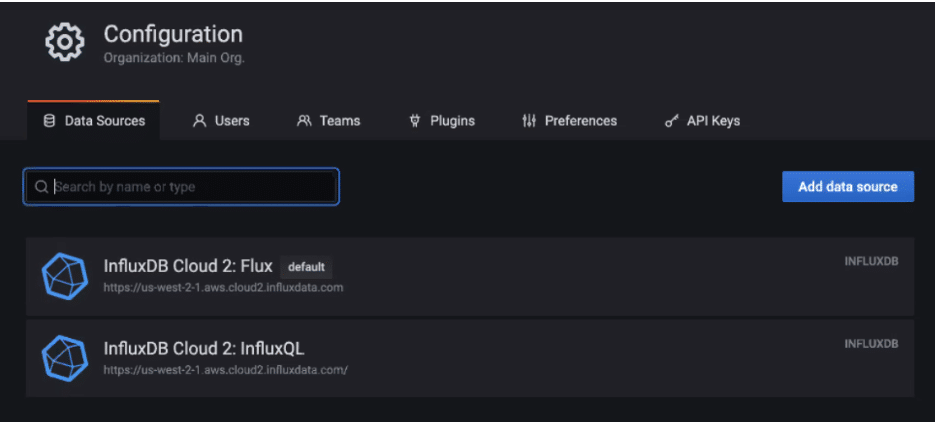 <figcaption> Both data sources connect to InfluxDB Cloud 2 on AWS Oregon, but one uses Flux and the other uses InfluxQL.</figcaption>
Demo of Grafana, InfluxDB, Flux and InfluxQL
Here’s a demo showing how this new Grafana plugin for InfluxDB works, which Grafana team member Ryan McKinley presented at InfluxDays London 2020 Virtual Experience:
More flexibility around writes
As mentioned above, we’ve exposed the InfluxDB 1.x write API in InfluxDB Cloud 2. That means if you have code that sends data to InfluxDB 1.x, you now point that code to InfluxDB Cloud 2 and write your data. Here’s where you can learn more about this InfluxDB 1.x compatibility API, including how to authenticate all your writes and queries, as well as access the compatibility endpoints. This level of compatibility is part of our roadmap for InfluxDB 2.0 Open Source (OSS). Look for more details on this later this quarter.
Availability
This integration is available today with the launch of Grafana 7.1. The plugin is built into core Grafana, so there’s no separate plugin to install.
Let’s dive into the details of the integration. Between all the different variants of Grafana, InfluxDB, and language (InfluxQL/Flux), there are a lot of possible combinations.
The new InfluxDB datasource for Grafana work for Grafana 7.1 whether you’re using Grafana open source, Grafana Enterprise, or Grafana Cloud, and supports:
- Grafana 7.1 dashboards using Flux, running against InfluxDB Cloud 2, InfluxDB OSS 2.0, or InfluxDB 1.8+ (Enterprise, Cloud 1, or OSS)
- Grafana 7.1 dashboards using InfluxQL, running against InfluxDB Cloud 2, or InfluxDB 1.8+ (Enterprise, Cloud 1, or OSS)
Or if you prefer a table view:
| InfluxDB Product | Version | InfluxQL? | Flux? |
| Open Source | 1.8 | Yes | Yes |
| Enterprise | 1.8 | Yes | Yes |
| Cloud | 1.8 | Yes | Yes |
| Cloud | 2.0 | Yes | Yes |
| Open Source | 2.0 | No, coming later this year | Yes |
I want to be upfront about one integration that does not currently exist but which we plan to deliver later this year:
Grafana 7.1 dashboards using InfluxQL, running against InfluxDB OSS 2.0.
What's the price of Grafana + InfluxDB integration?
The new InfluxDB datasource is built into Grafana 7.1. There is no separate plugin that needs to be installed or separately purchased. Here’s pricing for Grafana Cloud and InfluxDB Cloud.
Get started with Grafana and InfluxDB
Grafana and InfluxDB are available in a number of different form factors. Here’s where you can find the various editions of Grafana and of InfluxDB.
Once you’ve gotten Grafana and InfluxDB up and running, see this guide on how to integrate InfluxDB 1.8 with Grafana, and this document on integrating InfluxDB 2.0 with Grafana. Then join our ever-helpful InfluxDB community and Slack for questions.
Additional Grafana resource: How to Integrate Grafana with Home Assistant
