Table of Contents
Everyone says the cloud is the future. Sure, but try telling that to someone who has terabytes of sensitive data stored in an on-prem InfluxDB Open Source (OSS) instance, and they will bring up a whole set of reasons why it doesn’t make sense for them to move into the cloud right now. There are also some use cases which make more sense for on-prem software deployments.
Maybe you’re a massive gaming company hosting millions of online game matches per day. During each match, you need lightning-fast data access, but after the match is done, the raw data isn’t very useful (although a summary aggregation might be). Spinning up a local InfluxDB instance and leveraging it for real-time gaming data makes a ton of sense. You still need to make sure that the local instance of InfluxDB is healthy, and doing that in aggregate across all your open source instances makes a ton of sense.
This post isn’t about moving your time series data into the cloud. This post is about exporting the monitoring metrics of your local InfluxDB OSS instances to a single InfluxDB Cloud account. This allows you to quickly see the status of all your InfluxDB instances and add monitoring for important events. Hopefully, this will help you sleep a little better at night, and who wouldn’t want that?
In this blog, I’ll start with a simple architecture that can be applied to any number of InfluxDB OSS instances you’re managing, where you can push monitoring information to a centralized InfluxDB Cloud account, and take advantage of some of the included dashboarding and alerting capabilities. Because we are doing all of this via a simple sidecar pattern, you won’t need to change your InfluxDB instance at all. Let’s get started.
Architecture overview
As I mentioned before, we are going to leverage a Telegraf sidecar that sits next to your InfluxDB instance. It will scrape Prometheus metrics from each instance and push them to a centralized InfluxDB Cloud account. Don’t worry if you don’t know what Telegraf is or how to read Prometheus metrics, it all happens for you with just a few lines of configuration. At the end of the process, you will have something that looks like this.
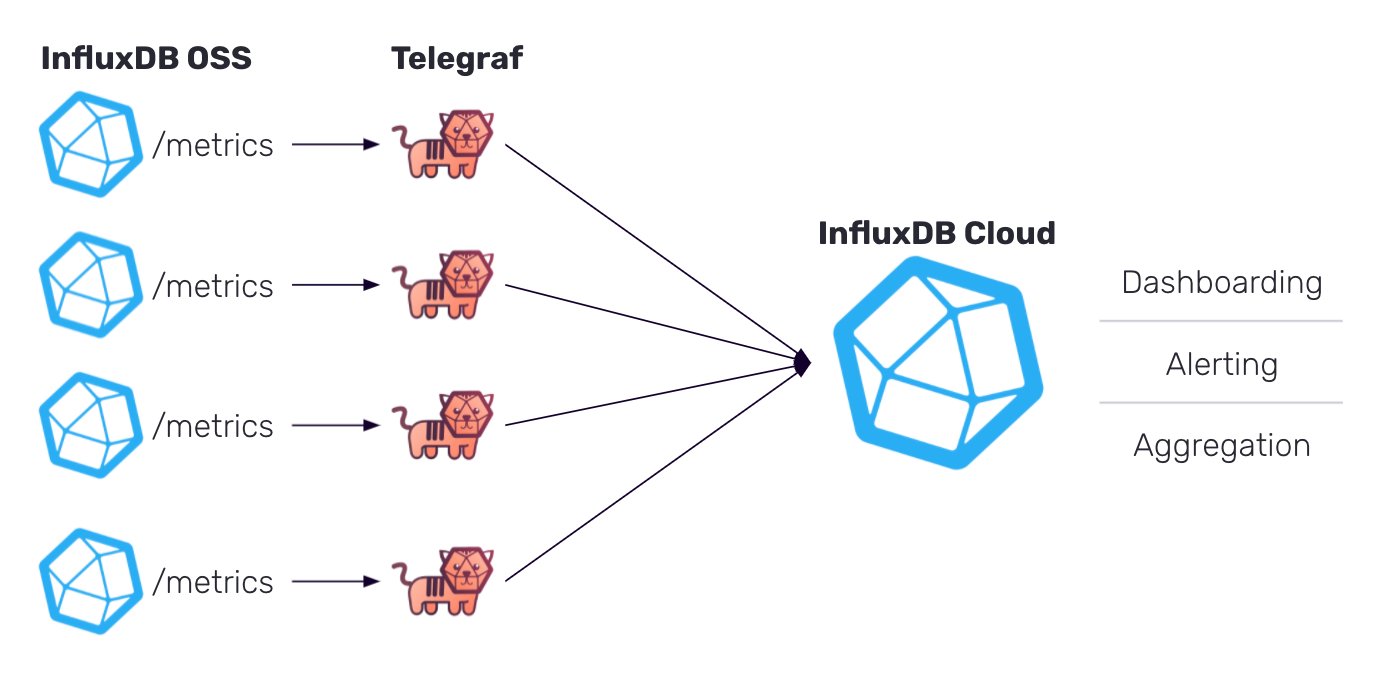
This can be deployed for just a single InfluxDB OSS instance, or automated for hundreds.
Sign up for a free InfluxDB Cloud account
If you already have an InfluxDB cloud account, you can skip this section. Just make sure you can log into your account before continuing.
Since we’re going to be pushing the InfluxDB OSS metrics into InfluxDB Cloud, it makes sense to start by signing up for a free account. All you need is a working email address and a browser, so head on over to InfluxDB Cloud and sign up for a free account.
Once you verify your email and select your region, you’ll drop into your brand new InfluxDB Cloud account, which looks something like this:
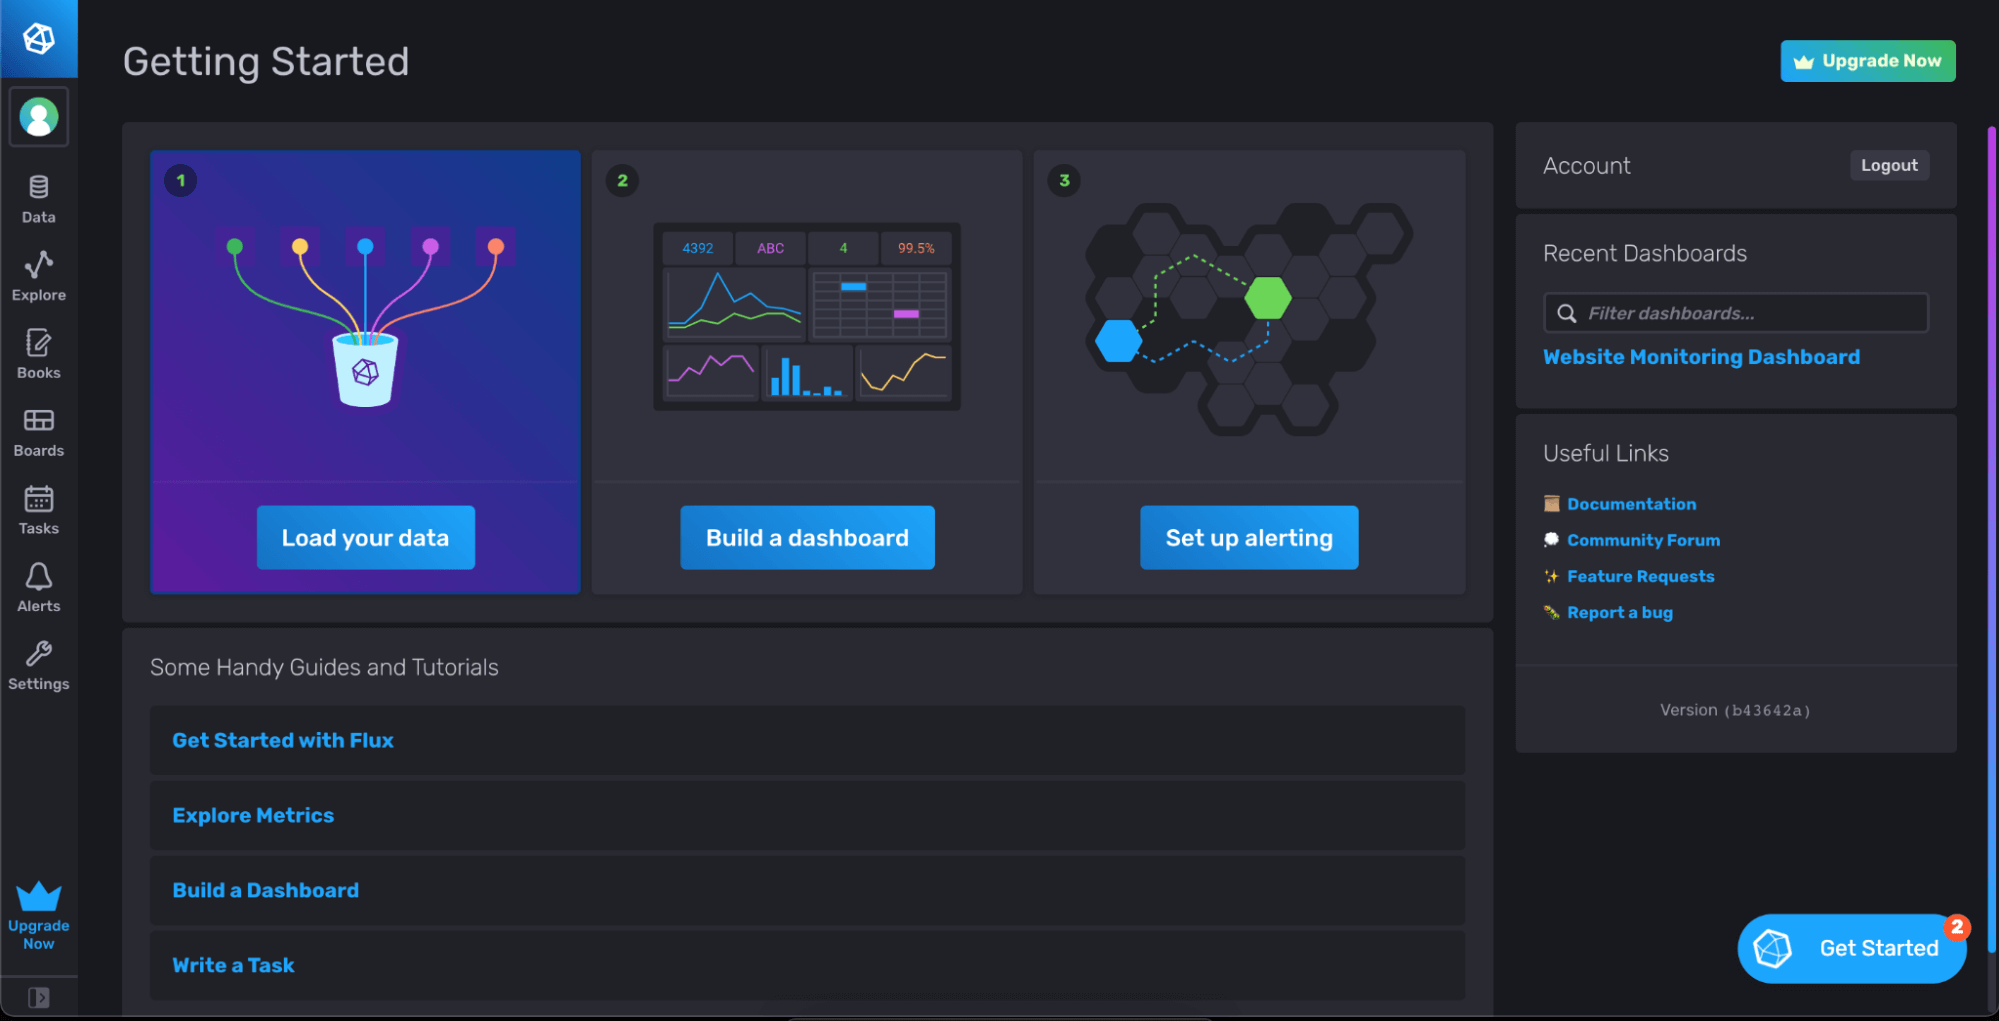
Feel free to play around a bit and get familiar with the interface. There is some demo data available to help you get started.
Setting up InfluxDB OSS
By default, InfluxDB OSS has a /metrics endpoint available which exports Prometheus-style metrics. If you have changed any of the default settings to disable this endpoint, you will need to re-enable them for this setup to work.
If you open up http://hostname:port/metrics (http://localhost:8086/metrics by default) in your browser, you should see something like this:

Here you will find tons of information about what’s happening in your InfluxDB instance, including memory usage, boltdb accesses, api requests and much more. As you refresh, you should see these numbers change as your open source instance is being used. This is the data we are going to scrape and send to your InfluxDB Cloud account. Now it’s time to deploy and configure our data collection agent.
Deploying and configuring Telegraf
As mentioned above, Telegraf is our wildly popular, open source data collection agent that can be configured to fetch data from almost anywhere. It is plugin-based, so you can configure any number of input plugins (there are over 100) and output plugins, and Telegraf handles all the fetching, scraping, buffering and retrying for you. It’s great for getting data into InfluxDB.
A Telegraf agent should be deployed to the same machine that InfluxDB OSS is running on. I won’t cover that installation and deployment here, since there are so many patterns. It’s most likely available in your preferred package manager with a simple install telegraf command. You can also deploy it via Docker or Kubernetes very easily.
Once you’ve installed Telegraf, it’s time to create the configuration file. Telegraf is configured via a simple TOML file that can have as many plugins as you want in it. In this case, we are going to enable two inputs: one to scrape the Prometheus metrics from the InfluxDB instance, and another to monitor Telegraf itself. This internal monitoring can be helpful to diagnose any problems that show up with Telegraf, independent of your InfluxDB instance.
This is an example configuration for the input parameters. You can copy this into a file named telegraf.conf that will be the configuration file for all your Telegraf agents.
As you can see, we have the inputs.internal and the inputs.prometheus plugins configured. The internal plugin only has a single configuration option for enabling memory stats, but the Prometheus Input plugin needs some information on how to scrape data from your local InfluxDB instance.
I’ve also added a name override which changes the measurement name from the default “prometheus” to something more useful. Finally, I changed the metrics format to be v2, so that it’s easier to work with in InfluxDB.
That takes care of the inputs, but now we need to configure an output plugin to send data to the InfluxDB Cloud account you just signed up for. Luckily, there’s an easy way to grab that connection information in the InfluxDB Cloud UI.
When you log into your InfluxDB cloud account, and navigate to the Load Data > Telegraf page, and you should see a purple button in the top right corner labeled “InfluxDB Output Plugin”. This provides you with the minimum configuration needed to set up Telegraf to write data into InfluxDB.
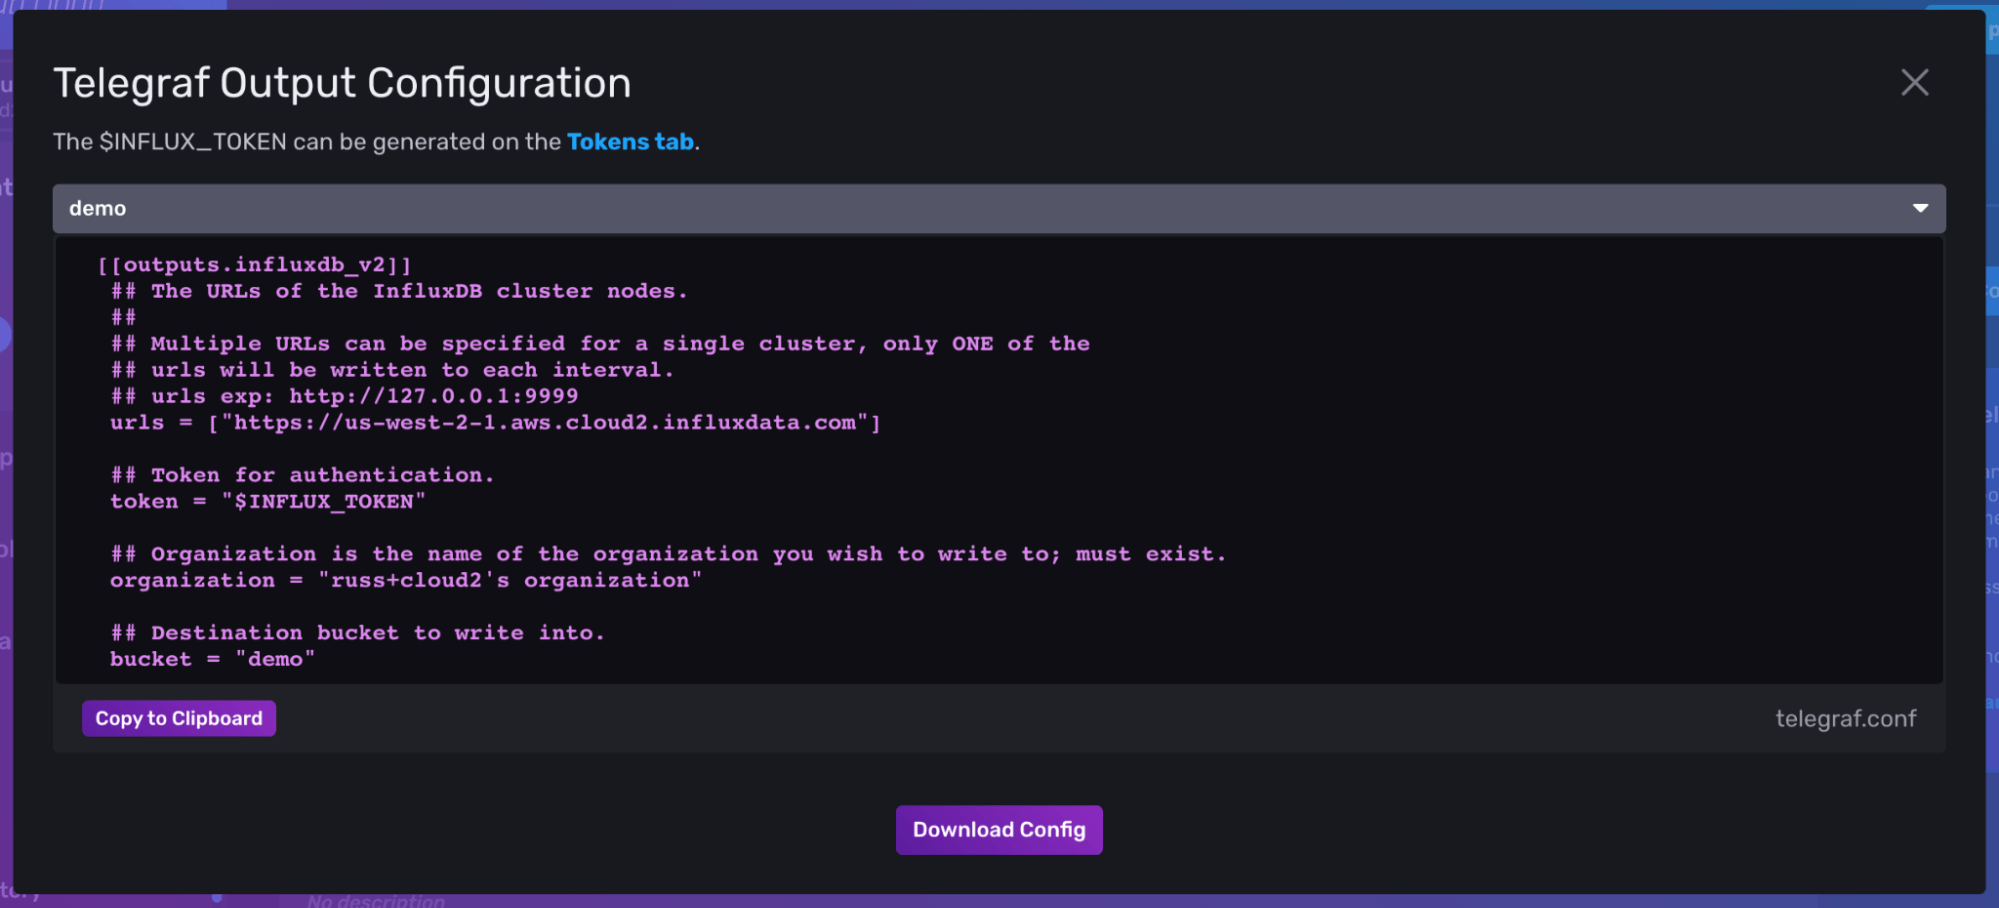
Copy the configuration from your Telegraf page in the InfluxDB Cloud interface, and add it to the end of your telegraf.conf file after the input plugins described earlier.
There are a couple of things to note in this output plugin configuration.
- First, since you are connecting to your InfluxDB Cloud account from another tool, you will need an API Token. You can generate one by quickly heading over to the Tokens tab in the UI and generating a new token. You can choose to create a new "Read/Write" token and give it access to only write data to a single bucket where you want to store your OSS metrics. An All Access token will give the user the ability to access any resource in your InfluxDB Cloud account.
- Finally, you will need to specify a bucket to write the OSS metric data into. This is totally up to you, but I created a new bucket called
oss_metricsso that I could separate this data from my other time series information. Just make sure the token you generated has the permissions to write to this new bucket. You can create up to two buckets in your free account, so choose whatever makes sense to you. The name of that bucket should go into the Telegraf output config.
Your final telegraf config will look something like this:
You can start Telegraf on the same machine where you are running your InfluxDB instance with the command:
telegraf --config /path/to/telegraf.conf
Of course, you can start Telegraf as a service as well,depending on your deployment setup.
Combining the information in InfluxDB Cloud
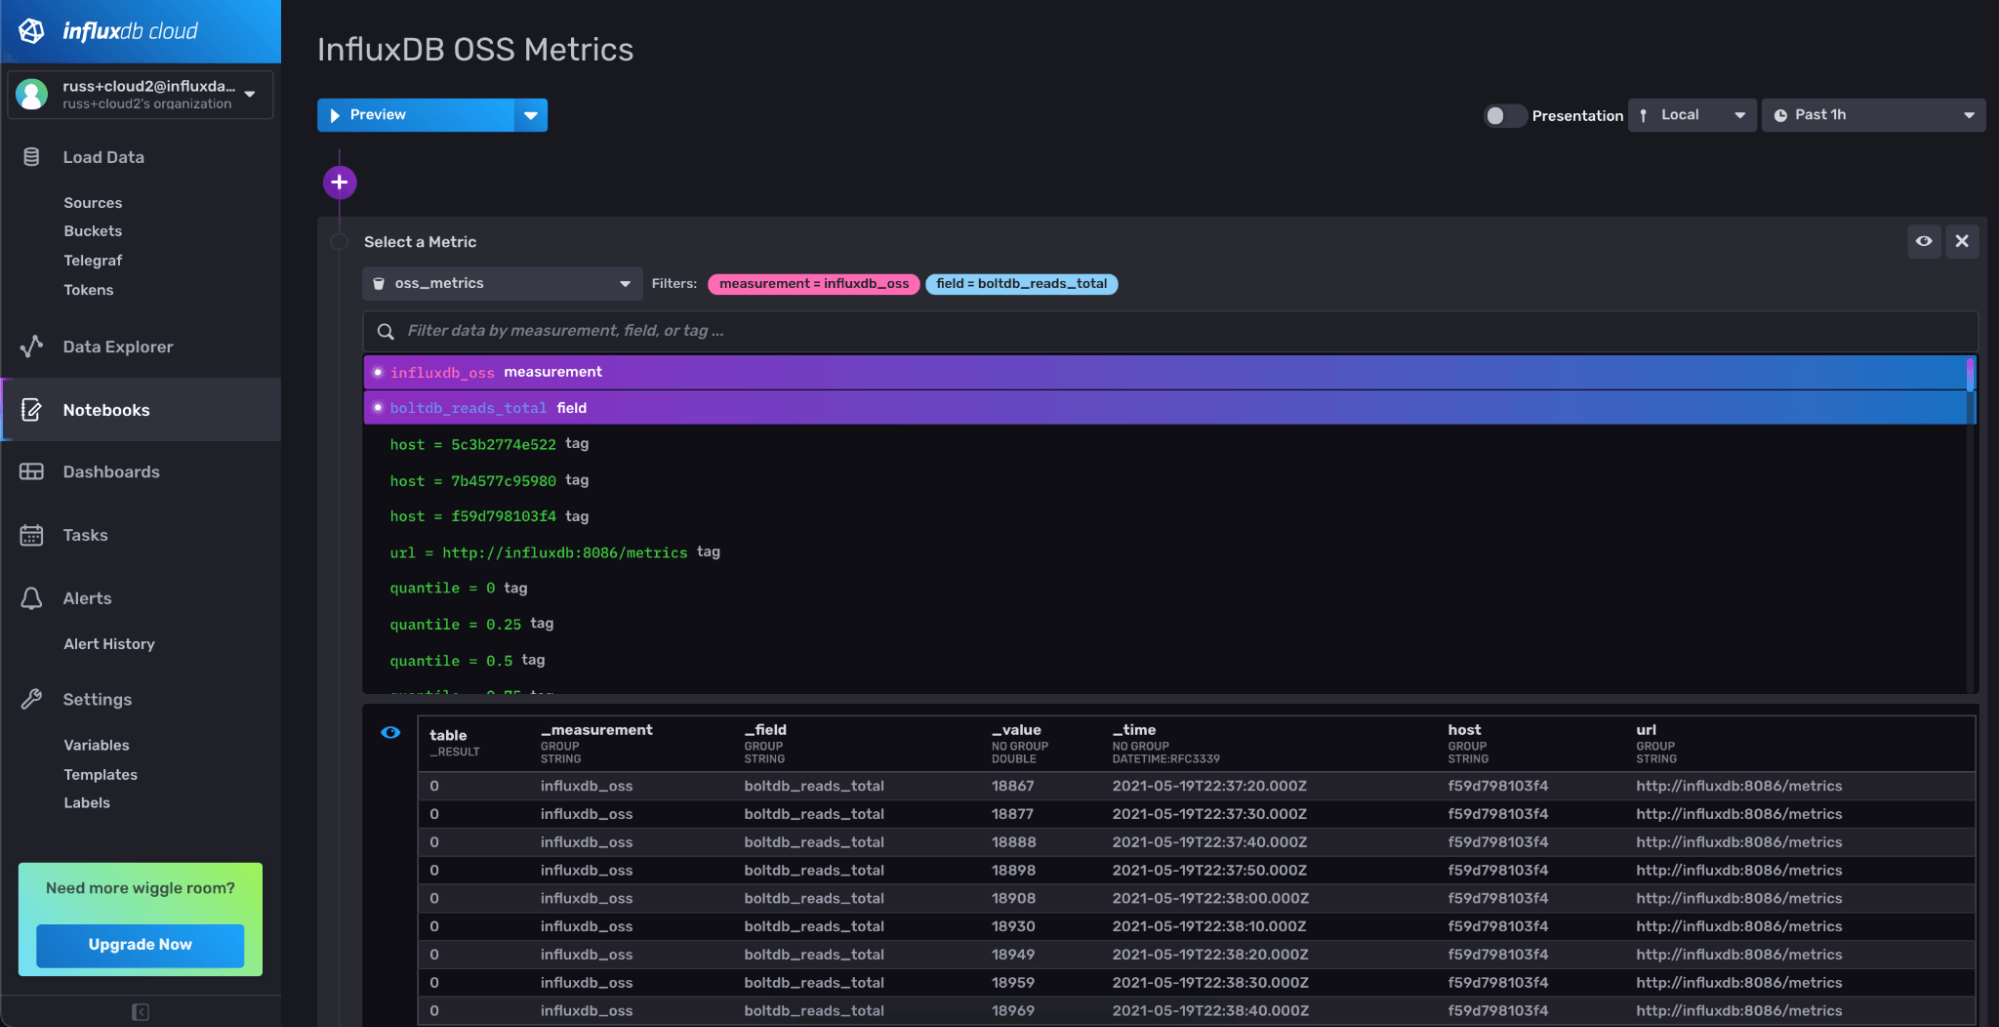
So how do you know if data is actually flowing into your InfluxDB Cloud account? You can quickly verify that by opening up Data Explorer or creating a new Notebook and selecting the bucket and measurement you chose in your Telegraf config (in this case, my bucket is oss_metrics and my measurement is influxdb_oss). If you’re using Notebooks, It should look something like this:
Let’s bring this information together into a dashboard so we can see what each instance is doing on a single page. To do this quickly, I’ve created an InfluxDB Template that contains a dashboard that’s preconfigured for my bucket and measurement. InfluxDB Templates are a great way to share resources across multiple InfluxDB instances (Cloud or OSS). You can install this Template into your InfluxDB Cloud account to create a nice overview for all the hosts reporting data in.
It’s a variation of the existing Open Source InfluxDB 2.0 Monitoring Template with the bucket and host variables removed.
In your InfluxDB Cloud UI, you can navigate to Settings > Templates and enter the raw url there to quickly import this into your InfluxDB Cloud account.

Once you’ve done that, you should have a dashboard that looks something like this:

Now, as you can see, the InfluxDB Template has the bucket name (oss_metrics) and measurement name (influxdb_oss) hard-coded in it. If you used different names, just make a fork of the gist and make those changes to the Template before importing it into your instance.
Of course, this only looks at a few of the many metrics coming into your InfluxDB OSS Instance. Depending on your use case, you can customize this dashboard with any metric that is being reported by your InfluxDB OSS instance.
Adding a Deadman alert
All this is great, but at the start of this blog post, I promised to help you sleep better. To do that, we need to add some monitoring and alerting. InfluxDB Cloud comes with a powerful monitoring and alerting system built in. For a full overview, check out Anais’ comprehensive blog post on the subject.
Let’s add a check for when data stops showing up from our InfluxDB OSS instances. This is known as a deadman check. All we need to do is navigate over to the Alerts section of the UI, and add a new Deadman check.

For your Deadman query, you can choose any field that is being reported from your InfluxDB OSS instances, such as influxdb_info. If this data stops showing up, you know you have a problem that you might need to check on.
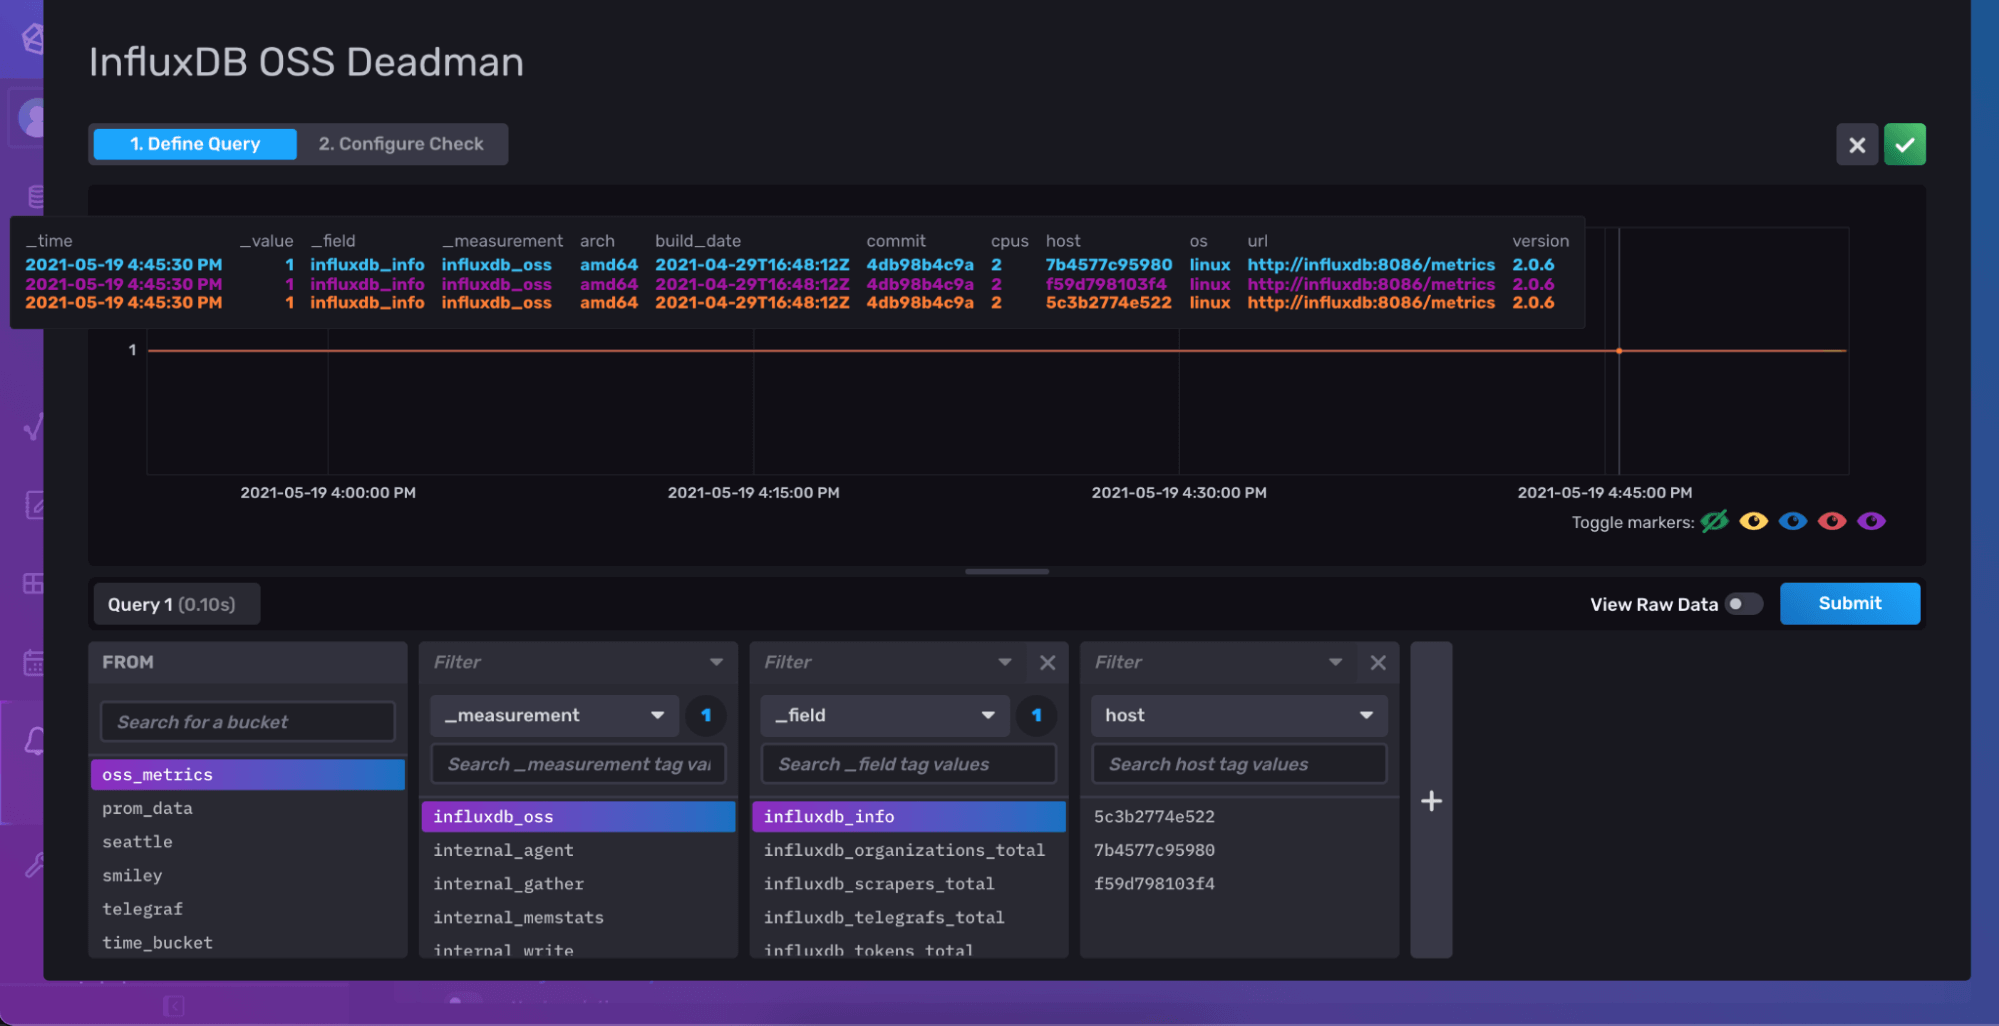
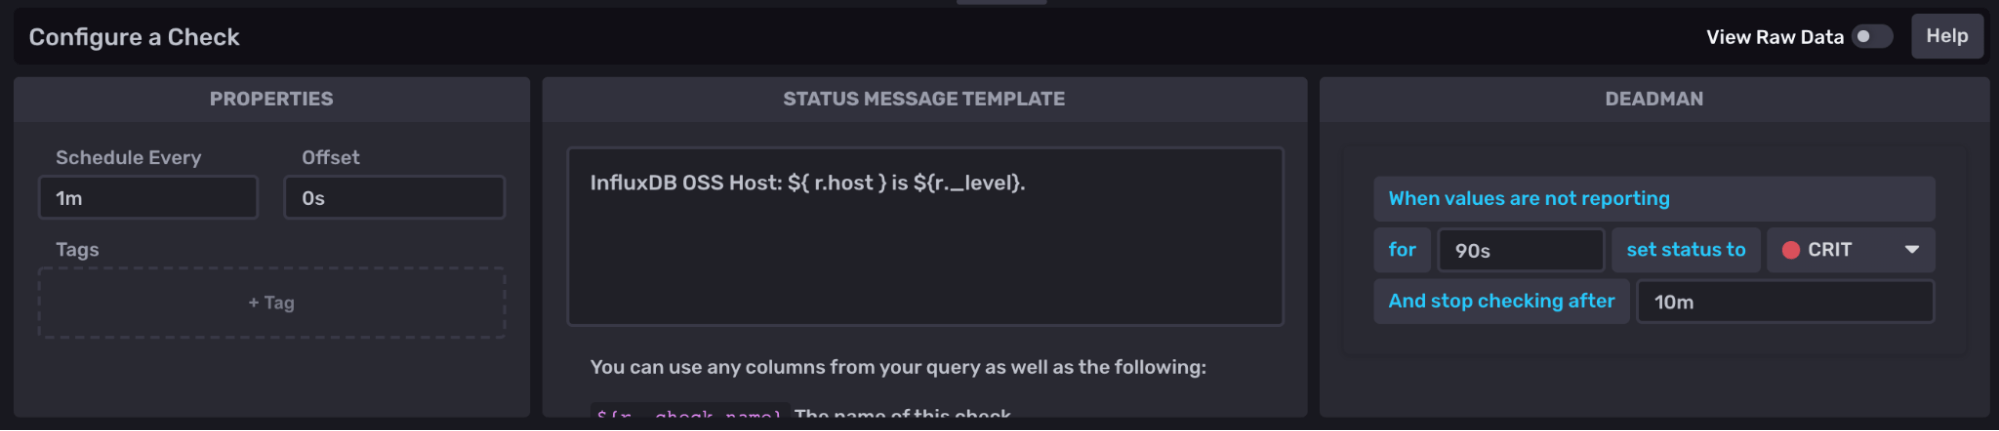
Finally, you can set how often you’d like to check for data (Schedule Every), and the amount of time to wait before switching to a critical alert. These options depend on the frequency at which you need to be notified and how often you are scraping data from your instance with Telegraf. You can always adjust it later if you need to. Checking every minute and going to CRIT after 90 seconds sounded good to me.
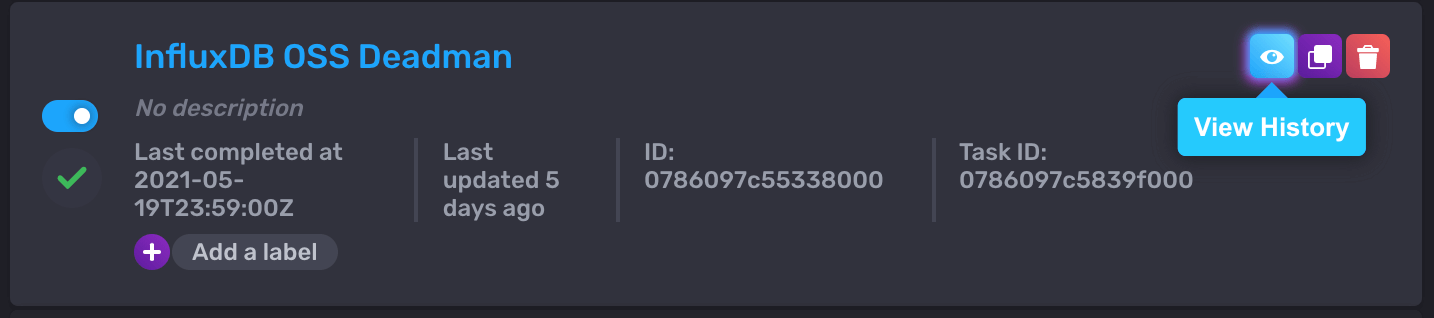
Once you’re satisfied, you can save that Check, and click on the View History option of the Check to verify it is running. After a minute, you should see some statuses show up on that page.
Getting notified
The Check will monitor your data and write Statuses such as ok or crit to the _monitoring bucket in your InfluxDB Cloud account, but you will need to configure a Notification rule in order to make sure that information gets to you. In your free account, you can configure a Notification to send to Slack. If you need to send to PagerDuty, just upgrade to one of the pay-as-you-go accounts.
To add a notification to Slack, all you need is a Slack Webhook url, and you can create a new Notification Endpoint to send data to it. Finally, you can configure a new Notification Rule to check for crit statuses and send a message to that endpoint.

When you set up the Notification Rule, be sure to select a notification frequency that makes sense for your check. For example, if your check is running every minute, make sure your notification rule runs every minute as well, with an offset to account for the amount of time it takes the check to run (which shouldn’t be longer than 10s).
Once you have everything configured, you can test it out by simply stopping one of the Telegraf agents and look for the notification in Slack.
Of course, you can set up more complex checks to look for things like high-memory usage or increased query counts. You can also configure them to monitor for things like new tokens being generated or new users being added.
The benefit of defining the Notification Rule separately is that you only need to define it once, and you can add as many checks as you need.
Conclusion
With this post, we walked through the process of configuring Telegraf as a sidecar for your InfluxDB OSS instance so that you can collect all the monitoring information into a single place and keep an eye on things. There are a ton of enhancements you could add to this as you start to grow your usage of InfluxDB and understand the metrics that are important to you.
InfluxDB Cloud has a ton of capability even for users who can’t store their data in the cloud. The ability to quickly monitor your InfluxDB OSS instances with InfluxDB Cloud provides an easy way to add monitoring to your on-prem deployments and gives you the ability to monitor everything in a single location.
If you have comments or questions about setting this up, please jump over to our community Slack channel and ask our team. We love hearing from our users and improving as we go.
