How to Monitor Your Internet Speed with Telegraf & InfluxDB Cloud
By
Samantha Wang
updated December 14, 2025
Use Cases
Product
Developer
Navigate to:
Complaining about your crappy internet speed is a tale as old as time. Given the rapid shift for so many of us to work from home, our internet speed now affects us on a daily basis. Where in my house should I avoid taking Zoom meetings because of low download speed? Does my internet speed actually get worse in the evenings, or am I just paranoid? How far away from the microwave do I really need to be to ensure that my wifi isn’t impacted? Being able to monitor internet speed can help you answer these questions and troubleshoot your technology-driven life.
In Telegraf 1.20, we released a new internet speed monitoring plugin to collect your download, upload, and latency statistics. In this blog post, you’ll learn how you can quickly set up Telegraf and get your data pumping into InfluxDB Cloud to start getting a better understanding of your internet speed.
Before you get started, make sure you’re signed up for InfluxDB Cloud and download Telegraf.
How the Internet Speed Plugin works
The Internet Speed Plugin makes use of Speedtest by Ookla. The service offers the ability to test a user’s internet speed and quality through a distributed set of 1000s of partner servers worldwide. The test will locate the closest nearby servers to find the best possible latency. Then download and upload a file from the selected server to capture a user’s internet connection speed.
Create a Telegraf configuration
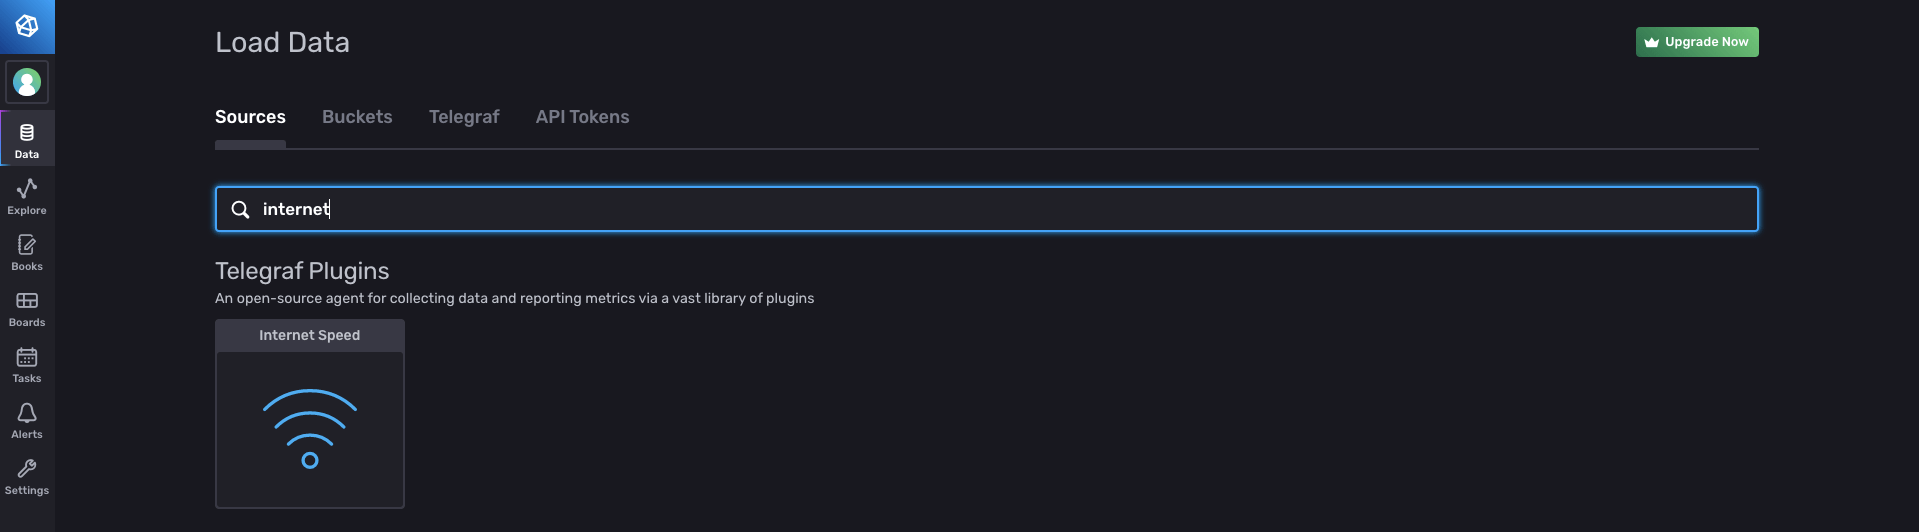
- In InfluxDB Cloud, navigate to the Data > Sources tab.
- Select "Internet Speed" under the list of Telegraf Plugins.
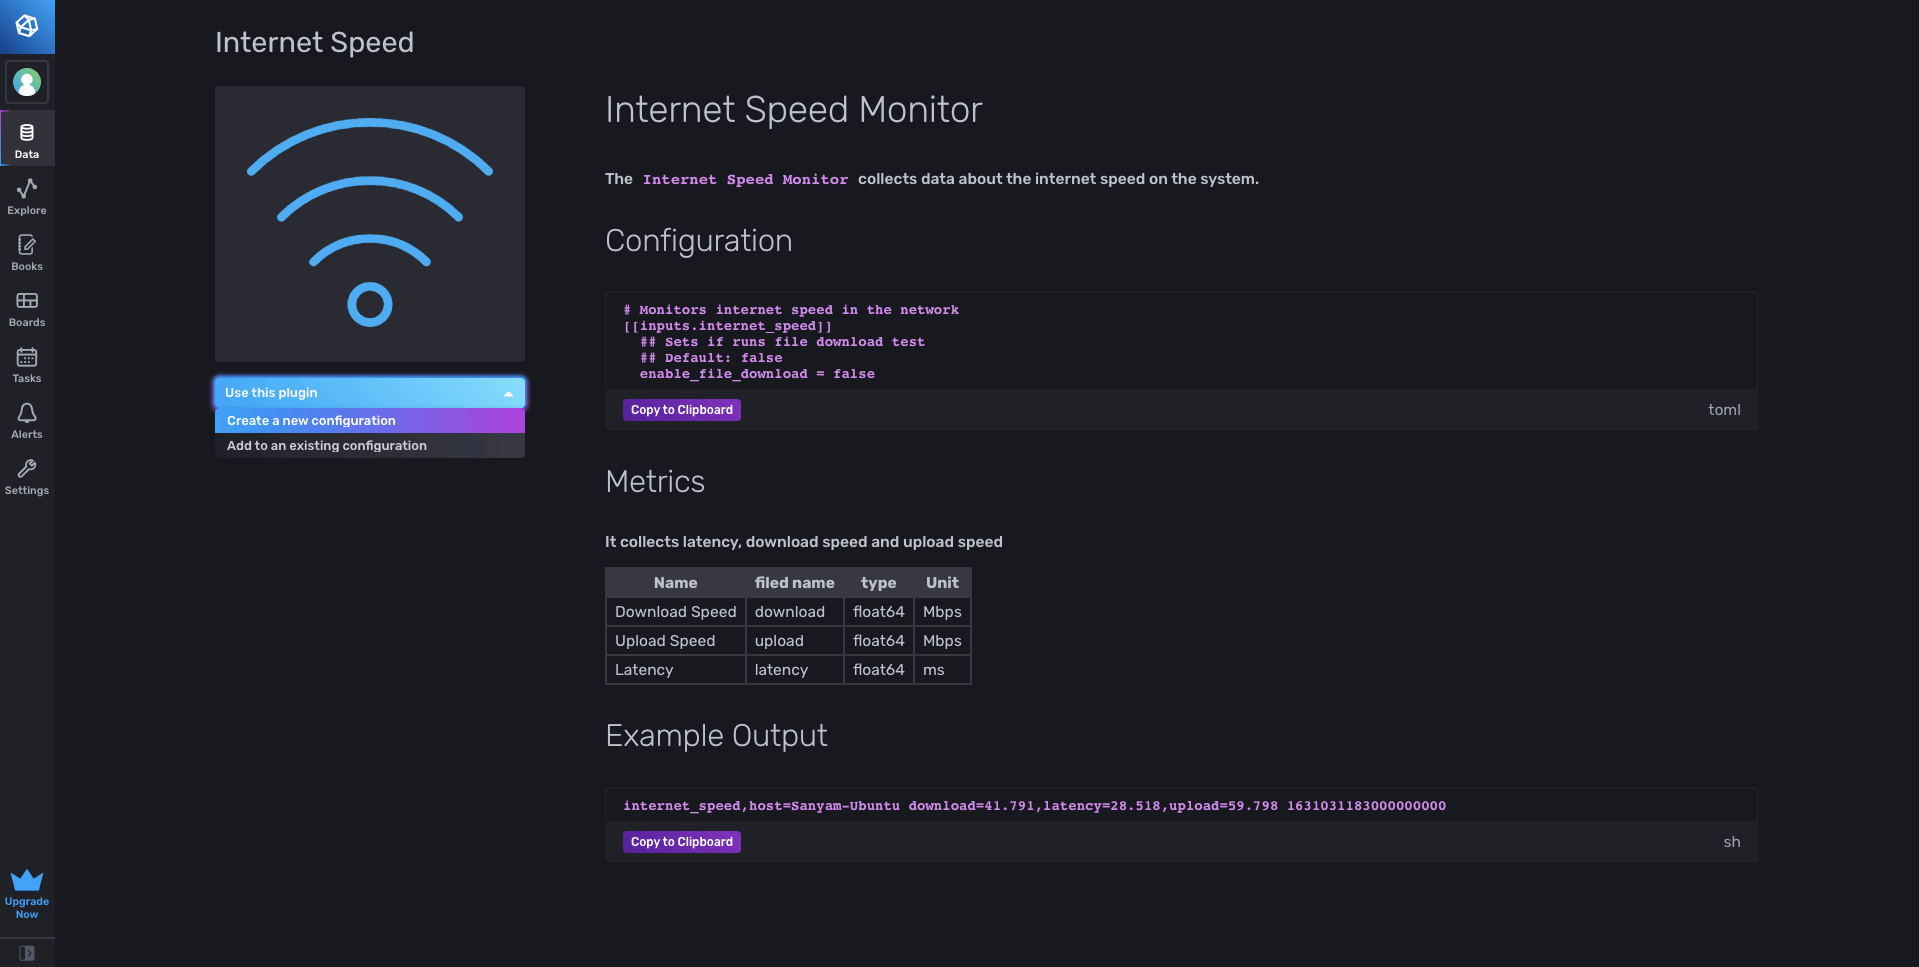
- The plugin page displays information about the Internet Speed input plugin. Select the Use this plugin dropdown to add this plugin to a new or existing Telegraf configuration.
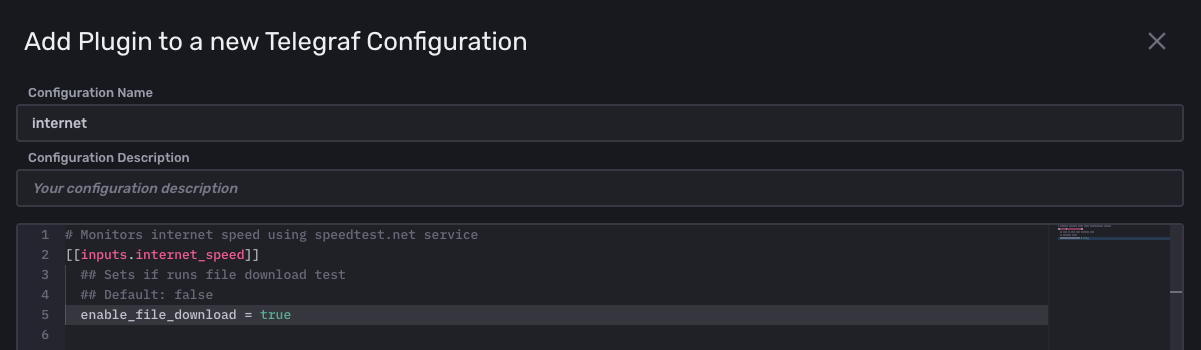
- From there, name your Telegraf configuration and select the bucket you want to send your internet speed data to.
Once completed, you’ll be taken to edit the plugin configuration. Luckily, the Internet Speed Plugin is pretty simple and does not require much configuration.
Optional: If you want, you can set enable_file_download = true and this will set some configuration variables in the speedtest-go library which determines what size of file to download and how many downloads to run. If it is set to false, the speedtest-go library will determine the configuration values based on your latency.
Once the input plugin configuration is completed, you can save and run through the setup instructions of running your Telegraf configuration. The beauty of Telegraf is that once it’s started, Telegraf will continue collecting your internet speed metrics and you can spend more time analyzing and understanding your internet performance.
View and analyze your internet speed
Now that you have your data in, you can view your data, analyze trends of your speed, or set an alert when your speed is slowing down all using the InfluxDB Cloud platform.
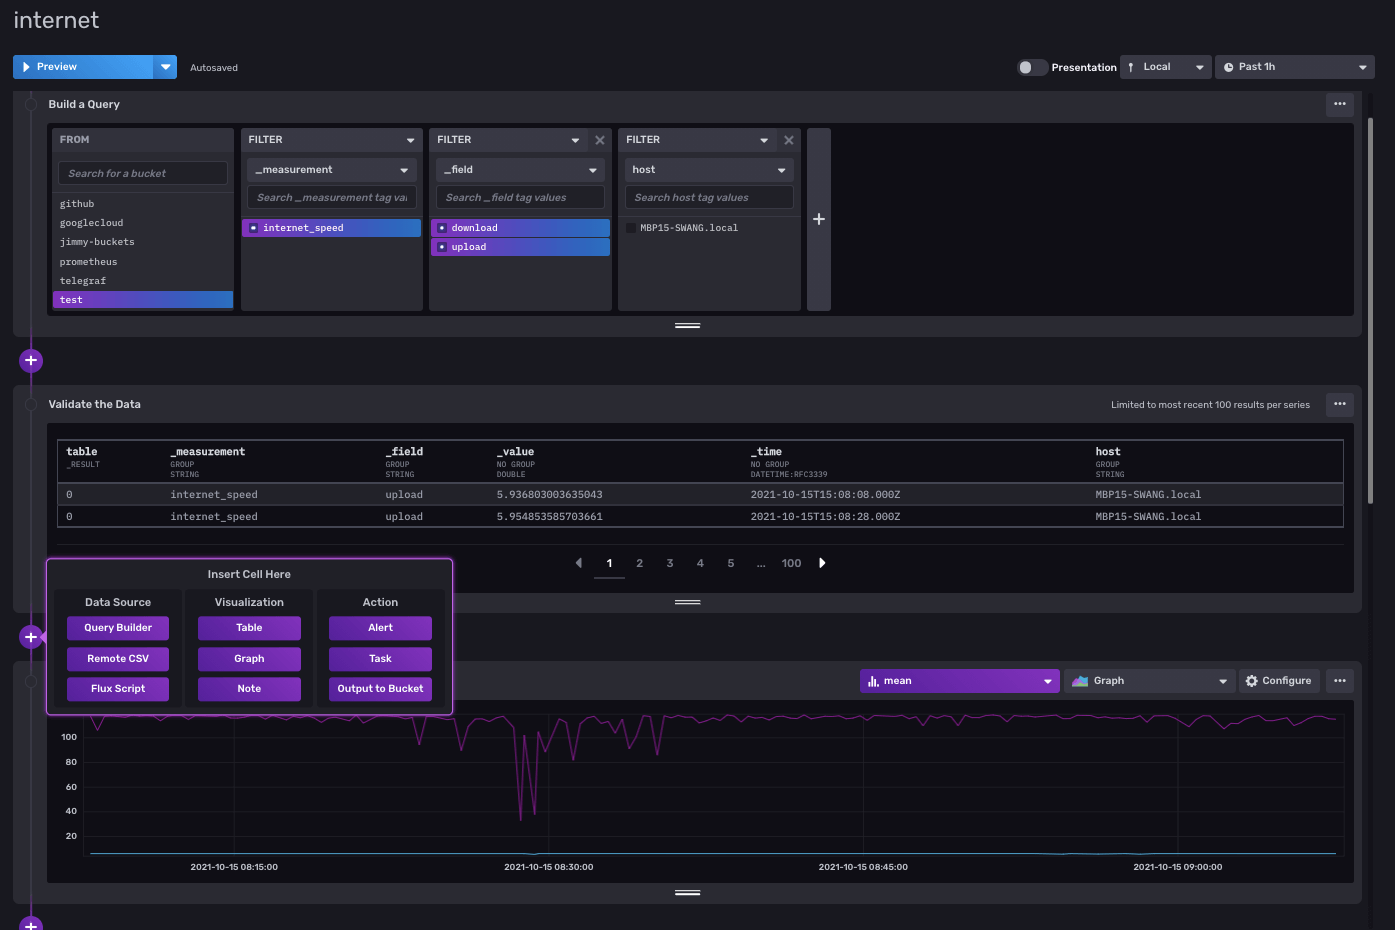
Query your data in Notebooks
Notebooks are a great tool to quickly enrich your raw internet speed data. You can easily select and view your data with the query builder and visualization cells. Notebooks also include cells and controls that transform the data in your InfluxDB Cloud bucket.
Create dashboards and annotations
You may be looking to set up some visualizations to view the trends of your internet speed. It’s really easy to create a dashboard to view graphs on how your internet speed varies throughout the day.
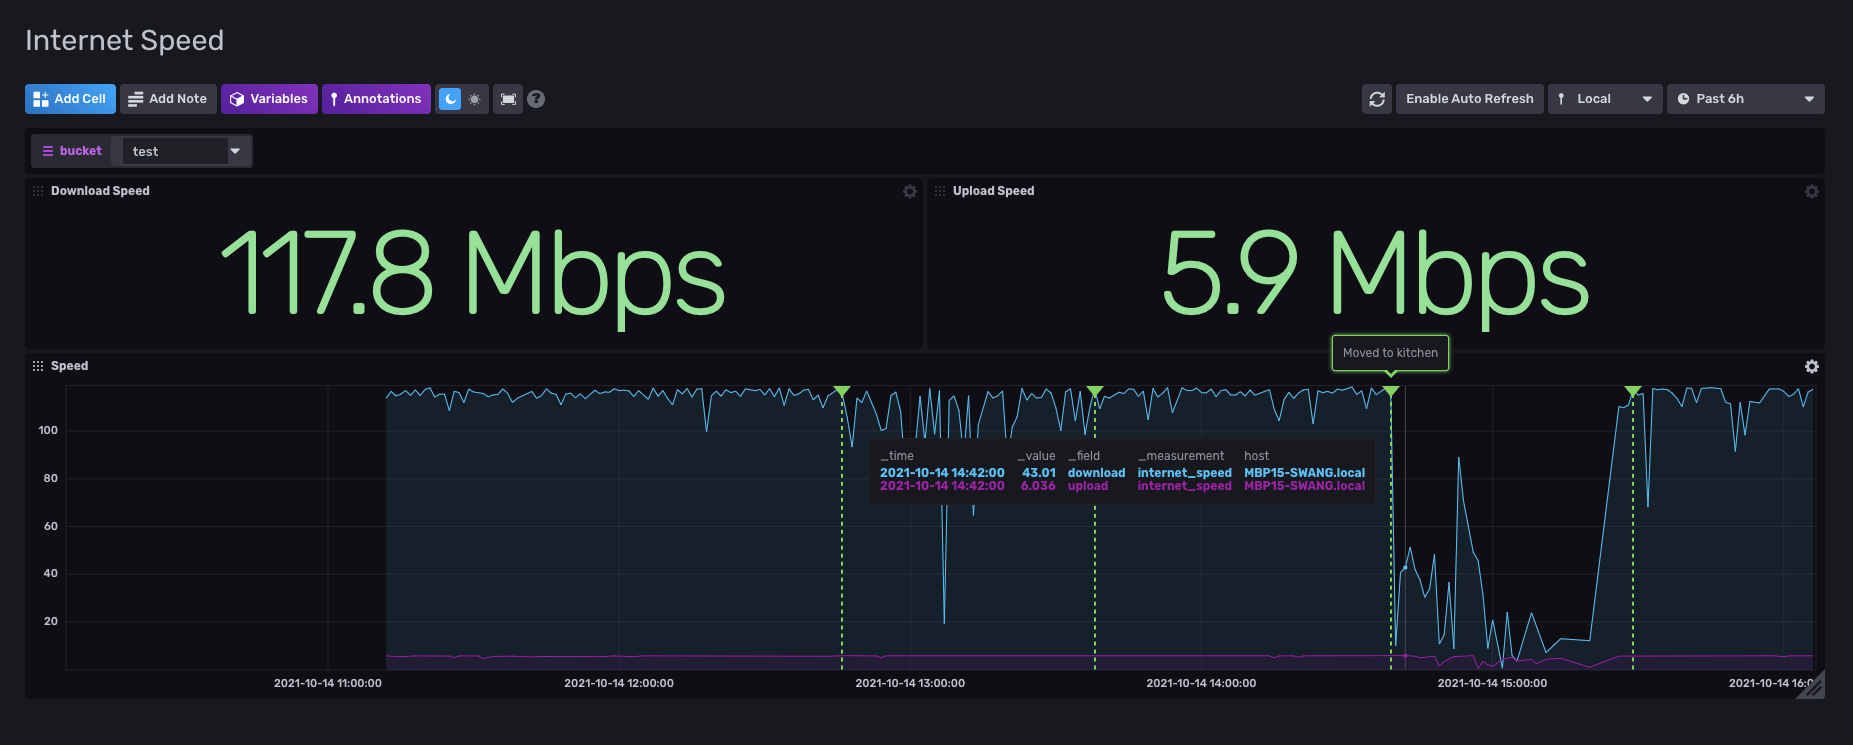
The annotations feature allows you to add information about a single point in time. In my example above, I had a big drop in my internet speed at 14:40 when I moved to the kitchen. Annotations are most often used to add information around anomalies in your data, but feel free to use them for any trend changes in your data.
Act on your data
Set alerts if your internet is reaching certain thresholds
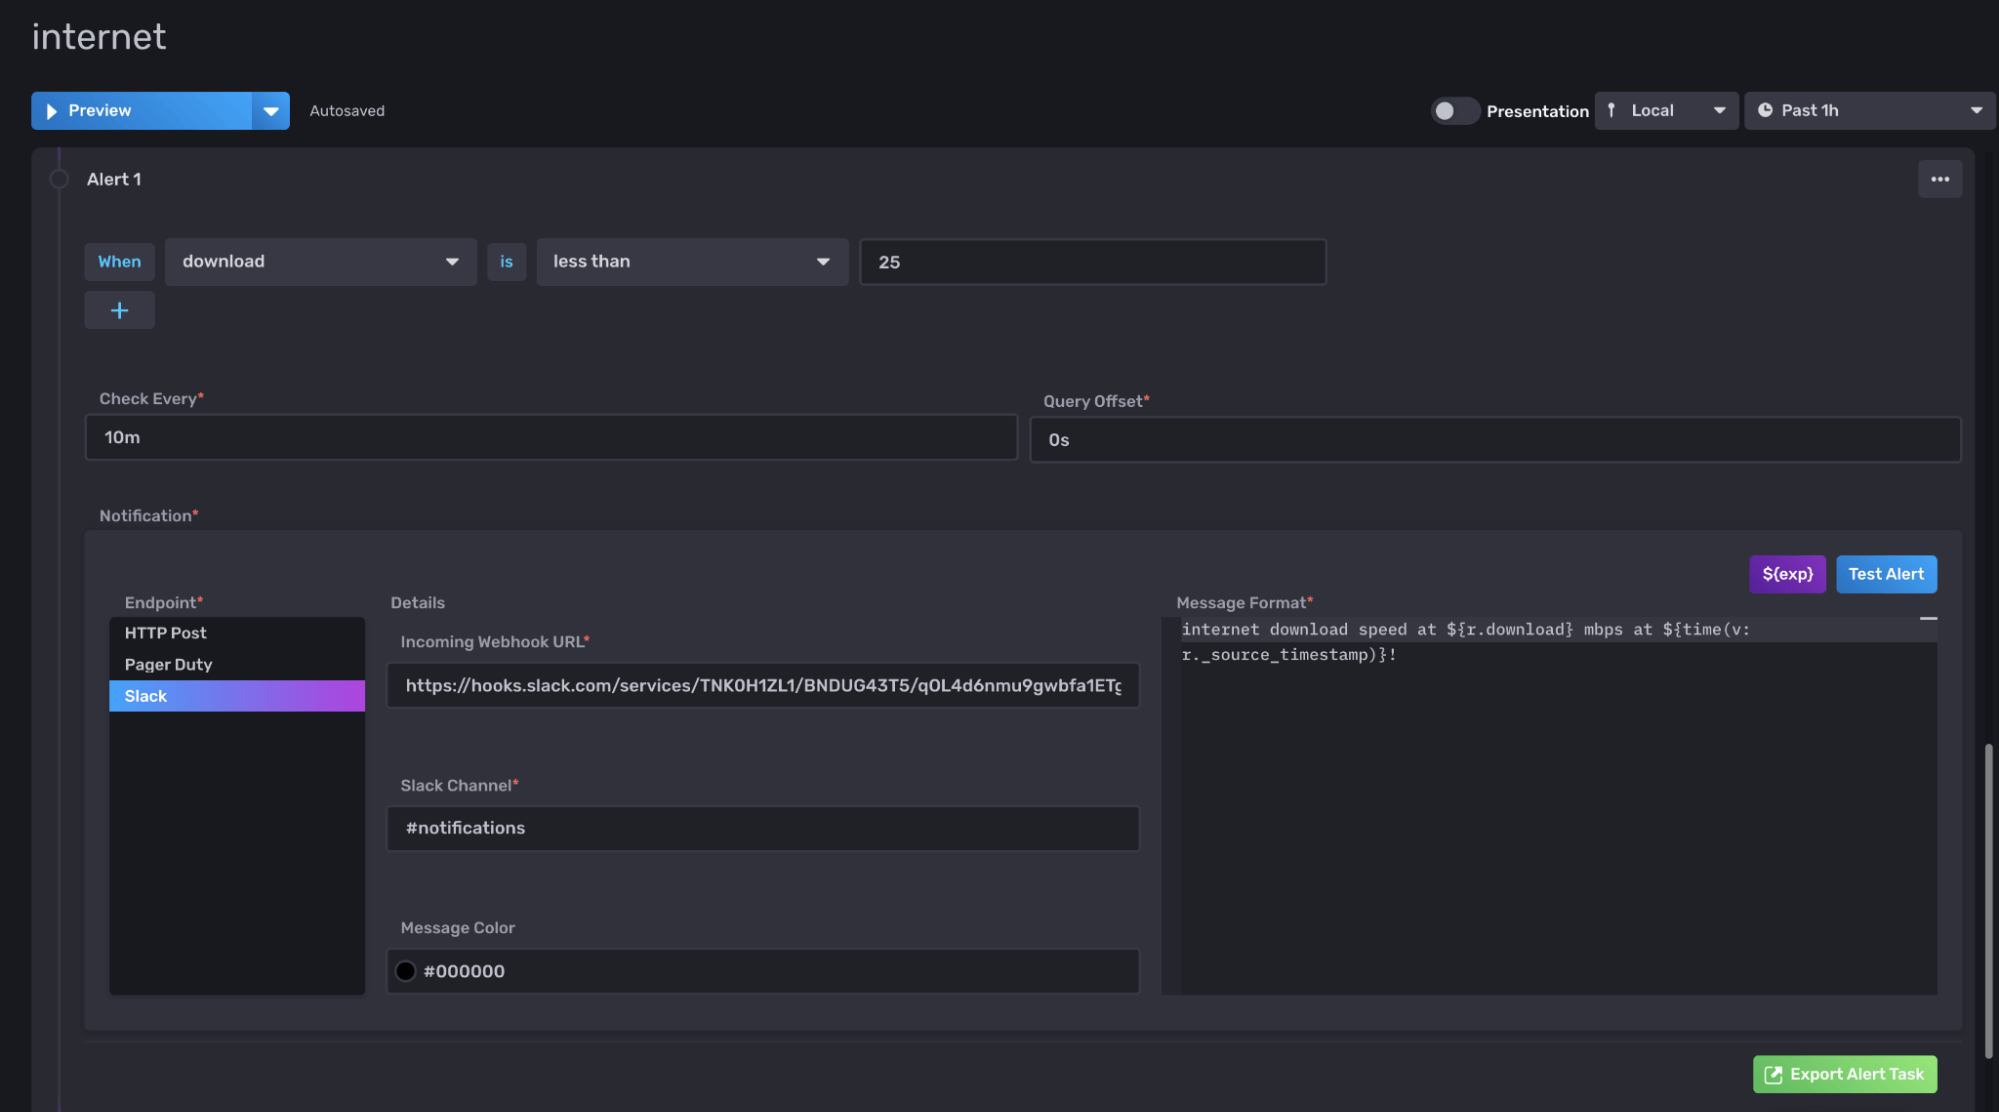
InfluxDB platform allows you to set up alerts & notifications to be notified about certain behaviors of your data. You can set these alerts directly in Notebooks to easily manage your notification rules and endpoints. In my alert, I have a message being sent to my Slack endpoint every time my download speed dips below 25 Mbps.
Import all of this with InfluxDB Templates
If you want to easily import these internet speed Telegraf configurations and dashboards you can do it in a quick upload with InfluxDB Templates!
- Go to Settings > Templates and upload this
.yamlfile for the Internet Speed Monitoring template.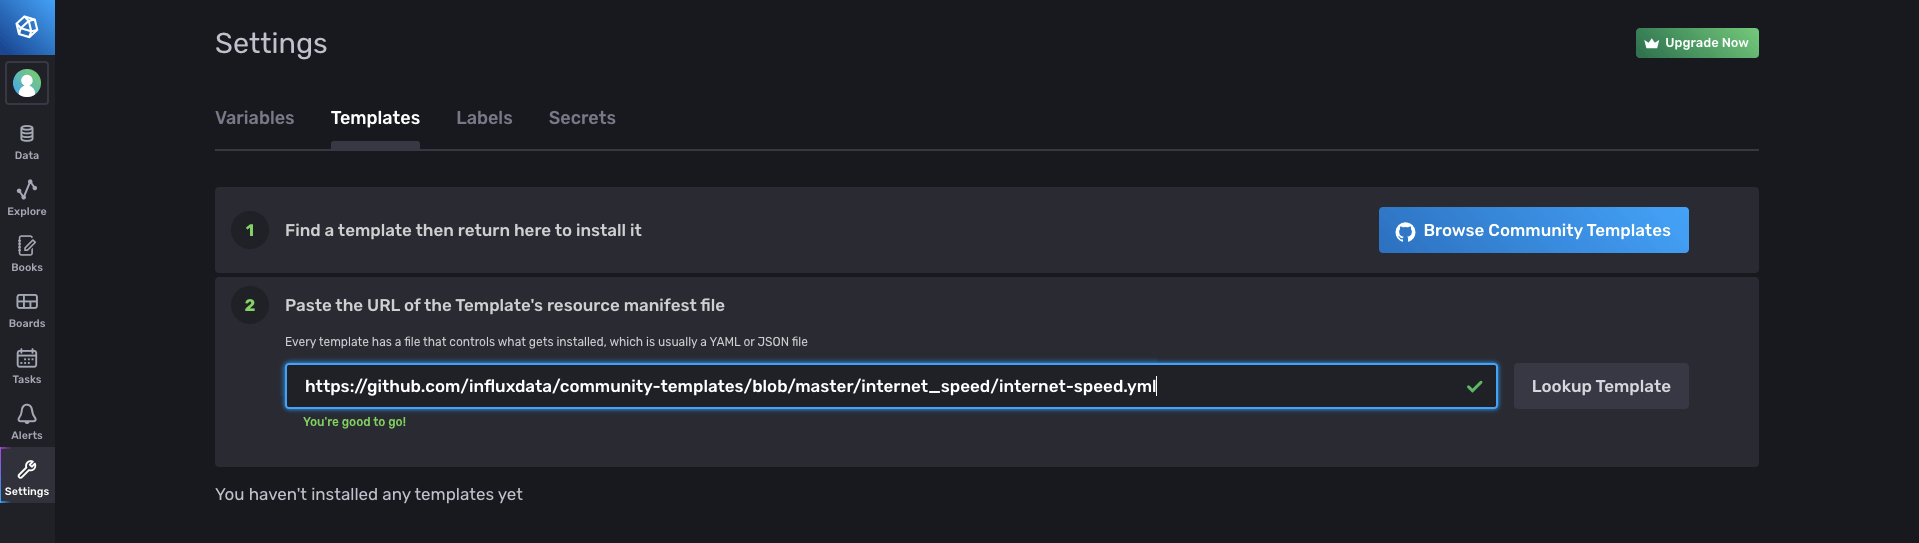
- The
.yamlfile will upload all the resources you'll need for the Internet Speed Monitoring Template.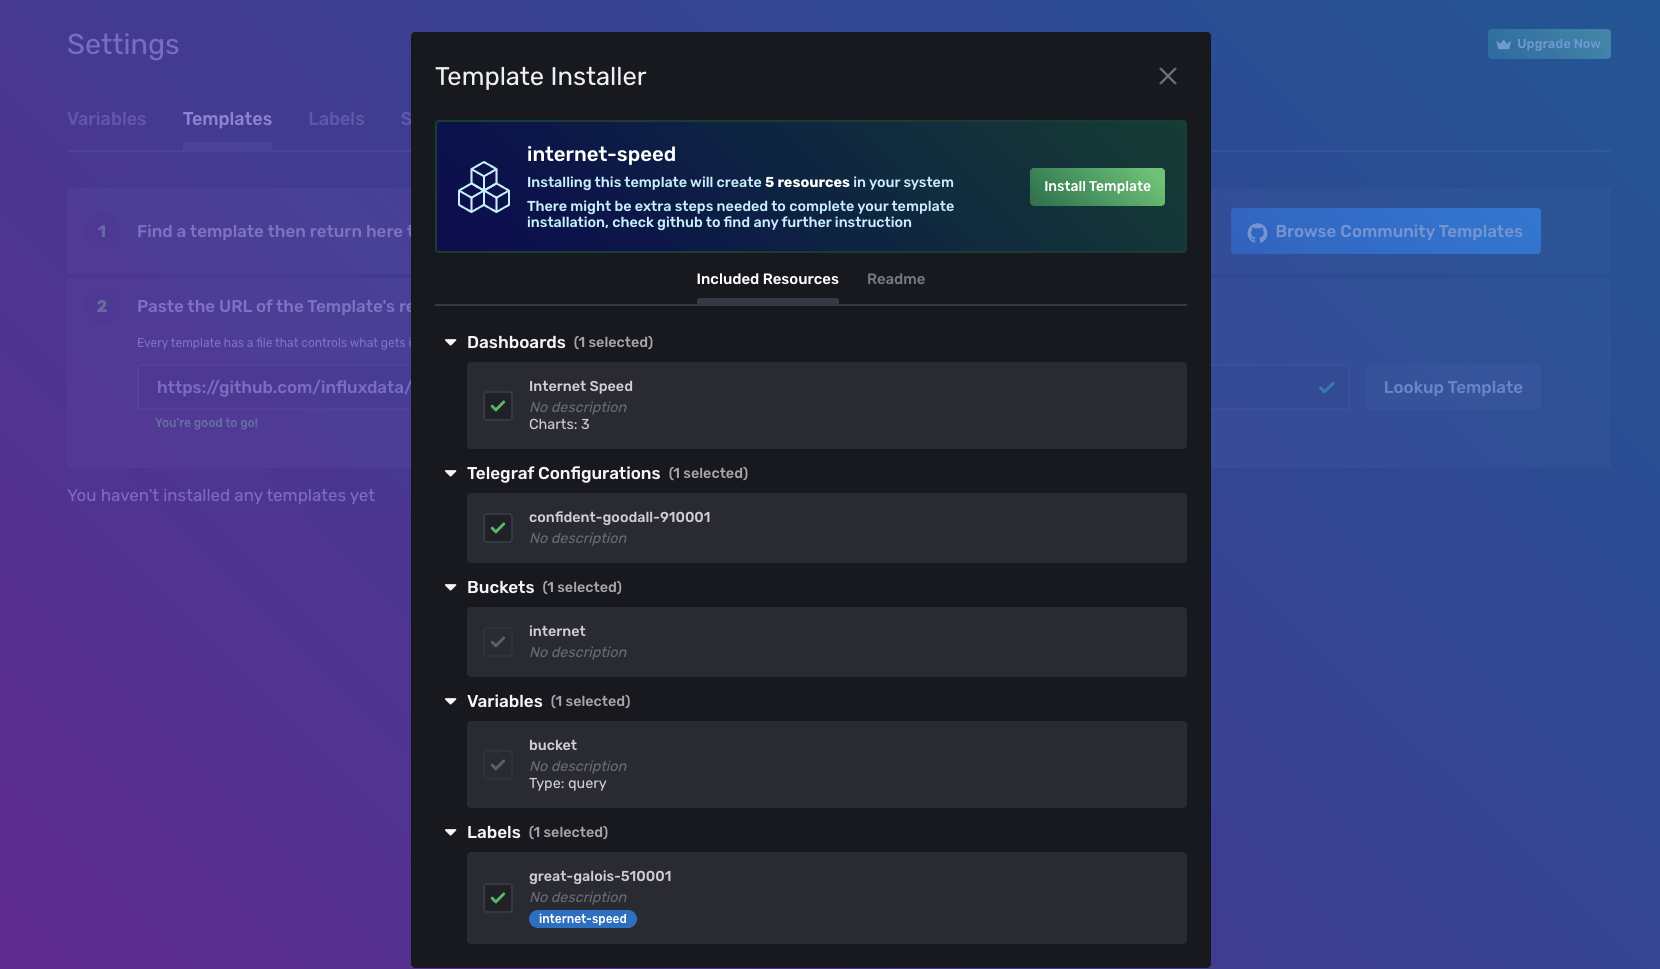
- Once the template is imported, there are some environment variables you'll need to configure per the template README, but you now have everything you need to start keeping an eye on those data speeds ????.
Get started!
Let us know how you’re using InfluxDB Cloud to monitor your internet speed. Whether it’s your computer at work or a home IoT project. Show off what you’re working on in the InfluxData Slack #showme channel. If you have any questions about Telegraf (#telegraf channel) or InfluxDB Cloud (#influxdb), we have a great team of Influxers and community members to help you out. Happy monitoring!
