How WideOpenWest Monitors DOCSIS Devices with InfluxDB, Kafka, and Grafana

With over 500,000 residential, business, and wholesale customers across multiple markets in the United States, WideOpenWest (WOW!) is one of the United States’ largest broadband providers. They aim to connect homes and businesses to the world with fast and reliable internet, TV, and phone services.
 REGION
North America
 INDUSTRY
Communication
Start building with InfluxDB
Start exploring InfluxDB and bring high-performance time series analytics to your applications.
Try InfluxDBOverview
Building a single source of truth for monitoring and observability
WOW! modernized their monitoring and observability platforms to better suit their growing business. Because of the diversity in their distributed field equipment, WOW!’s legacy solution included multiple monitoring platforms. The modernization involved migrating their multi-platform legacy solution into one centralized time series database, InfluxDB. By adding InfluxDB, WOW! now has a single source of truth when it comes to monitoring and observability. WOW! engineers found the addition of InfluxDB to be so successful that they no longer need any other paid services in their tech stack. They will continue migrating off their remaining monitoring-related subscription services until they are at zero dollars spent.
Challenge
Growth via M&A created a large, fragmented network
WOW!, as a company, is constantly evolving. WOW! acquired three telecommunications companies over the past two decades. These acquisitions meant expansion into new markets, the introduction of new customers, and mandatory integration with existing technologies. WOW!’s network consists of both brownfield and greenfield builds. Brownfield builds are hybrid coaxial cable/fiber-optic internet networks, and greenfield builds are all-fiber networks.
As a data-driven organization, WOW!’s support engineering team wanted the ability to detect network outages from network nodes (devices) before customers noticed any service interruptions. But this goal faced several challenges. WOW!’s network had, at one time, 800,000 nodes from an assortment of vendors, all coming with their own restrictions and requirements. Buying uniform technology was cost prohibitive.
WOW! needed to find a way to work around their existing challenges. They couldn’t change the nodes, but they required a real-time monitoring and observability platform for their telemetry data. For this, they turned to InfluxDB.
Technical Challenge
Monitoring hundreds of thousands of DOCSIS devices in real-time
The WOW! engineers needed to better understand the overall health of each node and network. The engineers hypothesized that a centralized datastore with real-time and historical analytic viewing capabilities would provide more visibility into these areas. The time series telemetry data WOW! engineers use to determine overall health includes usage, uptime, average signal, port, power levels, signal-to-noise ratio (SNR), and modulation error ratio (MNR).
Many roadblocks prevented WOW! engineers from building their ideal monitoring solution. The largest challenge they faced stemmed from the devices themselves. Each node was a single Data Over Cable Service Interface Specification (DOCSIS) device. WOW! either bought or acquired the DOCSIS devices over decades. This means that the devices WOW! engineers monitor consist of different models, made by different vendors, all with their own set of specifications.
Up to this point, the various data collection and monitoring restrictions and requirements led to disconnected platforms. These platforms, like the devices themselves, entered WOW! engineers’ purview in one of two ways. When WOW! acquired nodes, if those nodes had a monitoring system, WOW! engineers added it to their system. If acquired nodes didn’t have a monitoring solution, WOW! engineers built one. The many platforms shared a time series database backend. The time series database was operational but failed frequently.
By 2020, WOW! engineers were ready to put their multiple monitoring platforms and failing time series database behind them. Time series benchmark testing introduced the engineers to InfluxDB. Though the engineers originally considered Timescale, the benchmark testing revealed InfluxDB’s write speeds were orders of magnitude faster than Timescale’s write speeds. WOW! engineers selected InfluxDB as their new time series database backend to improve the overall observability of their network and implement better alerting.
I was blown away with how easy it was to install and configure InfluxDB. The clustering was easy. The documentation was great, and the support has been second to none.
Engineer III, Software & Product Integration Engineering at WOW!
Solution
InfluxDB centralized WOW!’s telemetry data for real-time monitoring, alerting, and historical analysis
WOW! engineers chose InfluxDB Enterprise as their new time series database. InfluxDB gave WOW! engineers something no other vendors or monitoring solutions could – the flexibility to work around their various device restrictions to create a single monitoring platform.
Architecture
Modernizing Network Observability for a Growing MSO
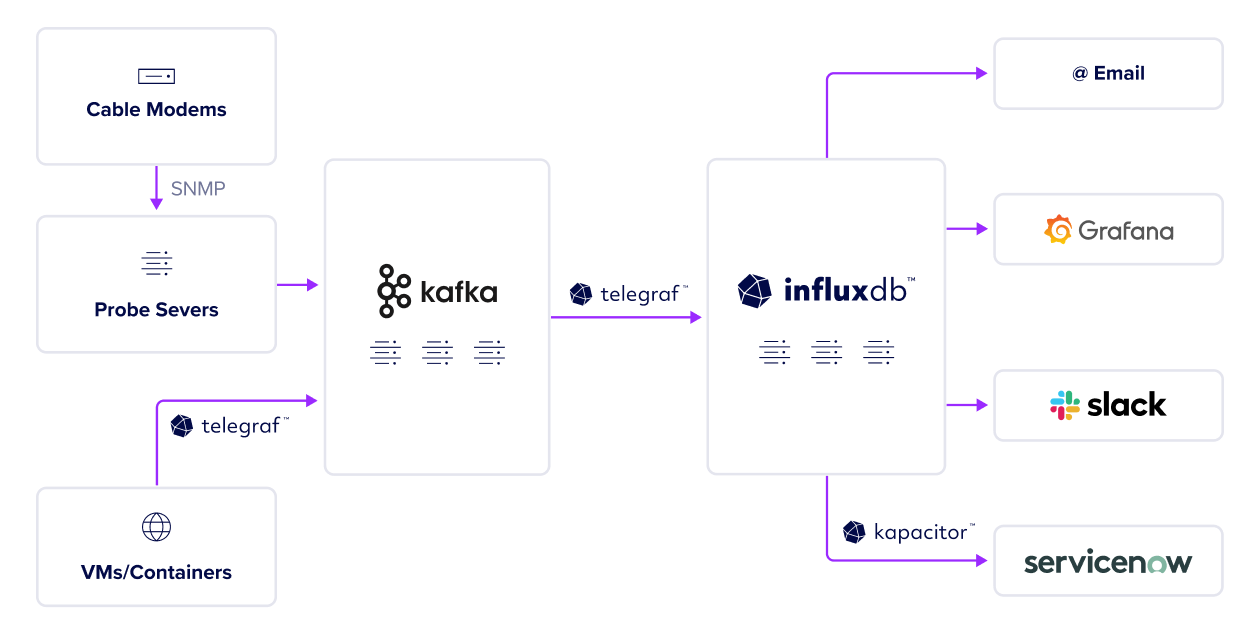
WOW! engineers implemented several data collection practices to gather the massive amount of data from their nodes. They use Simple Network Management Protocol (SNMP) polling and traps to collect data from cable modems. They poll roughly 650,000 cable modems in five-minute cycles. The engineers also rely on open source Telegraf for data collection whenever possible. Telegraf easily integrates with many systems because it’s plugin-based and has over 400 plugins. WOW! engineers primarily collect data from virtual machines (VMs) and containers using Telegraf. Some containers and VMs have legacy hardware that still requires the use of Filebeats, custom scripts, and vendor APIs for data collection.
WOW! engineers built a Kafka cluster between the devices/data collection and InfluxDB. The Kafka cluster provides the engineers better control over data input/output. Kafka allows WOW! engineers to consume or move data to different regions or systems if necessary. Kafka also provides an additional layer of redundancy. Telegraf sends data from Kafka to InfluxDB.
WOW!’s monitoring platform consists of a four-node cluster in production and a two-node cluster running on OpenStack for testing. WOW! engineers use InfluxDB to derive insight from real-time analytics, create visualizations, and trigger alerts for the troubleshooting process. WOW! engineers leverage InfluxDB’s alerting frameworks to send alerts via Slack, email, and ServiceNow, their automatic ticketing platform.
WOW! engineers use Grafana to create customized dashboards. The engineers use Ansible to automate cluster setup and installation. Adopting InfluxDB allowed the WOW! team to implement an infrastructure-as-code system. Now WOW! engineers write config files that simplify processes rather than spending time manually managing their infrastructure.
Result
Real-time network visibility and historical trend analysis across their heterogeneous environment
After completing the monitoring platform modernization with InfluxDB, WOW! engineers have access to real-time, easily readable, and customizable dashboards. These dashboards include both real-time data and historical trend analysis. WOW! engineers expose the real-time data for their operations team. This helps the operations team identify outages and begin troubleshooting faster. These dashboards help WOW! work toward their original goal of identifying service degradations before they impact customers.
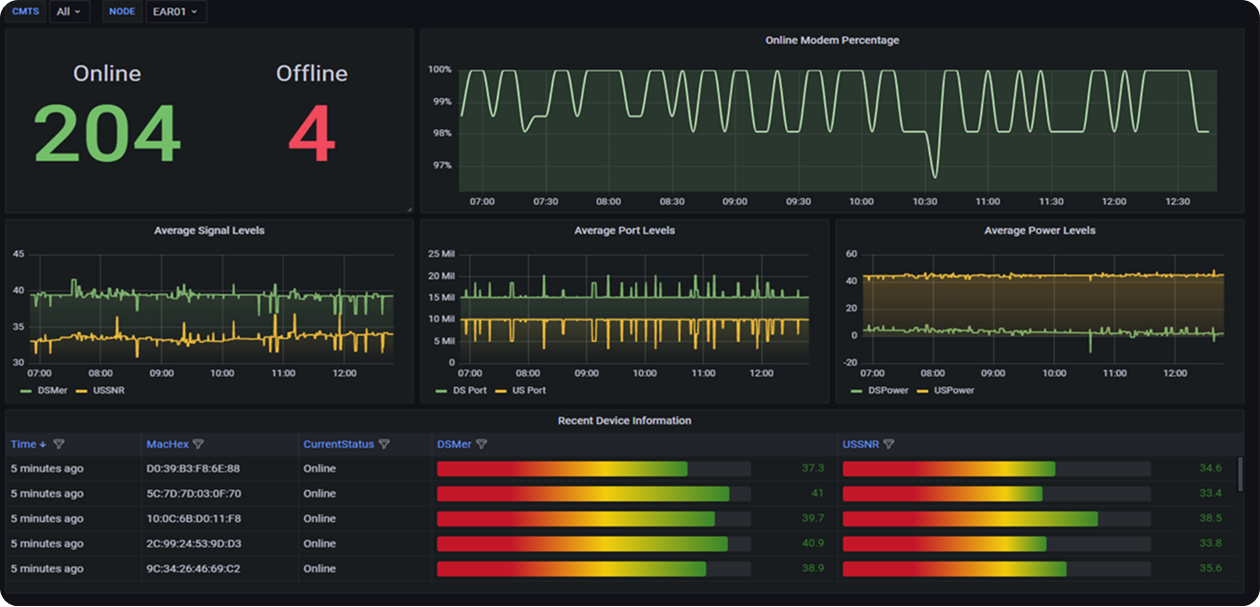
The Node Health Dashboard (shown in the image above) is a real-time reporting Grafana dashboard that illustrates the health of each modem. It includes modem online percentage history, signal, port, and power levels, and the modem’s overall health. This information is essential to the operations team and is now in a centralized location, collected in five-minute polling cycles. When an event happens, such as a node outage or higher-than-normal signal noise, InfluxDB’s alerting framework triggers an alert and WOW! service engineers can take appropriate action.
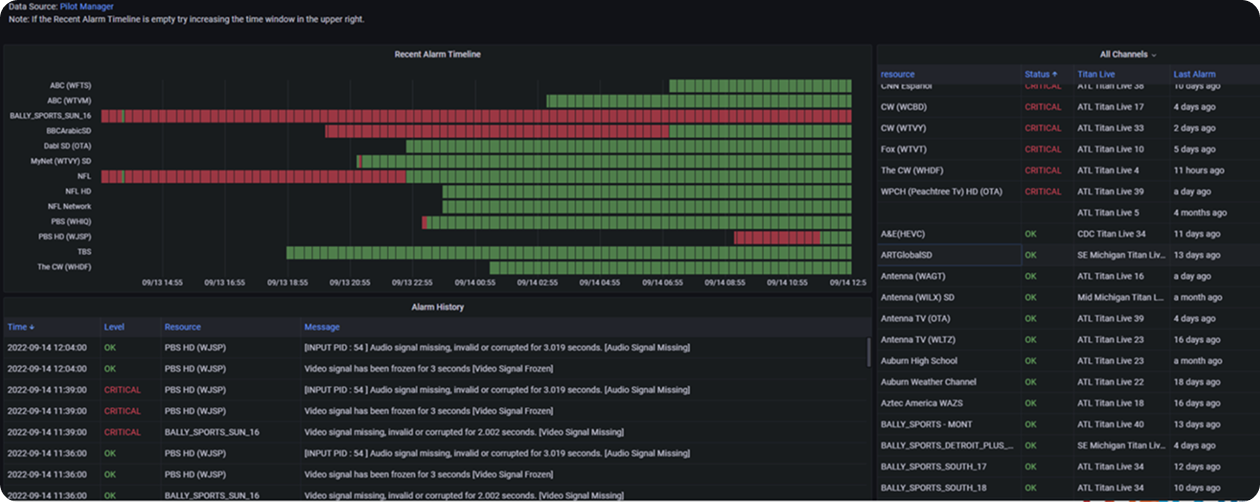
The Channel Status Dashboard (shown in the image above) is another example of a real-time Grafana dashboard. It monitors the health of streaming video services WOW! provides. WOW! engineers collect data from various points throughout their content delivery network and leverage InfluxDB to determine the health of the services. Similar to the Node Health Dashboard, when changes in service health occur, InfluxDB’s alerting framework triggers an alert. WOW! service engineers can then take the appropriate actions.
WOW! now leverages the Telegraf, InfluxDB, and Grafana, also known as the TIG stack, to provide insight into hundreds of thousands of devices. After implementing the TIG stack, WOW! engineers have a complete picture of their device and network health, and their devices are more operational.


