InfluxDB C Client Library for Capturing Statistics
By
Community
updated December 14, 2025
Product
Use Cases
Developer
Navigate to:
This is a re-post of the article, written by InfluxAce, IBM Technical Staff member, and developer of nmon for AIX and Linux Nigel Griffiths and first published on the IBM website.
Currently, there is no official InfluxDB C language client library. Fortunately, I wanted to do exactly that for capturing Operating System performance statistics for AIX and Linux. This data capturing tool is called “njmon” and is open source on Sourceforge. So having worked out how and developing a small library of 12 functions for my use to make saving data simple, I thought I would share it. I hope it will prove useful for others.
The InfluxDB documentation for statistics in Line Protocol format is fine, but there are vague HTTP requirements and you have to discover the details by many experiments. This library includes the network socket handling layer too, which can be tricky the first time.
Not covered in this InfluxDB C client library are functions to extract data from InfluxDB (JSON data handling is very hard work in the C language), nor database management like creating an InfluxDB database (I use the “influx” command).
Environment
It is assumed:
- You have a C language compiler.
- You can write a little C language program.
- You are running InfluxDB.
This code was tested on the current version of the following operating systems and hardware:
- AIX 7
- Linux RHEL, SUSE, and Ubuntu on ppc64le (POWER8/9)
- Linux RHEL, SUSE, and Ubuntu on AMD64 (x86_64)
It might work on other operating systems as the C code is straight forward. The code uses the regular socket library functions.
?Steps
A small example of the code needed to capture statistics and get them added to InfluxDB using the C language (for short they are called the “ic” functions):
#include "ic.h"

main()
{
   ic_influx_database("myinfluxdbserver", 8086, "ic"); /* the details of the connection to InfluxDB */
   ic_tags("host=myserver.acme.com");                  /* tags to find specific data amongst the data */

   for(;;) {
       ic_measure("mystats");             /* name of a group of data */
           ic_long("busy",  42);          /* example of saving an integer */
           ic_double("pi",   3.142);      /* example of saving a floating point number */
           ic_string("state", "Running"); /* example of saving some text */
       ic_measureend();                   /* end the group */

       ic_push();      /* after many measures it is sent to InfluxDB over the network in one go*/

       sleep(60);      /* pause 60 seconds and then repeat */
}
In this tiny example, the statistics (42, 3.141, “Running”) are hardcoded. Not a good idea and rather pointless. Hopefully, the code illustrates the use of the library functions with various C data types. Normally, the C code would include C function calls to fetch the live data from the operating system, application libraries, or by executing commands. The details of these “ic” functions and a few more are covered in the rest of this article.
At the end of this article is the code and example of using it for you to download from GitHub.
Introducing the C functions
The supplied functions are (in the order of normal use):
void ic_influxdb(char * hostname, long port, char * database)
- Use this function only once at the start of your C program.
- This function provides the connection details of your InfluxDB server.
- For example, ic_influxdb("admin.domain.company.com", 8086, "ic")
- The hostname is obvious. The default port for InfluxDB is 8086. It can be changed in the InfluxDB configuration file but would need an InfluxDB restart to activate it.
- The database needs to be created in advance of running the program. Assuming a database name of "ic", on the InfluxDB server
$ influx > create database ic > exit $ - You can use the hostname of the InfluxDB server or the IP address.
- This function just notes the details. The connection to the InfluxDB is only made as the data is pushed out (ic_push()) and the connection dropped straight afterward.
void ic_influx_userpw(char *user, char *password)
- Use this function only once at the start of your C program.
- For example, ic_influx_userpw("Nigel", "SECRET");
- If your InfluxDB requires a username & password for access, then use this function to supply the details for later connections to InfluxDB.
- If your InfluxDB server does not have a mandatory username and password (for example, a default installation configuration), then you don't need to call this function. If they are not needed, InfluxDB quietly ignores any username and password.
- SSL certificates are not supported yet.
void ic_tags(char *tag_string)
- Use this function only once at the start of your C program.
- Tags are used to narrow down the database data for a specific resource.
- An example from computer performance statistics: the main tag is normally the hostname of the server where the statistics were collected. Graphing tool can use the tag values to limit the data to a subset. For example, selecting for the CPU stats about a specific server by its hostname.
- Example, ic_tags("host=server42")
- You can have more than one tag. Tags are comma-separated and contain no spaces:
ic_tags("host=server42,serialno=75629475") - There can be no spaces or tab characters in the tags at all. It is best to avoid them.
- There is a special case, if you have multiple resources of the same type, for example, multiple disks then you might use:
- ic_tags("host=server42,serialno=75629475,disk=sda")
- ic_tags("host=server42,serialno=75629475,disk=sdb")
- etc.
- These extra tags allow graphing all the disks on one graph and Grafana can work out how many disks you have for each server and adjust the graphs to match more details further down this article.
InfluxDB Line Protocol very brief introduction
InfluxDB Line protocol needs a the following sections:
measurement-name, tags, a space, key=value pairs, a space and a timestamp
Measurement-names are best meaningful like: cpu, memory, disk, transactions, temperature etc. The names are listed in graphing tools, so good clear names can help in the selection of the correct statistics.
Tags identify the source of the data and features that are used to select data. For example, a server hostname (host=vm99), the instrument the data came from (probe=a12), the application name (app=DB2).
The space indicates the end of the tags and the start of the key-value pairs The key=value is the actual data like “cpubusy”=56So:
- Format:
measurement,tags key=value timestamp CPUutilisation,host=vm123 cpu_user=60,cpu_sys=15,cpu_wait=15,cpu_idle=10 timestamp- The ic library lets the InfluxDB add the timestamp (in seconds from 1st January 1970) thus ensuring time consistency across collecting tools.
Capturing your statistics
- It is assumed that you know how to capture your actual data in a C program.
- Often the data comes from the C library function calls of your operating system or libraries supplied with your installed extra tools and applications.
- The tiny worked example at the start of the article covered the basics. Here are the details:
- The ic_measure()
- Then, a number of functions to save the data depending on the data format:
- ic_long() for a C language long (large integer (technically a 64 bit long long))
- ic_double() for a C language double (large floating point number)
- ic_string() for a C language string (an array of characters terminated by a zero character)
- Finishing with a ic_measureend()
void ic_measure(char *measurement_name)
- This function names the measurement (a group of statistics) and it ends with a matching call to ic_measureend(). The section name is saved in the output buffer.
- You can have many ic_measure() and ic_measureend() pairs to save different resources. For example, computer statistics: CPU, memory, disks, networks and more.
- For example, ic_measure("CPUutilisation");
void ic_measureend()
- This function is used to note the end of the current measurement.
void ic_long(char *name, long long value)
- This function saves the name and integer to the output buffer.
- There can be many ic_long() function calls within the measure.
- For example:
ic_long("cpu_user", 60);
ic_long("cpu_sys", 15);
ic_long("cpu_wait", 15);
ic_long("cpu_idle", 10);
void ic_double(char *name, double value)
- This function saves the name and double floating point number to the output buffer.
- There can be many ic_double() function calls within the measurement.
- For example:
ic_double("cpu_user", 60.3);
ic_double("cpu_sys", 15.1);
ic_double("cpu_wait", 15.2);
ic_double("cpu_idle", 9.4);
Note on using the long integers and doubles with InfluxDB:
- With InfluxDB, there is practically no space benefit of using integers over doubles.
- Plus InfluxDB is clever in not getting confused with exact comparisons like comparing a double with zero.
- It is my recommendation to use double values most of the time.
- It is impossible to try changing data in InfluxDB from an integer into a double after it is added to the database. So get the data type correct the first time. If you try to add a "key = floating point number" but that key has already been written to InfluxDB as an integer, then the whole measurement is rejected.
- I hit problems like this when I thought data was obviously an integer like the run queue number. Then, later realized that the run queue delta needs to be divided by the number of seconds. Thus making it a floating point number. The options are dropping all the current data in the database or renaming the "runqueue" to a slightly different name like "runq".
void ic_string(char *name, char *value)
- The function saves the name and string to the output buffer.
- There can be many ic_string() function calls within the measure.
- For example:
ic_string("architecture", "ppc64le");
ic_stringe("os_version", "7.2.5.2");
ic_string("os_name", "AIX");
ic_string("vendor", "IBM");
ic_string("status", "Running")
ic_string("location", "London, UK");
Do not use it like this, as strings can not be graphed:
is_string("processes", "42") ;
is_string("processes", "42.12345") ;
is_string("meaning", "forty two");
void ic_push()
- Once all data is saved, it needs to be sent to InfluxDB. The ic_push() function does that.
- ic_push() function opens a network socket the InfluxDB server sent all the saved data and close the socket. The single push for all the data is an efficient approach to sending possibly thousands of statistics in one go.
- Afterward, the socket connection is closed.
- As the connection to the InfluxDB is only temporary, it means:
- There is no problem, if InfluxDB gets restarted to take a software update to a newer InfluxDB version or if the server is rebooted.
- It also handles transitory network outages.
- If the socket can't be created, the data will get dropped but the next ic_push() works fine.
- Typically your program is structured like this:
Initialise functions

while(1) {
   ic_measure()
       add data to this measure
   ic_measureend()

   ic_measure()
       add data to this measure
   ic_measureend()

   ic_measure()
       add data to this measure
   ic_measureend()

   ...

   ic_push()
   sleep(for some seconds)
}
Always have the sleep() directly after the ic_push() so the time between the data collection and ic_push() is as small as possible.
What happens if you have multiple units of the same type?
An example from the computer statistics world, your laptop has single disk but a larger server could have tens or hundreds of disks and each server might have a different number of disks. This makes it tricky to graph as there may be 1 to 100’s of lines on the graph. The same goes for CPU cores, networks, file systems, network buffers, Firbe Channel adapters and so on.
To handle this, we have what I call sub measurement stats within a measurement.
void ic_sub(char *sub_name)
- This function is used within the ic_measurement() and ic_measurementend() functions.
- The sub_name is added to the tags of this measurement until the matching ic_subend().
- Between the ic_sub() and ic_subend() the regular ic_long(), ic_double() and ic_string() are used to save the data.
void ic_subend()
- End the sub measurement i.e. a matched pair with the previous ic_sub().
- The tag added by the previous ic_sub() is removed.
A simple example to help make this clear. The indentation is not needed (ignored in the C language) but used here to clarify the pairs of function.
ic_measurement("disks");

   ic_sub("hdisk0");
       is_double("reads", 45.6);
       is_double("writes",105.83);
   ic_subend();

   ic_sub("hdisk1");
       is_double("reads", 2084.91);
       is_double("writes",4.1);
   ic_subend();

ic_meassurementend();
The final function is to switch on debugging output:
void ic_debug(int level)
- This function can be called at any time but if you have problem it is best to call this function at the start.
- Only three values are valid
- Level = 0 means debug output is off. The library will only output for warning (recoverable errors) and errors (where ic will cause the program to exit).
- Level = 1 means trace output as each number in the library is called so you can easily see how your programs are interacting with the library. Also for the ic_push() the basic information header to the InfluxDB and the response is output.
- Level = 2 means the same as level = 1 and in addition the details of the InfluxDB Line Protocol is output this can be large if you are writing lots of data to InfluxDB.
Compiling
Experienced C programmers will find there is only 3 hundred lines of code mostly in the ic.c and an example of using it in example.c. The code is on GitHub: github.com/nigelargriffiths/InfluxDB-C-client. The files are:
- ic.h - The header file for accessing the functions in ic.c
- ic.c - The actual ic code. Use this by compiling in with your application code or the example.c code. Also, use it by creating a library.
- example.c - Simple example code to get you started using the function correctly. Includes the start up functions then simple measurements and measurements with sub data.
- ic_all_in_one.c - This is ic.c and example.c code in one file. Useful, if you want to have a quick compile and then experiment with the code.
- InfluxDB_C_client_example_Grafana_Dashboard.json - Working Grafana Dashboard allowing Hostname changes
The options are:
Use the ic.c file as the basis of a data collector program. Replace your code with that in the example main() function.
- Option 1: compiler with:
cc ic_all_in_one.c -g -O3 -o ic_testIf your compiler gives an error about “isnan” then add the maths library to the compiler command: -lm
- Option 2: Create a library that can be added to your application. In your application include the ic.h header file and then call the ic library functions:
# Compile as a library archive
cc ic.c -g -O3 -c

# Check you have an archive
ls -l ic.a

# Compile other code and include the library
cc -g -O3 mycode.c ic.o -o myapp
Running the Example code
At the end of the ic_all_in_one.c file there is example data capture code in the main() function. This can be complied to get you started. You will have to alter the mail() function and the connection details to your InfluxDB and your InfluxDB database.
The example code looks like this:
ic_influx_database("silver2", 8086, "ic");
       ic_influx_userpw("nigel", "secret");

       ic_debug(2);
Change those lines of code as follows:
- "silver2" to the hostname of your InfluxDB server. You can also use the IP address.
- 8086 is the port number default for InfluxDB - change this if using a non-standard InfluxDB port.
- "ic" is the database name (also called a bucket) in the InfluxDB server - I recommend using "ic" for a quick test. Normally, we chose a meaningful name for the database. Make sure you have created the InfluxDB database called "ic" or what ever your decided.
- The user name and password is used if you have setup theses for access to your InfluxDB
- You might want to set the debug level with the ic_debug(level). Where 0="no output", 1="output the calls you make to the ic functions" and 2="also output the details of the data sent to InfluxDB.
Compile the example code with:
cc ic_all_in_one.c -g -O3 -o ic_test
You now have an executable binary file called “ic_test”.
Sample output with debug = 2 (all possible debug messages).
[nag@silver2 ic]$ ./ic_test
ic_influx_by_hostname(host=silver2,port=8086,database=ic))
ic_influx_by_hostname hostname=silver2 converted to ip address 9.137.62.12))
ic_influx_userpw(username=nigel,password=secret))
ic_tags(host=silver2.aixncc.uk.ibm.com)
ic_measure("cpu") count=35
ic_long("user",30) count=44
ic_double("system",8.3) count=57
ic_string("status","low") count=70
ic_measureend()
ic_measure("disks") count=110
ic_sub("sda1") count=125
ic_long("reads",26) count=135
ic_double("writes",73.3) count=149
ic_subend()
ic_sub("sda2") count=204
ic_long("reads",51) count=214
ic_double("writes",101.5) count=229
ic_subend()
ic_measureend()
ic_push() size=232
socket: trying to connect to "9.137.62.12":8086
buffer size=88
buffer=<POST /write?db=ic&u=nigel&p=secret HTTP/1.1
Host: silver2:8086
Content-Length: 232

>
output size=232 output=
<cpu,host=silver2.aixncc.uk.ibm.com user=30i,system=8.284,status="low"
disks,host=silver2.aixncc.uk.ibm.com,disk_name=sda1 reads=26i,writes=73.266
disks,host=silver2.aixncc.uk.ibm.com,disk_name=sda2 reads=51i,writes=101.544
>
written=232 bytes sent=0 total=232
received bytes=249 data=<HTTP/1.1 204 No Content
Content-Type: application/json
Request-Id: 9f6edc98-584f-11eb-be71-3a71321b9604
X-Influxdb-Build: OSS
X-Influxdb-Version: 1.7.10
X-Request-Id: 9f6edc98-584f-11eb-be71-3a71321b9604
Date: Sat, 16 Jan 2021 23:07:36 GMT

>
http-code=204 text=No Content [204=Success]
ic_push complete
Notes:
- The "26i" and "51i" is the notation for integer values.
- The lines starting ic_ tell you the how you called the ic package.
- After the ic_push() it recorded the interaction with InfluxDB.
- The data sent is output vis the socket in HTTP including the POST details.
- The Influx Line Protocol data.
- The ic_push() gets the results returned from InfluxDB. This is a simple acknowledge message.
- A 204 message and text "No Content" is a success. InfluxDB is replying "no comment"; that is, "nothing wrong", and the data was saved. If there was a problem with the data, then InfluxDB returns other error codes, text describing the problem and what needs to be changed.
Can we find the data in InfluxDB?
Once you have used the “ic” library and program to save statistics to InfluxDB it is good to check the data has been saved correctly before attempting to graphing it. This can be done using the InfluxDB command line interface called “influx” and only needs a couple of simple commands. Here we select the database for “ic” (use ic) and list the saved measurements (show measurements). This sample output is from running the example code in the ic.c file, so the cpu and disk statistics are faked up data.
[nag@silver2 ic]$ influx
Connected to http://localhost:8086 version 1.7.10
InfluxDB shell version: 1.8.3

> use ic
Using database ic

> show measurements
name: measurements
name
----
cpu
disks

> select * from cpu
name: cpu
time                host                      status system user
----                ----                      ------ ------ ----
1610838551375866432 silver2.aixncc.uk.ibm.com low    8.284  30
1610838552391246233 silver2.aixncc.uk.ibm.com high   8.284  39
1610838553392913108 silver2.aixncc.uk.ibm.com high   6.284  60
1610838554394548129 silver2.aixncc.uk.ibm.com high   9.284  24

> select * from disks
name: disks
time                disk_name host                      reads writes
----                --------- ----                      ----- ------
1610838551375866432 sda0      silver2.aixncc.uk.ibm.com 1     1
1610838551375866432 sda1      silver2.aixncc.uk.ibm.com 26    51.272
1610838551375866432 sda2      silver2.aixncc.uk.ibm.com 25    57.556
1610838552391246233 sda0      silver2.aixncc.uk.ibm.com 1     1
1610838552391246233 sda1      silver2.aixncc.uk.ibm.com 24    51.272
1610838552391246233 sda2      silver2.aixncc.uk.ibm.com 1     38.704
1610838553392913108 sda0      silver2.aixncc.uk.ibm.com 1     1
1610838553392913108 sda1      silver2.aixncc.uk.ibm.com 10    7.284
1610838553392913108 sda2      silver2.aixncc.uk.ibm.com 41    13.568
1610838554394548129 sda0      silver2.aixncc.uk.ibm.com 1     1
1610838554394548129 sda1      silver2.aixncc.uk.ibm.com 13    57.556
1610838554394548129 sda2      silver2.aixncc.uk.ibm.com 59    170.668

> exit
Sample Grafana graphs used to visualize the InfluxDB data
Grafana is a popular choice for graphing InfluxDB data here are a few simple line graphs of the fake data.

In the Grafana dashboard, the two graph panels definitions look like this:
For the straightforward CPU statistics, the measurements are named.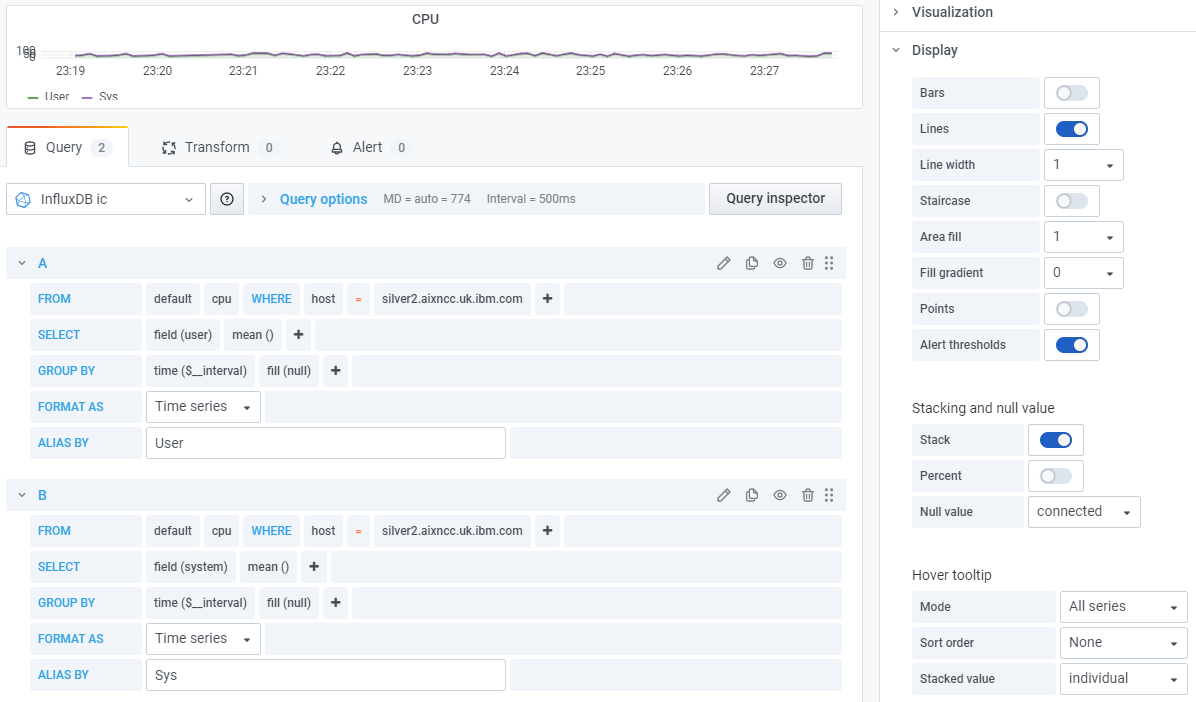 ?
For the disks statistics, there are different numbers of disks on each server, so the code used ic_sub() to handle it. Grafana can count the number of sub measurements disks and works out how to display that number. Note the use of “GROUP BY” and the “ALIAS BY” fields.
?
For the disks statistics, there are different numbers of disks on each server, so the code used ic_sub() to handle it. Grafana can count the number of sub measurements disks and works out how to display that number. Note the use of “GROUP BY” and the “ALIAS BY” fields.

Warranty = none
- It is strictly "at your own risk."
