InfluxDB, Flight SQL, Pandas, and Jupyter Notebooks Tutorial
By
Anais Dotis-Georgiou
updated October 20, 2023
Product
Navigate to:
InfluxDB Cloud, powered by IOx, is a versatile time series database built on top of the Apache ecosystem. You can query InfluxDB Cloud with the Apache Arrow Flight SQL interface, which provides SQL support for working with time series data. In this tutorial, we will walk through the process of querying InfluxDB Cloud with Flight SQL, using Pandas and Jupyter Notebooks to explore and analyze the resulting data, and creating interactive plots and visualizations. Pandas is an OSS data structure that makes working and analyzing data easy. Jupyter Notebook is “the original web application for creating and sharing computational documents. It offers a simple, streamlined, document-centric experience”. Whether you are working with sensor data, financial data, or any other type of time series data, this tutorial provides you with a solid foundation for using InfluxDB Cloud, Flight SQL, Pandas, and Jupyter Notebooks to gain insights and make informed decisions based on your data. Try it out for yourself with the following notebook.
Requirements
This tutorial assumes you meet the following requirements:
-
Python 3.6
-
InfluxDB v2 Python Client Library. Use
pip3 install 'influxdb-client[ciso]`to install it. -
Flight SQL Python Library. Use
pip install git+https://github.com/influxdata/flightsql-dbapi.gitorbash pip3 install flightsql-dbapi -
Pandas Library. Use
pip3 install flightsql-dbapi -
Jupyter Notebooks. Use
pip3 install notebook
You can also install all of the following dependencies with the following requirements.txt:
pandas==0.23.4
influxdb_client==1.30.0
flightsql-dbapi==0.0.1
notebook ==6.4.12
Workflow
- Import dependencies.
- Gather authentication credentials including:
- Instantiate the Flight SQL client.
- Execute a SQL query. In a previous post, we described how to use the
Date_Bin()function to perform the downsampling. In this tutorial we’ll use Pandas instead. - Create a reader object to consume the result.
- Read all data into a
pyarrow.Tableobject. - Convert the data to a Pandas DataFrame.
- Downsample the data with Pandas.
- Create a visualization of the data with matplotlib and seaborn.
- Instantiate the InfluxDB v2 Python Client Library and write the Pandas DataFrame back to InfluxDB.
Step 1-7: Boilerplate, querying InfluxDB Cloud with Flight SQL, and converting the output to a Pandas DataFrame
Steps 1-4 are basically boilerplate. In this example, we use SQL to select all of the data from that bucket. We query for all of our data because our data has gaps in it. An advantage to using Pandas and Python is the ability to easily clean data and take advantage of libraries for custom visualizations. The following section demonstrates how we can visualize time series with gaps using Seaborn. Seaborn is a Python data visualization library built on top of matplotlib, another popular Python visualization library.
# 1. Import dependencies.
from flightsql import FlightSQLClient
import pandas as pd
import matplotlib.pyplot as plt
import seaborn as sns
from influxdb_client import InfluxDBClient
from influxdb_client.client.write_api import SYNCHRONOUS

# 2. Gather authentication credentials.
token = "xxx"
url = "https://us-east-1-1.aws.cloud2.influxdata.com/"
org = "xxx"
bucket = "anais-iox"

# 3. Instantiate the FlightSQL Client
client = FlightSQLClient(host='us-east-1-1.aws.cloud2.influxdata.com',
                        token=token,
                        metadata={'bucket-name': 'anais-iox'},
                        features={'metadata-reflection': 'true'})

# 4. Execute a query against InfluxDB's Flight SQL endpoint. Here we are querying for all of our data.
query = client.execute("SELECT * FROM \"airSensors\"")

# 5. Create reader to consume result
reader = client.do_get(query.endpoints[0].ticket)

# 6. Read all data into a pyarrow.Table
Table = reader.read_all()

# 7. Convert to Pandas DataFrame
df = Table.to_pandas()
df = df.sort_values(by="time")
df.head(20)
The resulting DataFrame looks like this. We include 20 values with the head() function just to make sure that it returns multiple time points for each sensor.

Now we want to use Pandas to downsample our data.
Step 8: Downsampling with Pandas
The objective here is to find the mean of our temperature, co, and humidity fields over 10 minute intervals. Use the groupby() function to group our dataframe by the sensor_id tag (or column). Then we use the resample() and mean() functions to downsample and apply a mean over the intervals, respectively.
df_mean = df.groupby(by=["sensor_id"]).resample('10min', on='time').mean().dropna()
# create a copy of the downsampled data so we can write it back to InfluxDB Cloud powered by IOx.
df_write = df_mean.reset_index()
df_mean
The resulting DataFrame looks like this:

Step 9: Create a visualization of the data with matplotlib and seaborn
First, we need to create a visualization with matplotlib. We’ll focus on visualizing the downsampled temperature values for all of the sensors. In order to graph all of the sensors, we need to pivot our data first. The following code creates the subsequent graph:
df_mean.reset_index().pivot(index='time', columns='sensor_id', values='temperature').plot(rot=90)
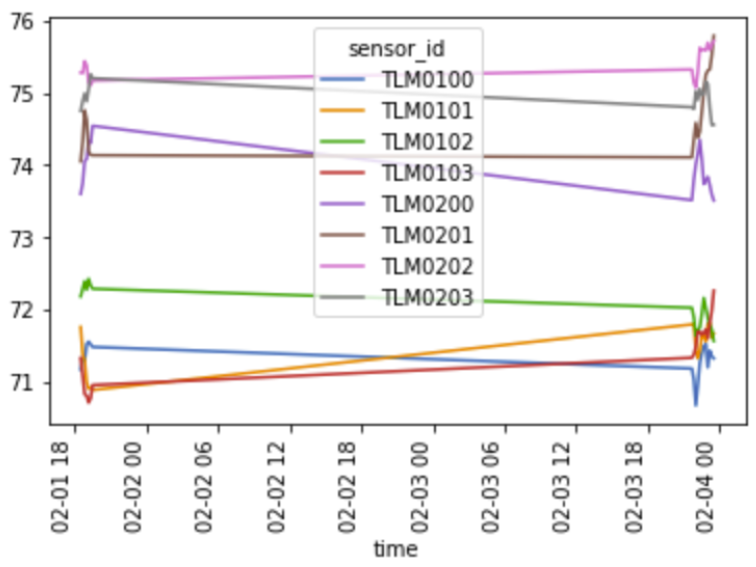
This graph isn’t great. The timestamps don’t have minute precision, the legend is poorly positioned, and we also have a large gap in our dataset which causes those straight lines. Let’s use Pandas to clean our data and utilize Seaborn to create a more pleasing visualization.
# Convert the time object to a string to handle the gap.
df_mean.reset_index('sensor_id', inplace=True)
df_mean.index = df_mean.index.map(str)

# Make a plot with seaborn instead to make the visualization stronger by moving the labels, pivoting the x-axis values, and removing the gap.
sns.set_style('darkgrid')
sns.set(rc={'figure.figsize':(14,8)})

ax = sns.lineplot(data=df_mean.reset_index(), x ='time', y = 'temperature',
                  hue='sensor_id', palette='viridis',
                  legend='full', lw=3)

plt.legend(bbox_to_anchor=(1, 1))
plt.ylabel('Temperature')
plt.xlabel('Time')
plt.xticks(rotation=45)
plt.show()
The result is the following graph: We eliminated the gap in the data and created a higher precision y-axis.

Step 10: Write the downsampled data back to InfluxDB Cloud
Finally, we write our downsampled data back to InfluxDB Cloud using the InfluxDB v2 Python Client using the .write method and specifying the DataFrame we want to write back into InfluxDB.
# write data back to InfluxDB Cloud powered by IOx
client = InfluxDBClient(url=url, token=token, org=org)
client.write_api(write_options=SYNCHRONOUS).write(bucket=bucket,
               record=df_write,
               data_frame_measurement_name="mean_downsampled",
               data_frame_timestamp_column='time',
               data_frame_tag_columns=['sensor_id'])
Use a SQL query in the InfluxDB Cloud UI to verify that we successfully wrote our downsampled data back to InfluxDB.

Conclusion
Using Flight SQL to query InfluxDB Cloud enables developers to take advantage of the performant benefits that Flight SQL offers in conjunction with the vast selection of tools for analyzing, cleaning, and visualizing data. I encourage you to extend the methods discussed in this post by combining them with the forecasting and anomaly detection examples contained in this repo, a collection of Jupyter notebooks highlighting how to use a variety of popular Python libraries for time series data analytics applications. Finally, find the notebook associated with this tutorial here.
To take advantage of all the advancements with InfluxDB IOx, sign up here. If you would like to contact the InfluxDB IOx developers, join the InfluxData Community Slack and look for the #influxdb_iox channel.
I hope this blog post inspires you to explore InfluxDB Cloud and take advantage of Flight SQL to transport large datasets from InfluxDB for data processing with the tools of your choice. If you need any help, please reach out using our community site or Slack channel. I’d love to hear about what you’re trying to achieve and what features you’d like the task system in InfluxDB to have.
