InfluxDB's Checks and Notifications System
By
Anais Dotis-Georgiou
updated December 14, 2025
Product
Navigate to:
InfluxDB 2.0’s Checks and Notifications system is likely the most powerful and flexible system available for creating alerts based on time series data. To get the most out of the system, it is helpful to understand the different pieces and how they fit together. After reading this article, you should be able to create precise alerting using the InfluxDB 2.0 User Interface (UI), as well as be able to extend and customize the system to suit your specific needs.
Components
Unlike less powerful and less flexible alerting systems, the InfluxDB 2.0 Checks and Notifications system comprises five components that function as building blocks that can be combined to create the precise functionality you need.
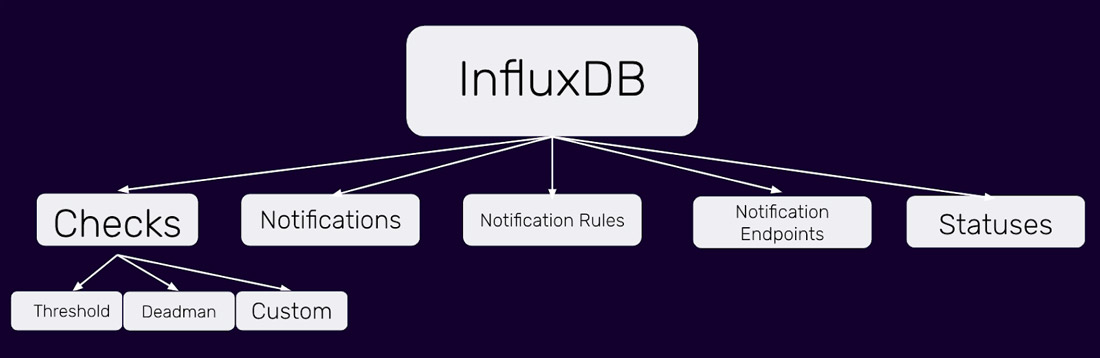
Checks, Notifications, Notification Rules, Notification Endpoints, and Statuses are the five components that make up the Checks and Notifications system for InfluxDB 2.0. These highly customizable components enable you to build Alerts, so you can take sophisticated corrective action in response to complex conditions in your time series data.
Checks in InfluxDB
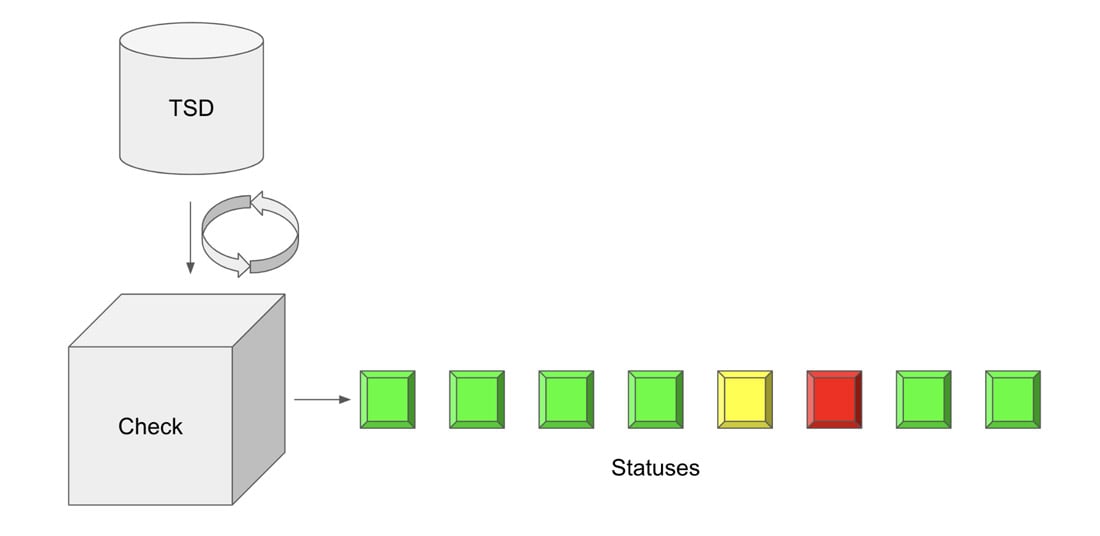
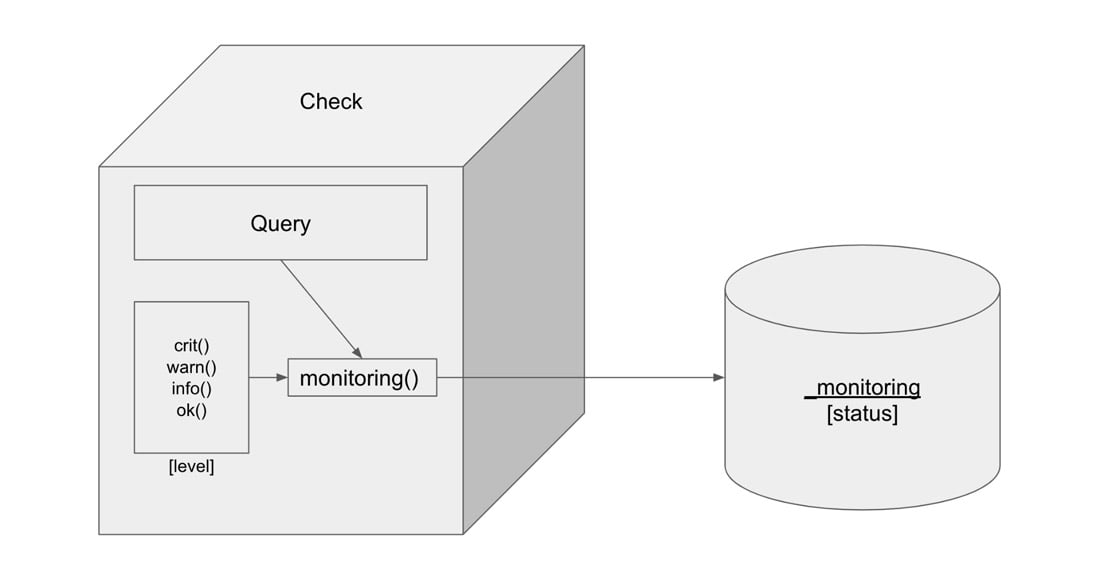
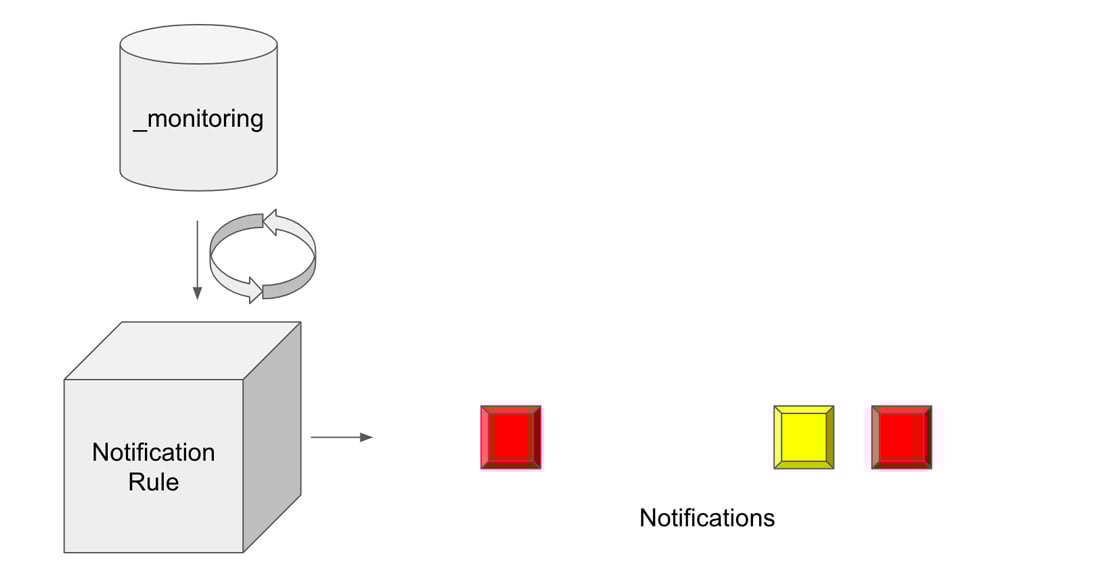
Checks in InfluxDB are a type of task. A task is a Flux query that runs on a schedule or defined frequency. Flux is the functional data scripting language for InfluxDB. Flux allows you to query, transform, and analyze your time series data in almost any way you need. Checks query data and apply a status or level to each data point based on specified condition(s). The output of the check is a status which is written to the “ _monitoring” bucket. The “_monitoring” bucket is a default internal bucket.
There are two ways you can create a Check. You can either create a check through the UI, or you can write a custom check with Flux. Before embarking on the multitude of ways that you can use InfluxDB to craft checks, it’s important to recognize that UI uses the InfluxDB v2 API and all checks are written in Flux. Therefore a check generated through the UI will be just as performant as a custom check crafted as a task. Therein lies the power of InfluxDB and Flux - the developer truly has the ability to customize their time series workloads as they see fit.
Threshold checks in the InfluxDB UI
The easiest way to create a check is through the UI. You can create a threshold check or a deadman check through the UI. To create a threshold or deadman check, navigate to the Alerts page in the UI from the right hand navigation menu, click + Create, and select either threshold or deadman check under the Checks panel. There are two steps to creating a threshold check through the UI:
- Define Query
- Configure Check
To define your query, select the field that you want to create a check on. Next, apply an aggregate function to your data. The mean is calculated from the window period matches the Schedule Every configuration option. Aggregate functions are applied to your data by default for two reasons. First, users prefer to alert on trends in their data rather than raw time series data. Second, this default aggregation interval ensures that your check run schedule aligns with your aggregated data output. You can configure the window period for which the aggregation is applied by changing the Schedule Every configuration option, described below.
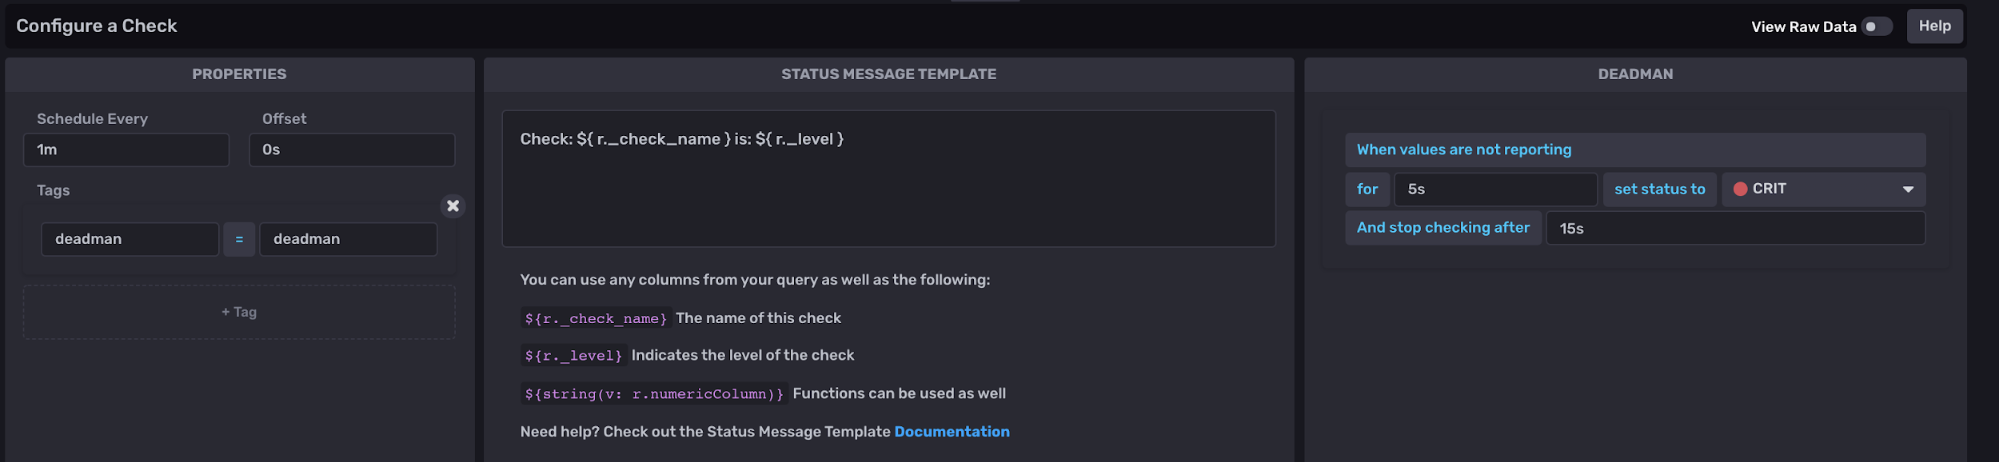
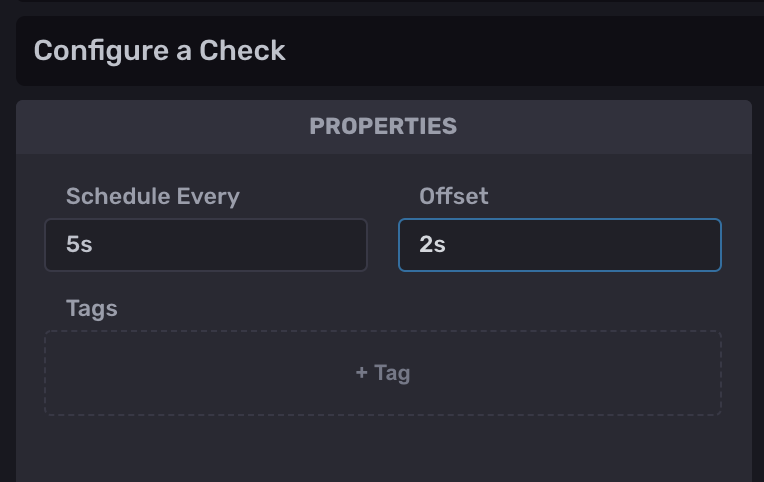
To configure your threshold check, you must specify the Properties, Status Message Template, and Thresholds of your check.
The check properties include the Schedule Every, the interval to run your check, and the Offset, the interval at which to delay the execution of a task. Including an Offset can help you avoid read/write conflicts and assist in successful metrics buffering. Finally, the Tags property allows you to add a custom tag to your check output. This check property will add a new column with your specified tag key as the column name and the tag value for the rows.
Adding tags to the output of your check can facilitate further data processing. For example, you might decide to implement corrective action or program a response only when multiple fields meet certain check conditions. Since the output of all your checks is written to the “_monitoring” bucket, adding a tag to these related fields would facilitate writing a subsequent notification and/or task on top of those checks because you can query all of the related check status data easily by filtering for your added tag.
The Status Message Template allows you to include a custom message in your notifications and alerts. These status messages can help users understand what their check is about, They can also be used to feed important information related to a check or to a notification endpoint for future use and integration further down the data pipeline. The default status message looks like this:
Check: ${ r._check_name } is: ${ r._level }
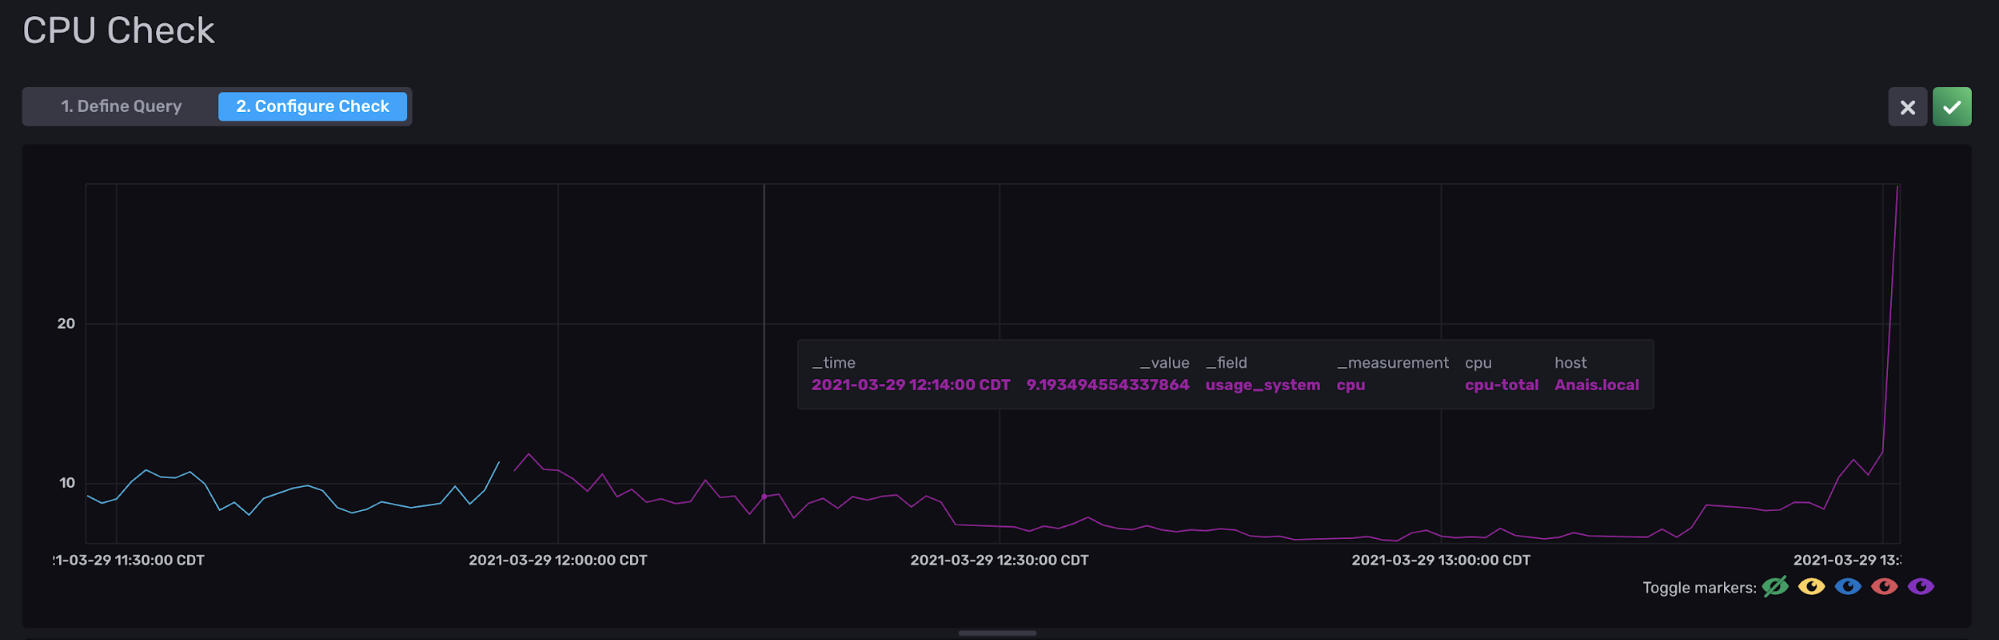
However, you can elect to include information from any of the columns in a status message that is included in the output of a check in the “_monitoring” bucket. The columns included in a status are:
_check_id: each check is assigned a check ID. Check ID's can be used for debugging and rerunning failed checks_check_name: the name of your check or "CPU Check" from the example above_level: either CRIT, WARN, OK, or INFO for UI checks (or configurable for custom checks)_source_measurement: the measurement of your source data or "cpu" from the example above_type: the type of check or "threshold" from the example above- custom tags added to the query output
- columns included in the query: to view all of these columns, simply hover over a point in your query.
The Flux behind threshold checks
To view the corresponding Flux script that’s generated for your threshold check, you can use the InfluxDB v2 API or the UI. To view the corresponding Flux script for the UI-generated threshold check, look at the default “_task” system bucket.
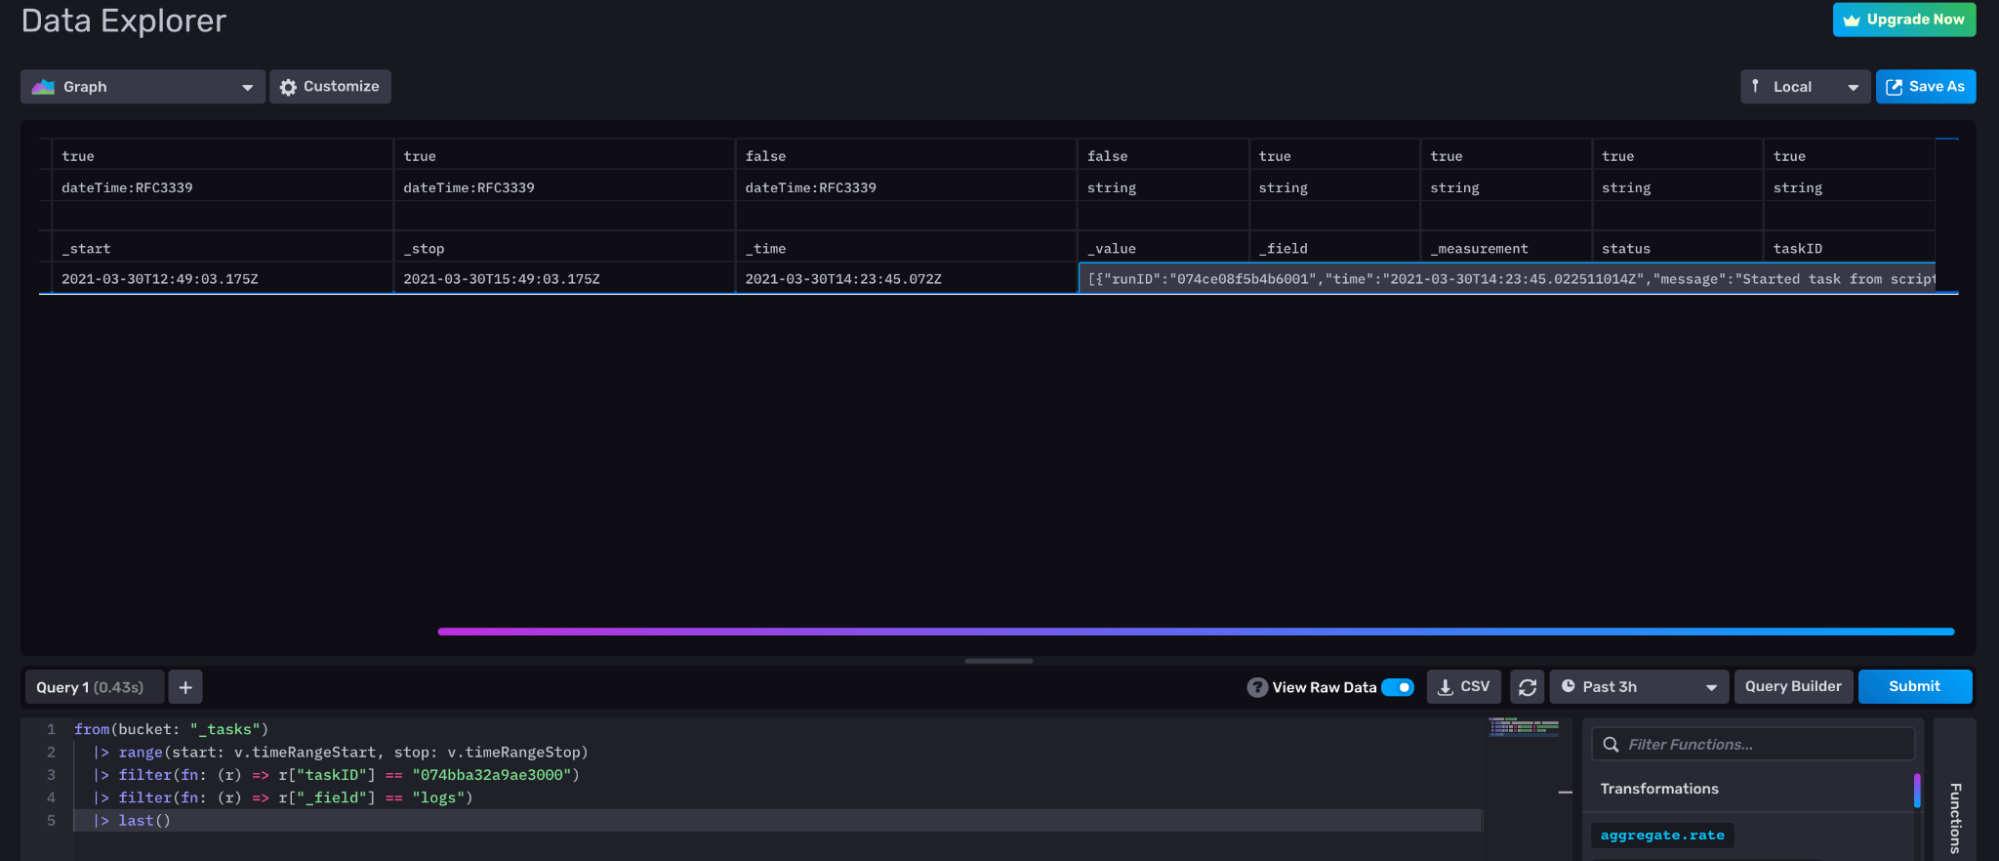
To filter for the corresponding task through the UI, you can perform the following query first:
from(bucket: "_tasks")
 |> range(start: v.timeRangeStart, stop: v.timeRangeStop)
 |> filter(fn: (r) => r["_field"] == "name")
Scroll through the result until you find your check and collect the corresponding taskID. Use that taskID to filter through your tasks and find the underlying Flux for your check. The following query uses that taskID to filter for the logs which contain the underlying Flux for your check.
from(bucket: "_tasks")
  |> range(start: v.timeRangeStart, stop: v.timeRangeStop)
  |> filter(fn: (r) => r["taskID"] == "0754bba32a9ae300")
  |> filter(fn: (r) => r["_field"] == "logs")
If you find using the UI to reveal the underlying task is cumbersome, please read feature request #1169 and add a +1 or comment if you think it would be useful to you to display underlying task IDs and check IDs next to the check name.
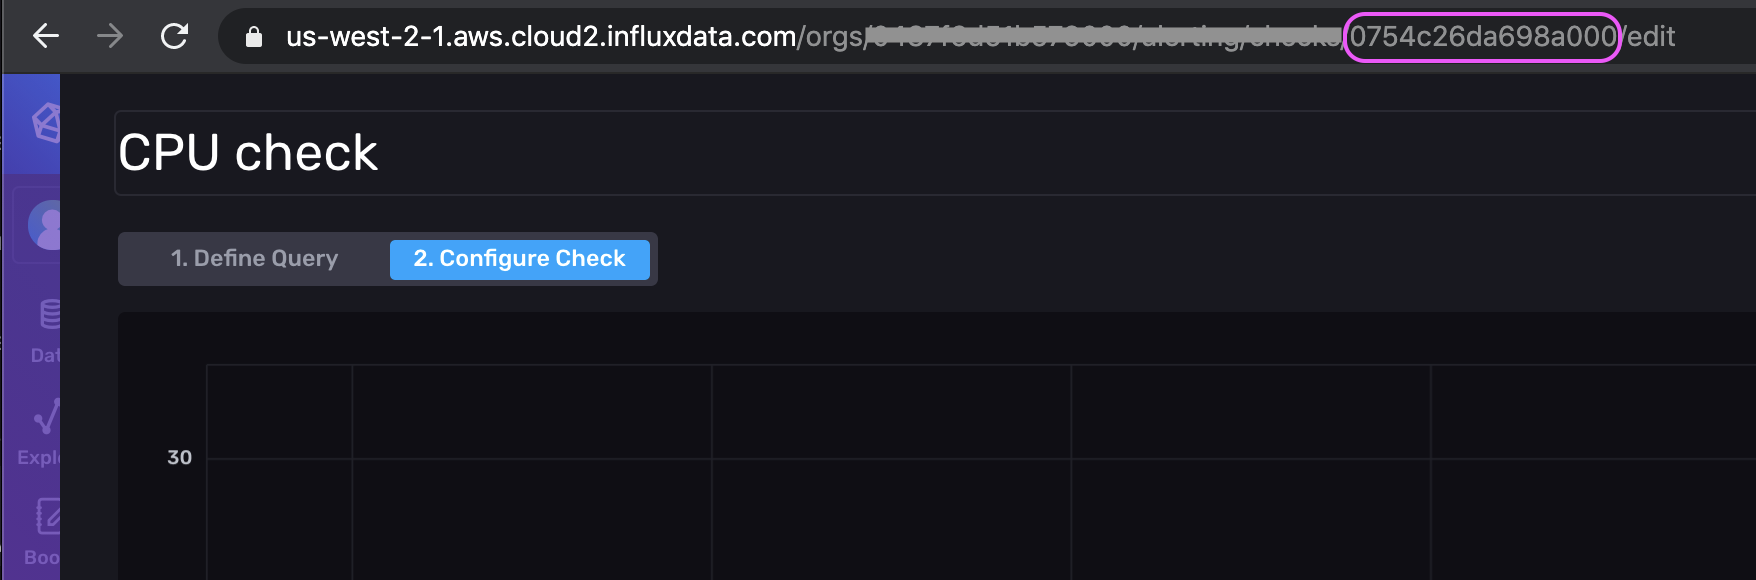
To use the InfluxDB v2 API to get the corresponding Flux script for your UI-generated check, use the check ID to submit a GET request with your Token as an Authorization parameter. Here’s an example cURL request:
curl -X GET \
https://us-west-2-1.aws.cloud2.influxdata.com/api/v2/checks/074...my_check_ID...000/query \
-H 'authorization: Token Oxxx
.my_token...xxxBg==' \A quick way to get the check ID is to look at the URL if you edit the check in the UI.
Here’s the corresponding data portion of the request which contains the Flux that generated the check through the UI for the example above (the raw JSON output is escaped and has been cleaned for readability):
package main
import "influxdata/influxdb/monitor"
import "influxdata/influxdb/v1"

data = from(bucket: "telegraf")
|> range(start: -5s)
|> filter(fn: (r) =>(r["_measurement"] == "cpu"))
|> filter(fn: (r) =>(r["_field"] == "usage_system"))
|> filter(fn: (r) =>(r["cpu"] == "cpu-total"))
|> aggregateWindow(every: 5s, fn: mean, createEmpty: false)

option task = {name: "CPU Check", every: 5s, offset: 0s}
check = {_check_id: "074bba32a48c3000",
  _check_name: "CPU Check",
  _type: "threshold",
 tags: {},}

crit = (r) =>r["usage_system"] > 5.0
messageFn = (r) =>("Check: ${ r._check_name } is: ${ r._level }")

data
|> v1["fieldsAsCols"]()
|> monitor["check"](data: check, messageFn: messageFn, crit: crit)
The first thing to notice is that the Flux script uses a less commonly used Flux syntax - square brackets instead of dots to represent member expressions. Regardless, we can see how the steps to generate a threshold check in the UI are defined by this corresponding Flux script. The data that we want to create a check on is assigned to the data variable. An aggregation is automatically applied with the aggregate Window() function. The fact that a check is really just a specialized type of task is highlighted by the task options which are defined in the line following the aggregation.
The check parameters are defined in the subsequent line. Custom functions that define the critical threshold for the field of choice and the status message message are created so that they can be passed into the monitor.check() function in the last line. The monitor.check() function checks the input data, assigns a level to the output, and writes the output to the “_monitoring” bucket. Finally our queried data, data, undergoes one final transformation with the v1.fieldsAsCols function before being passed to the monitor.check() function. This transformation function is a special application of the pivot() function, which pivots your data so that your fields are separated out into multiple columns rather than multiple tables. This shape transformation prepares the data so that Flux can easily map across multiple fields simultaneously to see if any one field value or combination of fields exceeds a threshold.
For example, if you want to create a check that evaluates two fields simultaneously, you could simply change the crit function in the Flux script above to crit = (r) =>r["usage_system"]> 5.0 and r["usage_user"] > 5.0.


Important note: The v1.fieldsAsCol() function is the deprecated version of schema.fieldsAsCols() function. This issue #1114 has been logged requesting that UI-generated checks use the schema.fieldsAsCols() function instead.
Deadman Check in the InfluxDB UI
Creating Deadman Checks through the InfluxDB UI is almost identical to creating a threshold check. However, rather than specifying thresholds, you must specify the duration of the deadman signal under the check properties in step 2) Configure Check.
The Flux behind deadman checks
To view the corresponding Flux script that’s generated for your deadman check, you can use the InfluxDB v2 API or the UI. The process for getting the corresponding Flux script for a deadman check is almost identical to that of the threshold check, as described above. Just make sure to gather the deadman check ID instead. The resulting deadman Flux script is very similar to the threshold check as well.
package main
import "influxdata/influxdb/monitor"
import "experimental"
import "influxdata/influxdb/v1"

data = from(bucket: "telegraf")
|> range(start: -15s)
|> filter(fn: (r) =>  (r["_measurement"] == "cpu"))
|> filter(fn: (r) =>  (r["_field"] == "usage_system"))
|> filter(fn: (r) =>  (r["cpu"] == "cpu-total"))
option task = {name: "Deadman", every: 1m, offset: 0s}
check = { _check_id: "074bdadac4429000",
     _check_name: "Deadman",
     _type: "deadman",
     tags: {deadman: "deadman"}}
crit = (r) => (r["dead"])
messageFn = (r) => (  "Check: ${r._check_name} is: ${r._level}")

data
|> v1["fieldsAsCols"]()
|> monitor["deadman"](t: experimental["subDuration"](from: now(), d: 5s))
|> monitor["check"](data: check, messageFn: messageFn, crit:crit)}
The only line in the deadman Flux script that is significantly different from the threshold Flux script is the second-to-last line. The monitor.deadman() function detects when a group stops reporting data. It takes a stream of tables and reports if data has been observed since time t. The experimental.subDuration() is nested in the monitor.deadman() function to subtract a duration from the current time value and evaluate if a signal has been dead for a specified time range.
Create a custom check
The InfluxDB UI makes creating simple deadman and threshold checks very easy, but it falls short in its ability to highlight the sophistication of the check system within InfluxDB. Flux allows you to transform your data in almost any way you see fit and define custom conditions. Writing a custom check enables you to incorporate any of those Flux transformations and custom conditions in your check. The steps to creating a custom check are similar to the check creation steps in UI. First, query for your data and assign that query in a variable. Assigning a variable to your initial queries isn’t required, just recommended. Next, implement the levels of your check. As described in the section above, The Flux behind threshold checks, you can assign custom conditions by changing the function definitions for the levels: crit = (r) => r["usage_system"] > 5.0 and r["usage_user"] > 5.0.
Next, use the monitor.check() function to assign a level and write the status to “_monitoring”. You can only assign a level of “CRIT”, “WARN”, “INFO”, and “OK” to your time series data with the monitor.check() function. We recommend using the default levels as placeholders for any custom levels you might have. You can include additional information about how the default levels relate to your actual levels in the message function. For example, imagine that you want to determine whether or not a battery is charging (“CH”) or discharging (“DH”) based on the slope of your battery data. You could decide to associate the custom level of “CH” to “OK” and “DH” to “CRIT” and include that association in your status message for clarity and organizational purposes. In this case, a custom check might look something like this:
solarBatteryData = from(bucket: "solar")
|> range(start: -task.every)
|> filter(fn: (r) => r["_measurement"] == "battery")
|> filter(fn: (r) => r["_field"] == "kWh")
|> derivative(unit: 3s, nonNegative: false, columns: ["_value"], timeColumn: "_time")
option task = {name: "CPU Check", every: 5s, offset: 0s}
check = {_check_id: "0000000000000001", //alphanumeric, 16 characters
    _check_name: "CPU Check",
    _type: "threshold",
    tags: {},}

ok = (r) =>r["_value"] > 0.0
crit = (r) =>r["_value"] =< 0.0
messageFn = (r) => ("Check: ${r._check_name} is: ${if r._level == "crit" then "DH" else "CH"}")

solarBatteryData
|> v1["fieldsAsCols"]()
|> monitor["check"](data: check, messageFn: messageFn, crit: crit, ok:ok)
It’s generally considered best practice to consolidate all of your statuses to the same “_monitoring” bucket to lower cardinality and keep your data organized by using the monitor.check() function. Technically, you could use Flux to write custom statuses with custom levels other than “CRIT”, “WARN”, “OK” and “INFO” by using the map() function. However, we strongly warn against this approach because you would need to incorporate a lot of schema transformations so that your output matches that of the “_monitoring” bucket. Additionally, many useful functions in the monitoring package require default levels of “CRIT”, “WARN”, “INFO”, and “OK” in your status to function. If you need to define more than 4 custom levels for your check, we recommend making multiple checks and implementing helpful check naming, custom tags, and messages.
Common problem with InfluxDB checks
Frequently, users will create a check only to notice that a status isn’t being written to the “_monitoring” bucket. They also notice that the check is failing to write a status even though the underlying task is running successfully. This behavior is most likely caused by a read/write conflict. This hurdle is probably the most common gotcha with InfluxDB checks (and notifications), but the solution is simple. Adding an offset to your check will most likely resolve this read/write conflict.
Conclusion on InfluxDB checks
If there’s one takeaway that the reader should gather from this document, it’s that all checks, notification rules, and tasks are just Flux that’s executed on a schedule. If you’re concerned about performance concerns between checks and tasks don’t be. A check is just a task underneath the hood.
Like with any data analytics problem, I suggest that you familiarize yourself with the capabilities of Flux and use them to your advantage. Use the UI to help you learn Flux, craft tasks, and verify that your tasks are operating the way you expect. Then use the API to execute, debug, and maintain those tasks for your monitoring or IoT application development needs. The InfluxDB Operational Monitoring Template is an excellent tool for task debugging.
Statuses
A status is a type of time series data that contains the results of a check. Statuses are written to the “_monitoring” bucket after a check has successfully run. As previously described in the Threshold Checks and Create a Custom Check sections above, a status contains a combination of data from the source bucket and information about the results of the check. The schema of a status is as follows:
_time: the time at which the check was executed._check_id: each check is assigned a check ID. Check ID's can be used for debugging and rerunning failed checks a tag._check_name: the name of your check ("CPU Check" for example) - a tag._level: either "CRIT", "WARN", "OK", or "INFO" for UI checks (or configurable for custom checks) - tag_source_measurement: the measurement of your source data ("cpu" for example) - a tag._measurement: the measurement of the status data ("status") - a measurement._type: the type of check ("threshold" for example) - a tag._field: the field keys._message: the status message._source_timestamp: the timestamp of the source field that is being checked in ns precision${your source field}: the source field that is being checked.dead: an additional field specific to deadman checks. A boolean that represents whether the deadman signal has met the deadman check conditions.
- custom tags added to the query output during check configuration.
- any additional tags included in the query, resulting from the
v1.fieldsAsColsfunction. To view all of these tags, simply hover over a point in your query in the Data Explorer.
Viewing statuses in the InfluxDB UI
There are two places to view statuses in the InfluxDB UI: through the Alerts page and through the Data Explorer. To view the statuses through the Alerts page, click View History under the eye icon in the Checks panel.

To view the statuses through the Data Explorer, select data from the “_monitoring” bucket. The Data Explorer automatically applies the aggregateWindow() function to your time series data. A status includes the status message field which contains string value. As a result, you might encounter the following error message:

If this is the case, and you haven’t filtered out string fields, navigate to the Script Editor and comment out (? + /) or delete the aggregationWindow() function.

Commenting out the aggregateWindow() function allows you to visualize your statuses in the InfluxDB UI.
Striking a balance between tasks and checks
At this point in the document, hopefully you recognize that checks are just a task under the hood, but also that checks have been isolated in the InfluxDB API. You might also wonder why finding underlying tasks in the UI is cumbersome and why that obscurification exists. This decision was made to try and encourage users to execute transformation work in a separate task and discourage them from stuffing transformation and analytics work into a check. In other words, try to keep your custom tasks simple.
For example, let’s say you want to create a threshold check on the difference between two fields from separate measurements. The best practice is to first create a task that joins the fields from the two measurements with a join(), calculates the difference between them with a map(), and writes the output to a new measurement or bucket with the to() function. Then create a simple threshold check that queries the new data. Isolating data processing work in a separate task provides you with more visibility into your system and reduces the complexity of your check.
Finally, if the approach mentioned here gives you concerns about increasing your writes and cardinality to InfluxDB, you can always write the output of a task to a bucket with a small retention policy. Especially if you’re using that data in a check, you could reduce the retention policy to 2 or 3 times your Schedule Every interval. This design recommendation also applies to notification rules, discussed below.
Notification rules in InfluxDB
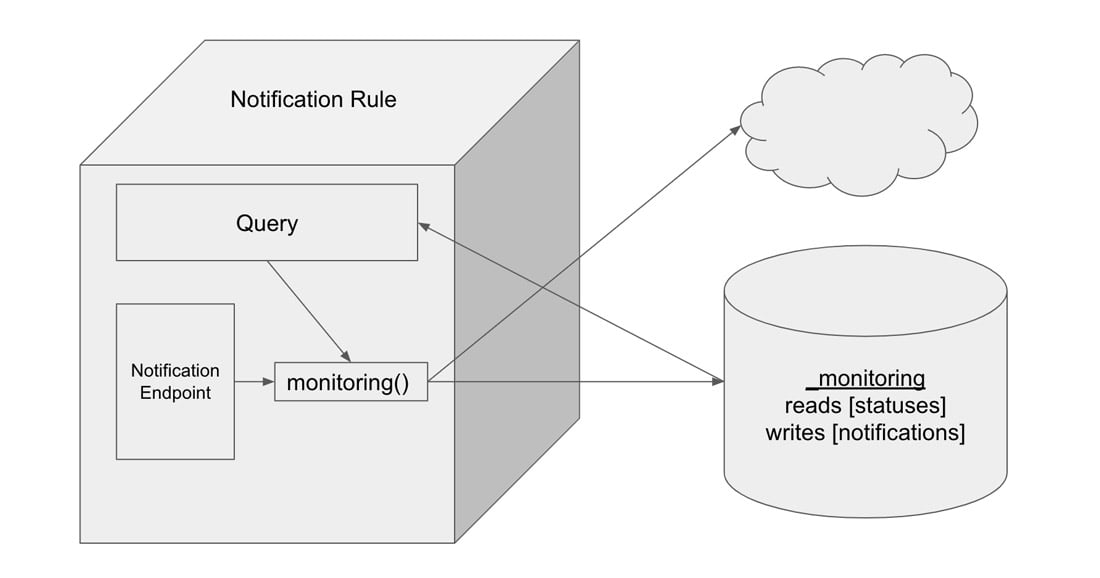
Notification rules in InfluxDB are a type of task, similar to a check. Notification rules query the status of a check from the “_monitoring” bucket, apply the notification rule to the status, log notification to the “_monitoring” bucket, and send a notification message to a notification endpoint. A notification is a type of time series data. Like statuses, notifications are written to the “_monitoring” bucket and are the output of a Flux task. While statuses are the output of a check, notifications are the output of a notification rule. A notification endpoint is metadata in a notification rule that enables notification messages to be sent to a third party service like HTTP, Slack, or PagerDuty. To summarize, it might be helpful to think of notification rules as being synonymous with alerts. However, these tasks are referred to as notification rules in the InfluxDB API and InfluxDB UI.
There are two ways to create notification rules. You can either create a notification rule through the UI, or you can write a custom notification rule with Flux. Before embarking on the multitude of ways that you can use InfluxDB to craft notification rules, it’s important to recognize that InfluxDB UI uses the InfluxDB v2 API, and all notification rules are written in Flux. Therefore a notification rule generated through the UI will be just as performant as a custom notification rule. Therein lies the power of InfluxDB and Flux - the developer truly has the ability to customize their time series workloads as they see fit.
Notification endpoints in the InfluxDB UI
The first step in creating a notification rule in the InfluxDB UI is to configure a notification endpoint. A notification endpoint is the third party service that you want to send your notification message to. The easiest way to configure a notification endpoint for your notification rule is through the InfluxDB UI. To create a notification endpoint, navigate to the Alerts page in the UI from the right-hand navigation menu, and click + Create. There are two steps to a notification endpoint through the UI:
- Specify your Destination
- Specify the Options
You can configure the HTTP, Slack, and PagerDuty endpoints through the InfluxDB UI. In the example below, we create a Slack notification endpoint, which we name “Slack Endpoint”.
Notification rules in the InfluxDB UI
The second step in creating a notification rule in the InfluxDB UI is to configure the notification rule conditions. These user-defined conditions describe which statuses should be converted to a notification and similarly which notification messages should be sent to the notification endpoint.
The easiest way to configure notification rule conditions and create a notification rule is through the InfluxDB UI. To create a notification rule, navigate to the Alerts page in the UI from the right hand navigation menu, click + Create. There are three steps to a notification endpoint through the UI:
- Include About information.
- Specify the notification rule Conditions.
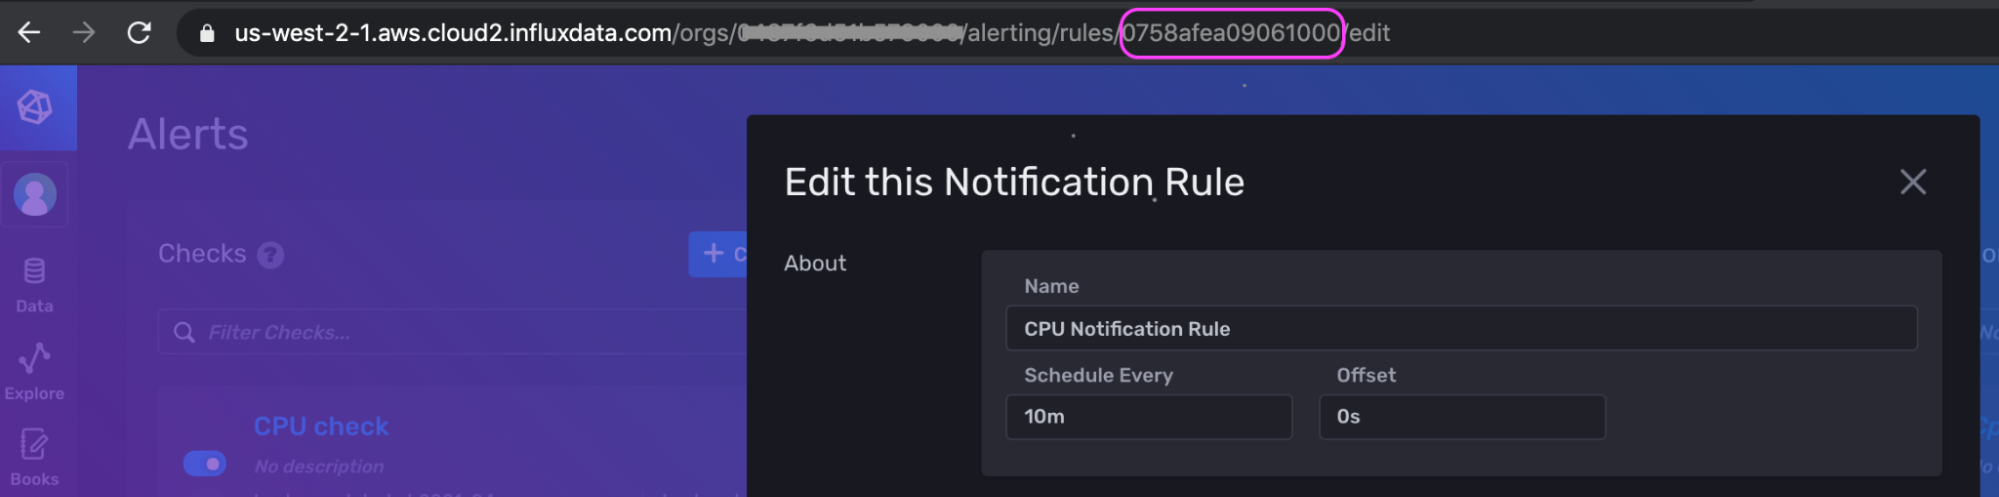
- Configure the notification Message options.
As part of the About information configuration, you must name your notification rule, specify the Schedule Every interval, and specify the Offset interval. In the example above, we name our notification rule “CPU Notification Rule” and Schedule Every interval of 10 minutes. For the notification Conditions, you must define the types of statuses that you want to create a notification and send a notification message for. In the example above, we’re creating a notification only when the level of our status is equal to “CRIT”. We also add a tag to this notification rule; the tag scopes this notification rule to a single check - “CPU check”. This tag is optional. If it wasn’t added, then our notification rule would send alerts for every status with a “_level” of “CRIT”.
Finally, specify the notification Message options including the notification endpoint that we want to send the notification message to and what you want the message to read. We select the notification endpoint we just created, “Slack Endpoint”. The default notification message looks like this:
Notification Rule: ${ r._notification_rule_name } triggered by check: ${ r._check_name }: ${ r._message }However, you can elect to include information from any of the columns in a notification message that is included in the output of a notification rule in the “_monitoring” bucket. The schema of a notification is described in the section “Notifications” below.
The Flux behind notification rules
To view the corresponding Flux script that’s generated, you can use the InfluxDB v2 API or the UI. To view the corresponding Flux script for the UI-generated notification rule, please follow the instructions under The Flux behind threshold checks section, as the process is identical.
To use the InfluxDB v2 API to get the corresponding Flux script for your UI-generated notification rule, use the notification rule ID to submit a GET request with your Token as an Authorization parameter. Here’s an example cURL request:
curl -X GET \
https://us-west-2-1.aws.cloud2.influxdata.com/api/v2/notificationRules/075...my_cnotification_rule_id...000/query \
-H 'authorization: Token Oxxx
.my_token...xxxBg==' \A quick way to get the notification rule ID is to look at the URL if you edit the notification rule in the UI.
Here’s the corresponding data portion of request which contains the Flux that generated the notification rule through the UI for the example above (the raw JSON output is escaped and has been cleaned for readability):
package main
//CPU Notification Rule
import "influxdata/influxdb/monitor"
import "slack"
import "influxdata/influxdb/secrets"
import "experimental"
option task = {name: "CPU Notification Rule ",
               every: 10m,
               offset: 0s}
slack_endpoint = slack["endpoint"](url: "https:hooks.slack.com/services/xxx/xxx/xxx")
notification = {_notification_rule_id: "0758afea09061000",
                _notification_rule_name: "CPU Notification Rule ",
                _notification_endpoint_id: "0754bad181a5b000",
                _notification_endpoint_name: "My slack",}
statuses = monitor["from"](start: -10s, fn: (r) = r["_check_name"] == "CPU Check")
crit = statuses
       |> filter(fn: (r) => r["_level"] == "crit")
all_statuses = crit
               |> filter(fn: (r) => (r["_time"] >= experimental["subDuration"](from: now(), d: 10m)))

all_statuses
|> monitor["notify"](data: notification,
                     endpoint: slack_endpoint(mapFn: (r) = (
{channel: "",
 text: "Notification Rule: ${ r._notification_rule_name } triggered by     check: ${ r._check_name }: ${ r._message }",
 color: if r["_level"] == "crit" then "danger" else if r["_level"] == "warn" then "warning" else "good"})))
We can see how the steps to generate a notification rule in the UI are defined by this corresponding Flux script. The task options are assigned to the option task variable which contains information on the name, Schedule Every interval, and offset interval for the notification rule. The slack.endpoint() function is used to configure the Slack notification endpoint. Every notification endpoint package in Flux contains a message and an endpoint function:
- The message function sends a single message to the destination.
- The endpoint function is a factory function that outputs another function.
The output function requires a mapFn parameter. The mapFn then builds the object used to generate the POST request. While message functions can send notification messages to your destinations, endpoint functions additionally write a notification to the “_monitoring” bucket and append additional notification data to your notification, specifically the data stored in the notification variable.
The status that we want to create a notification on is assigned to the statuses variable. The monitor.from() function retrieves check statuses stored in the statuses measurement in the “_monitoring” bucket. Our tag, which scopes the notification rule to statuses from our check “CPU Check”, is applied within the monitor.from() function. The status level condition is stored in the crit variable which filters the output of statuses for statuses with a level of “CRIT”. The all_statuses variable uses the experimental.subDuration() function to filter for “CRIT” level statuses that have been written with the Schedule Every interval. Finally, the all_statuses output is fed into the monitor.notify() function. This function has two required parameters: data and endpoint. The data parameter includes the additional information you want to append to your notification. The endpoint parameter specifies the function that constructs and sends the notification, i.e. slack_endpoint.
Creating a custom notification rule
The InfluxDB UI makes creating simple notification rules very easy, but it falls short in its ability to highlight the sophistication of the notification system within InfluxDB. Flux allows you to transform your data in almost any way you see fit. The steps to create a custom notification rule are similar to the steps as defined by the UI. This same logic can be applied towards creating your own custom notification rule. While the UI enables you to configure notification endpoints for HTTP, Slack, and PagerDuty, Flux has many more notification endpoint packages to take advantage of.
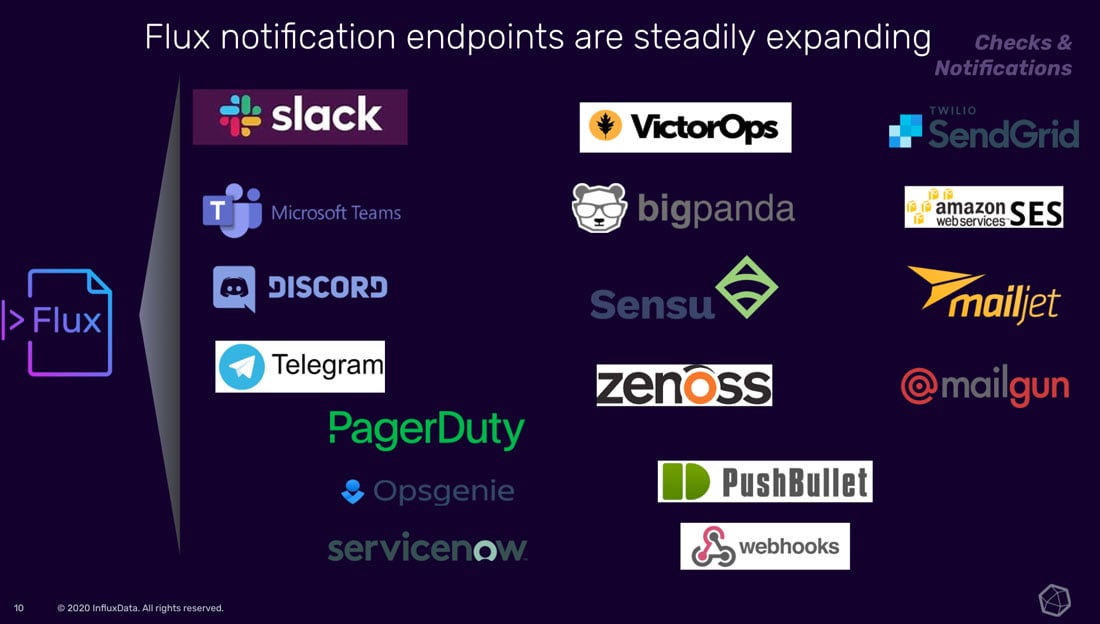
For our custom notification rule, we’ll use the Telegram Flux Package to send a notification to Telegram instead of Slack. When writing a custom notification rule, make sure to import the correct notification endpoint package, import "contrib/sranka/telegram". Then configure the endpoint function. The telegram.endpoint() function requires that you specify your Telegram bot token. In this custom notification rule, we’ll send a notification any time our status level is “CRIT” or “WARN”. This additional filtering is assigned to the critOrWarn variable. Finally, make sure to include a _notification_rule_id and a _notification_endpoint_id. These ID’s must be 16 characters long and alphanumeric.
package main
//CPU Notification Rule for Telegram
import "influxdata/influxdb/monitor"
// import the correct package
import "contrib/sranka/telegram"
import "influxdata/influxdb/secrets"
import "experimental"
option task = {name: "CPU Notification Rule for Telegram ",
               every: 10m,
               offset: 0s}
telegram_endpoint = telegram["endpoint"](
  url: "https://api.telegram.org/bot",
  token: "S3crEtTel3gRamT0k3n",
)

notification = {_notification_rule_id: "0000000000000002", //alphanumeric, 16 characters
                _notification_rule_name: "CPU Notification Rule for Telegram",
                _notification_endpoint_id: "0000000000000002", //alphanumeric, 16 characters
                _notification_endpoint_name: "My slack",}
statuses = monitor["from"](start: -10s, fn: (r) = r["_check_name"] == "CPU Check")
critOrWarn = statuses
       |> filter(fn: (r) => r["_level"] == "crit" or r["_level"] == "warn") //altered to include two levels
all_statuses = critOrWarn
               |> filter(fn: (r) => (r["_time"] >= experimental["subDuration"](from: now(), d: 10m)))

all_statuses
|> monitor["notify"](data: not
ification, endpoint: slack_endpoint(mapFn: (r) = ( {channel: “”, text: “Notification Rule: ${ r._notification_rule_name } triggered by check: ${ r._check_name }: ${ r._message }”, color: if r[“_level”] == “crit” then “danger” else if r[“_level”] == “warn” then “warning” else “good”})))</code></pre> Finally, keep in mind that you can also use other Flux functions to further customize your notification rules and monitor states:
- stateDuration(): allows you to determine how long a state persists.
- stateCount(): allows you to count the number of consecutive states.
Also, the Flux InfluxDB Monitor Package contains more than just the monitor.notify() and monitor.from() function. Use the following functions to add more sophistication to your custom notification rules:
- monitor.stateChanges(): allows you to detect changes in the '_level' column from one level to another specific level.
- monitor.stateChangesOnly(): allows you to detect all changes in the '_level' column from any level to any other level.
Notifications
A notification is the time series data that is the output of a notification rule. It’s helpful to recognize the parallel between statuses and notifications. Statuses are to checks as notifications are to notification rules. It follows that a notification closely matches a status and contains the following schema:
_time: the time that the notification rule was executed._check_id: each check is assigned a check ID. Check ID's can be used for debugging and rerunning failed checks - a tag._check_name: the name of your check (CPU Check for example) - a tag._notification_rule_id: each notification rule is assigned a notification rule ID. Notification rule ID's can be used for debugging and rerunning failed notification rules - a tag._notification_rule_name: the name of your notification rule (CPU Check Notification Rule) for example - a tag._notification_endpoint_id: each notification endpoint is assigned a notification endpoint ID. Notification endpoint ID's can be used for debugging and rerunning failed notification rules - a tag._source_measurement: the measurement of your source data (cpu for example) - a tag._measurement: the measurement of the notification rule data ('notifications') - a measurement._sent: a boolean that represents whether the notification message has been sent to the notification endpoint - a tag_type: the type of check that your notification rule is applied towards ('threshold' for example) - a tag._level: the level of the corresponding check ('CRIT' for example) - a tag._field: the field keys._message: the notification message._status_timestamp: the timestamp of the status assigned to your source field from the checked in ns precision._source_timestamp: the timestamp of the source field that is being checked in ns precision.${your source field}: the source field value that is being checked.
- custom tags added to the query output during notification configuration.
- any additional columns included in the query, resulting from the
v1.fieldsAsColsfunction from the corresponding check.
Further reading and resources on the InfluxDB checks and notifications system
While this post aims to provide a comprehensive overview of the capabilities of the checks and notifications system in InfluxDB, the following resource might also interest you:
- TL;DR InfluxDB Tech Tips - Monitoring Tasks and Finding the Source of Runaway Cardinality: This post describes the advantages of applying the Operational Monitoring Template. This template can help you ensure that your tasks are running successfully. For example, imagine that you've included custom tags as a part of your UI-generated check and those tags are included in your status message. If the underlying task responsible for adding those tags fails, then your check will fail. Applying the Operational Monitoring Template can help you discover root causes for custom task or check failure.
- TL;DR InfluxDB Tech Tips - Using Tasks and Checks for Monitoring with InfluxDB: This post describes the basics of creating UI-generated checks as well as their limitations in a little more detail, in case you need it.
- TL;DR InfluxDB Tech Tips - How to Monitor States with InfluxDB: This post describes some of the intricacies and functions of the Flux InfluxDB Monitoring Package - a necessary tool in any developer's toolkit looking to execute meaningful tasks with InfluxDB.
- TL;DR InfluxDB Tech Tips: Configuring a Slack Notification with InfluxDB: This post demonstrates how to create a Slack Notification through the UI. Specifically, how to enable Slack integrations and gather a Slack Webhook URL.
- Custom Checks: Another custom check example from the docs. Use this custom check as a template to help you craft a custom check with Flux.
- Telegram Flux Package: This tutorial demonstrates how to set up a Telegram bot and use the Telegram Flux package for a custom notification rule.
- Contributing Third Party Flux Packages: A Discord Endpoint Flux Function: This post describes how to contribute your own third party Flux package. Specifically, it describes how to contribute a Discord Endpoint package. If a Flux notification endpoint package that you need isn't available, consider contributing one yourself!
Conclusion on the InfluxDB Checks and Notifications system
InfluxDB’s Checks and Notifications system is highly customizable and enables users to take action on their time series data. All checks and notifications are Flux tasks under the hood. The main difference between checks and notifications and other tasks is that checks and notifications read and write data to and from the ‘_monitoring’ bucket. They also use specialized Flux packages like the Flux InfluxDB Monitor Package and notification endpoint packages.
I hope this post inspires you to take advantage of the InfluxDB checks and notifications system and build your own custom checks and notifications. Share your thoughts, concerns, or questions in the comments section, on our community site or in our Slack channel. We’d love to get your feedback and help you with any problems you run into! And as always, we encourage you to share your story and let us know about the cool projects you’re developing with or on top of InfluxDB.
